| Param | Original file | Final file |
|---|---|---|
| Filename | modeM0/AS1G07_027T01_9000001304_09272cztM0_level2.evt | modeM0/AS1G07_027T01_9000001304_09272cztM0_level2_quad_clean.evt |
| Size (bytes) | 671,371,200 | 116,455,680 |
| Size | 640.3 MB | 111.1 MB |
| Events in quadrant A | 7,040,425 | 731,487 |
| Events in quadrant B | 4,233,199 | 755,860 |
| Events in quadrant C | 3,980,787 | 740,324 |
| Events in quadrant D | 4,507,597 | 714,089 |
| Mode M9 | |||
|---|---|---|---|
| Quadrant | BADHDUFLAG | Total packets | Discarded packets |
| A | 0 | 16 | 0 |
| B | 0 | 16 | 0 |
| C | 0 | 16 | 0 |
| D | 0 | 16 | 0 |
| Mode M0 | |||
|---|---|---|---|
| Quadrant | BADHDUFLAG | Total packets | Discarded packets |
| A | 0 | 27070 | 467 |
| B | 0 | 17968 | 230 |
| C | 0 | 17511 | 247 |
| D | 0 | 19270 | 376 |
| Mode SS | |||
|---|---|---|---|
| Quadrant | BADHDUFLAG | Total packets | Discarded packets |
| A | 0 | 174 | 4 |
| B | 0 | 174 | 0 |
| C | 0 | 174 | 4 |
| D | 0 | 174 | 2 |
| Quadrant | Total seconds | Saturated seconds | Saturation percentage |
|---|---|---|---|
| A | 8402 | 502 | 5.974768% |
| B | 8439 | 117 | 1.386420% |
| C | 8430 | 87 | 1.032028% |
| D | 8431 | 200 | 2.372198% |
Noise dominated data is calculated using 1-second bins in cleaned event files. If a bin has >2000 counts, and if more than 50% of those come from <1% of pixels, then it is considered to be noise-dominated and hence unusable.
| Quadrant | # 1 sec bins | Bins with >0 counts | Bins with >2000 counts | High rate bins dominated by noise | Noise dominated (total time) | Noise dominated (detector-on time) | Marked lightcurve |
|---|---|---|---|---|---|---|---|
| A | 10131 | 8524 | 126 | 126 | 1.24% | 1.48% | 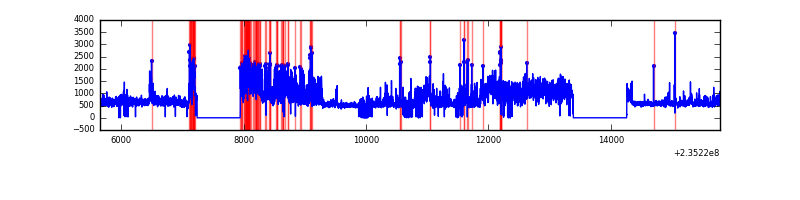 |
| B | 10131 | 8536 | 6 | 6 | 0.06% | 0.07% | 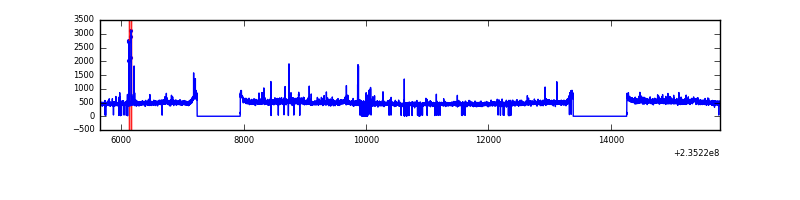 |
| C | 10131 | 8538 | 2 | 2 | 0.02% | 0.02% | 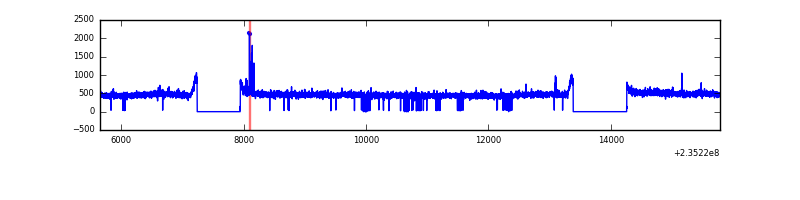 |
| D | 10131 | 8523 | 82 | 82 | 0.81% | 0.96% | 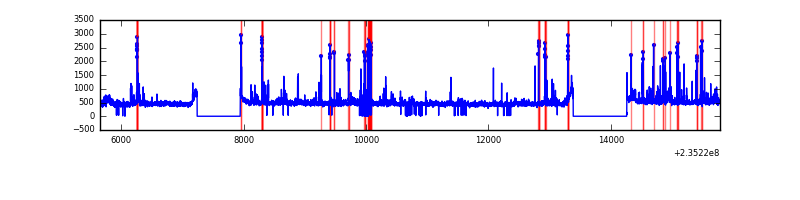 |
Top three noisy pixels from each quadrant. If the there are fewer than three noisy pixels in the level2.evt file, extra rows are filled as -1
| Pixel properties | Quadrant properties | ||||||
|---|---|---|---|---|---|---|---|
| Quadrant | DetID | PixID | Counts | Sigma | Mean | Median | Sigma |
| A | 8 | 5 | 2598730 | 12285.85 | 1029 | 1008 | 211.4 |
| A | 4 | 2 | 164931 | 775.27 | 1029 | 1008 | 211.4 |
| A | 5 | 16 | 153232 | 719.94 | 1029 | 1008 | 211.4 |
| B | 0 | 214 | 64392 | 311.03 | 1050 | 1028 | 203.7 |
| B | 0 | 230 | 25416 | 119.71 | 1050 | 1028 | 203.7 |
| B | 12 | 111 | 21791 | 101.92 | 1050 | 1028 | 203.7 |
| C | 14 | 234 | 28115 | 115.18 | 1012 | 1021 | 235.2 |
| C | 13 | 61 | 7587 | 27.91 | 1012 | 1021 | 235.2 |
| C | 9 | 68 | 5238 | 17.93 | 1012 | 1021 | 235.2 |
| D | 1 | 52 | 314673 | 1146.12 | 1000 | 980 | 273.7 |
| D | 12 | 233 | 169135 | 614.38 | 1000 | 980 | 273.7 |
| D | 2 | 136 | 122497 | 443.98 | 1000 | 980 | 273.7 |
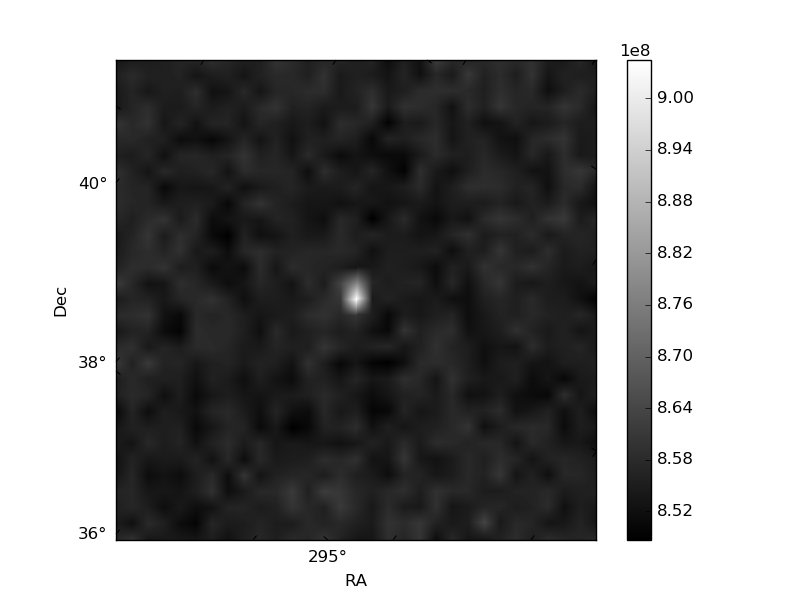
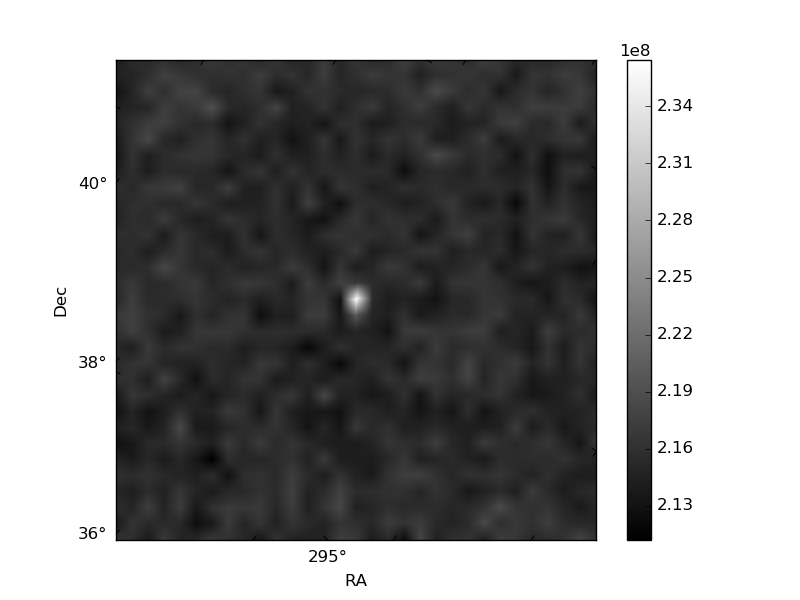
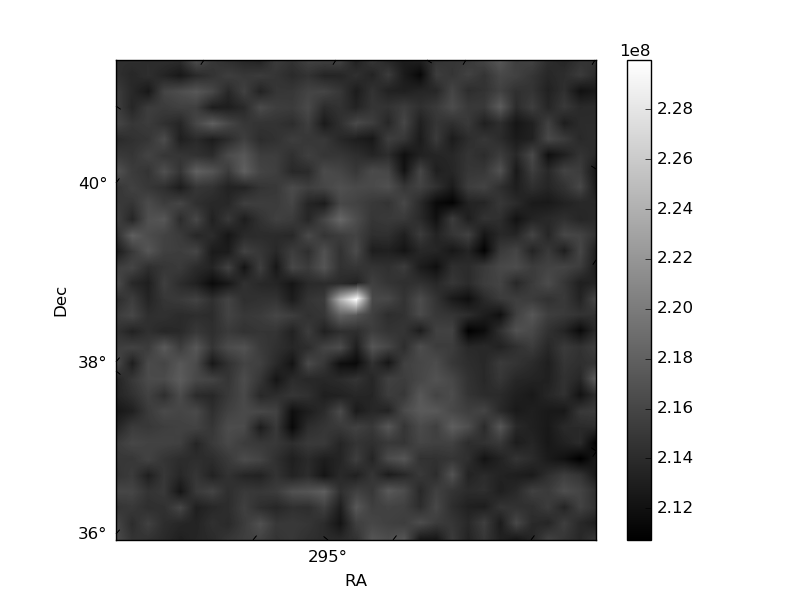
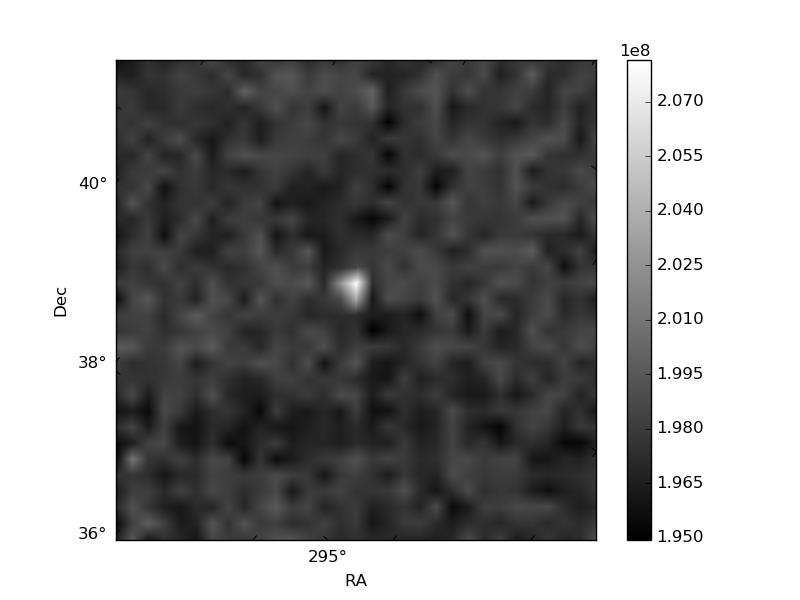
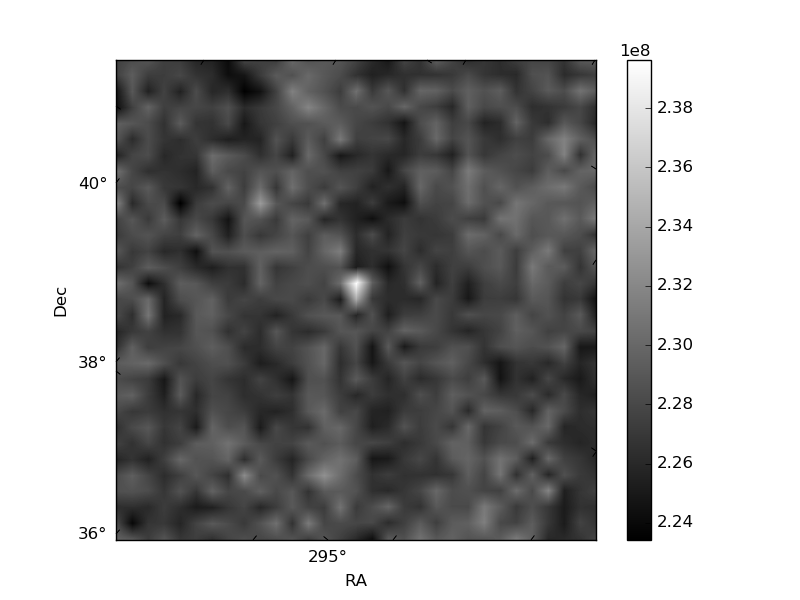
Histogram calculated using DETX and DETY for each event in the final _common_clean file
| Quadrant A | 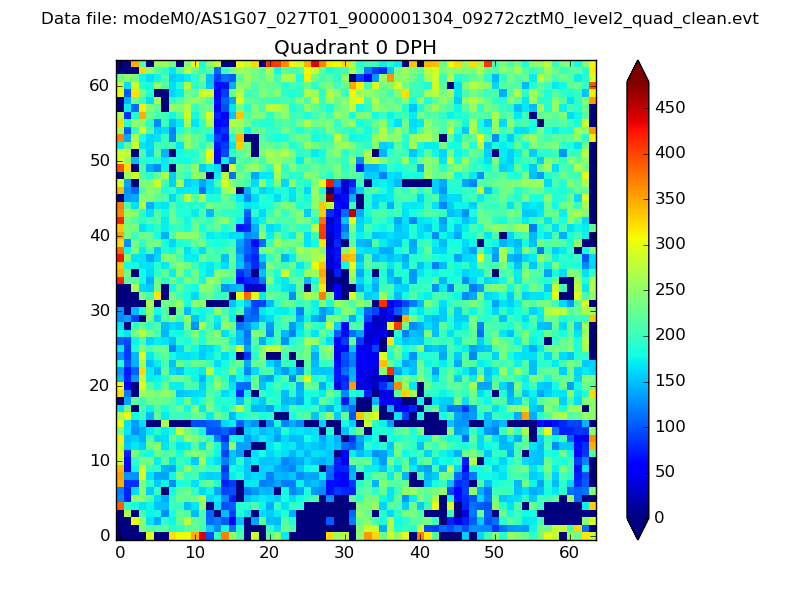 |
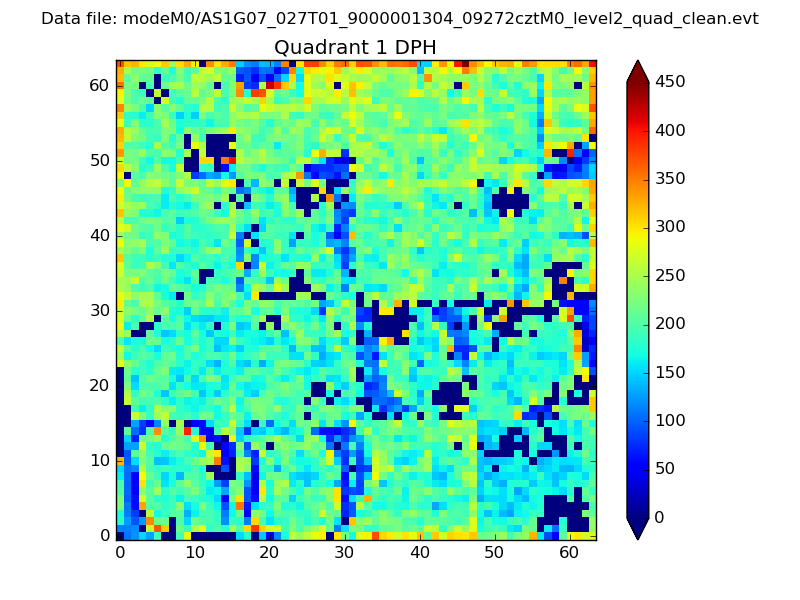 |
Quadrant B |
|---|---|---|---|
| Quadrant D | 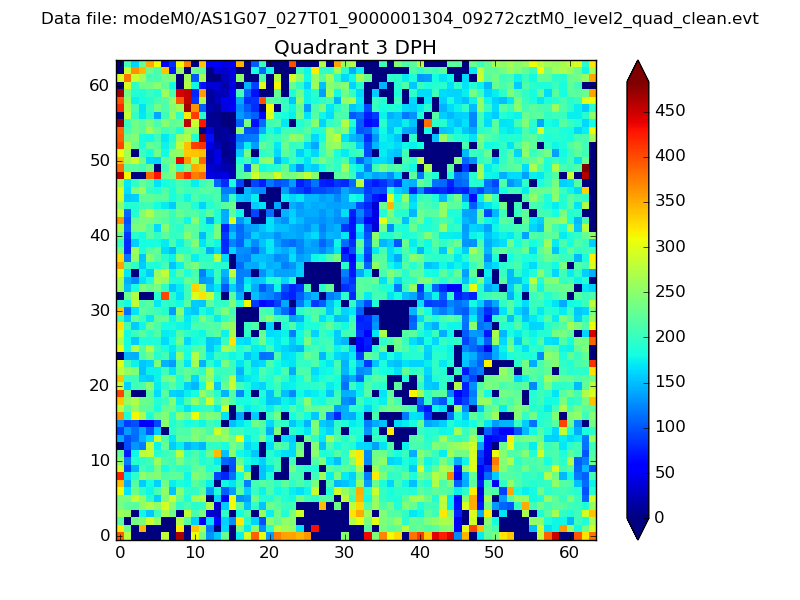 |
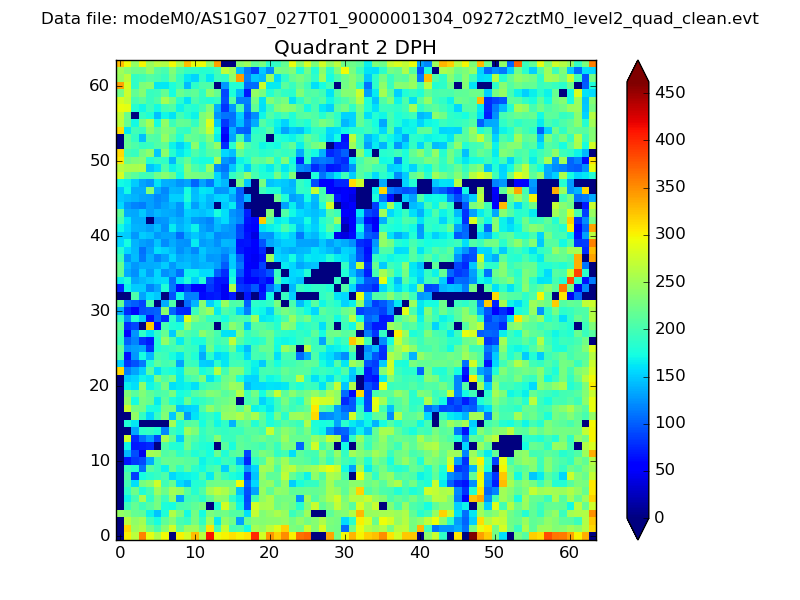 |
Quadrant C |
| Plot type | Count rate plots | Images |
|---|---|---|
| Comparison with Poisson distribution Blue bars denote a histogram of data divided into 1 sec bins. Red curve is a Poisson curve with rate = median count rate of data. |
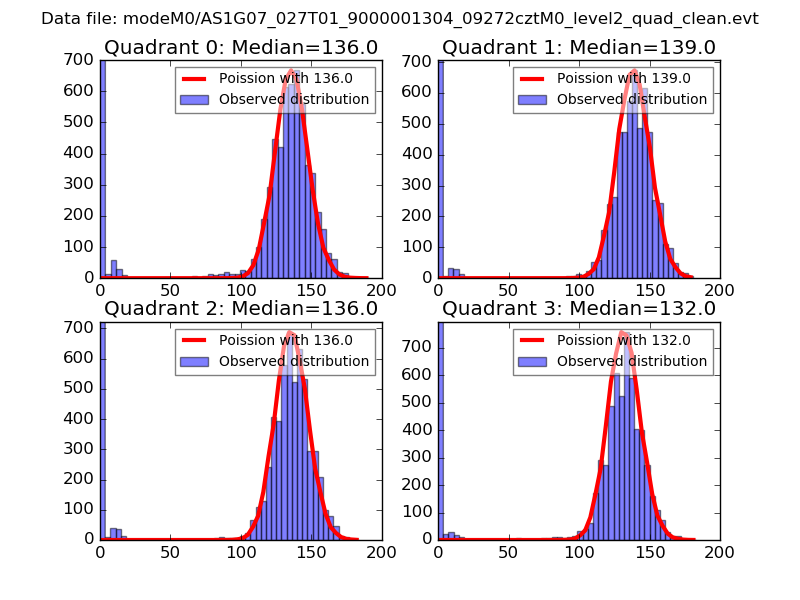 |
 |
| Quadrant-wise count rates Data is divided into 100 sec bins |
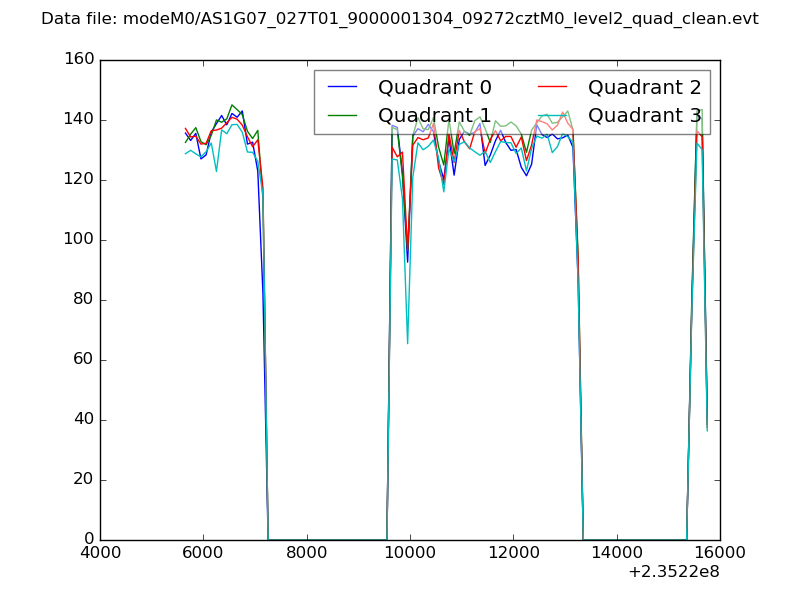 |
|
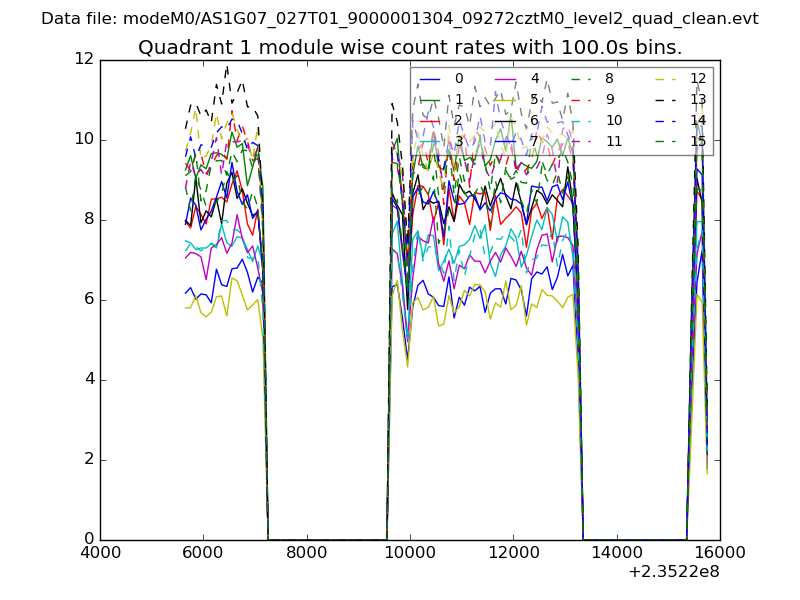
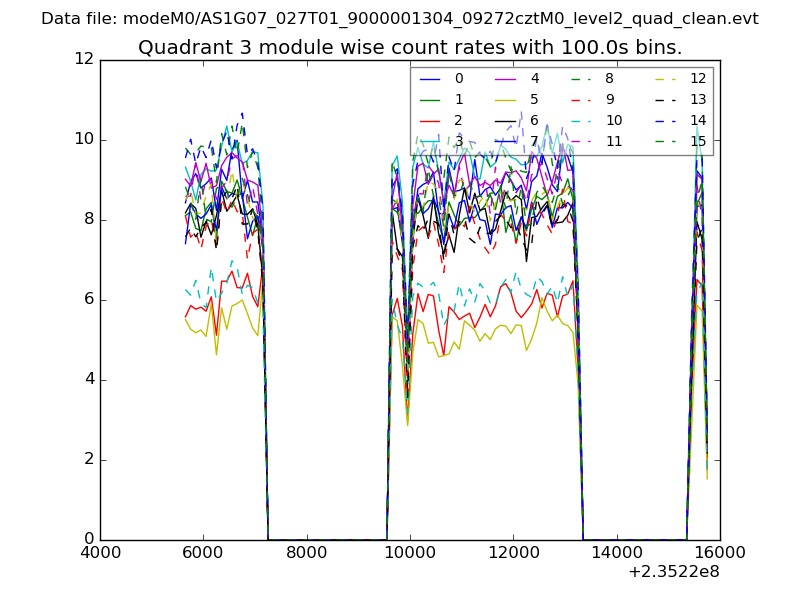
| Module-wise count rates for Quadrant A Data is divided into 100 sec bins |
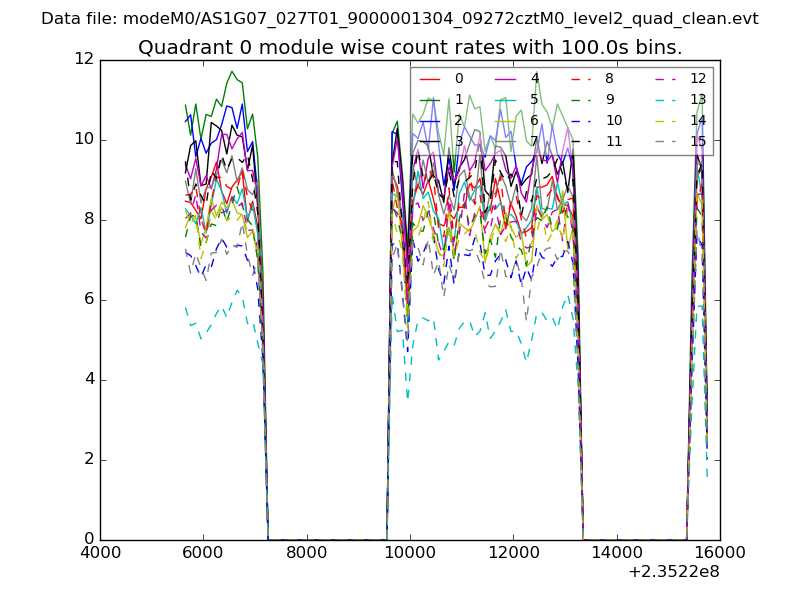 |
 |
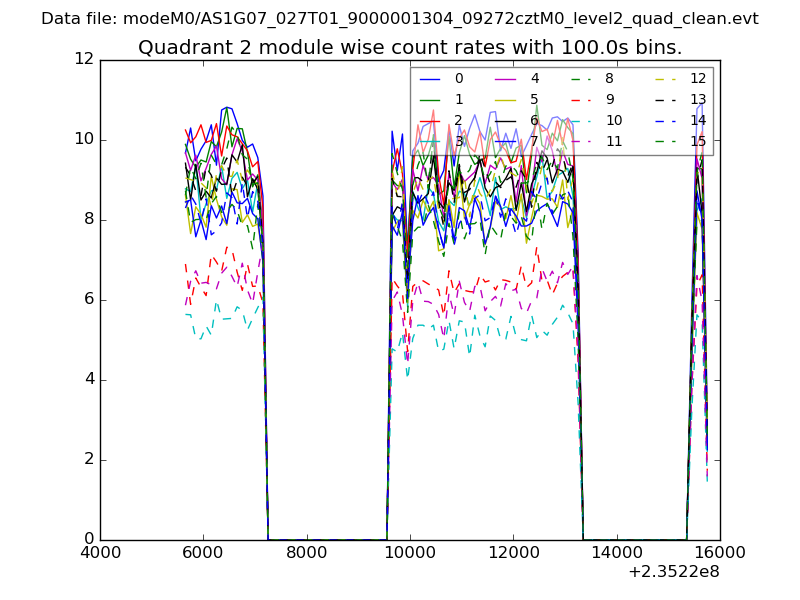
| Module-wise count rates for Quadrant B Data is divided into 100 sec bins |
 |
 |
| Module-wise count rates for Quadrant C Data is divided into 100 sec bins |
 |
 |
| Module-wise count rates for Quadrant D Data is divided into 100 sec bins |
 |
 |
| Parameter | Plot |
|---|---|
| CZT HV Monitor |  |
| D_VDD | 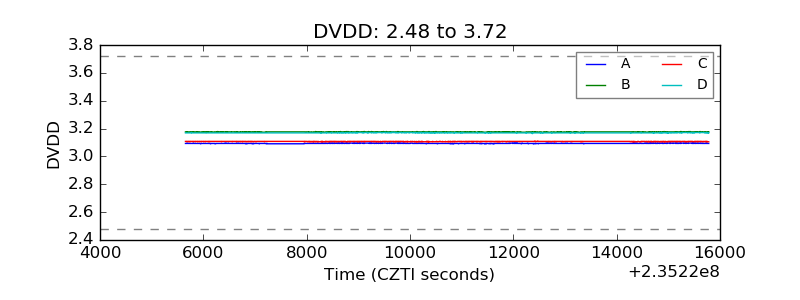 |
| Temperature 1 | 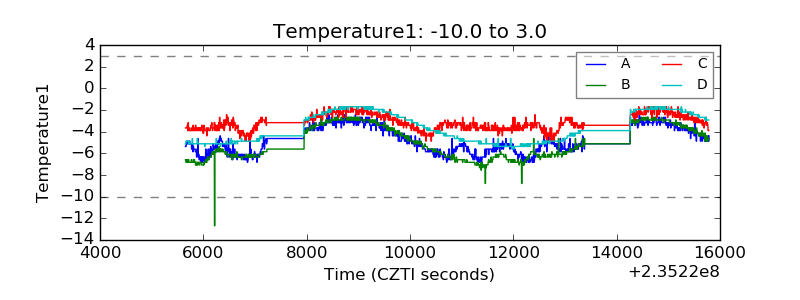 |
| Veto HV Monitor | 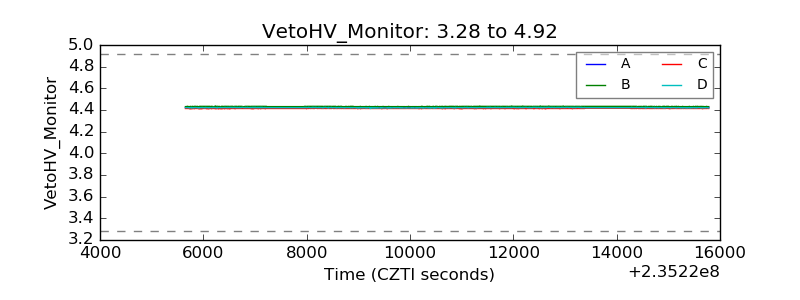 |
| Veto LLD | 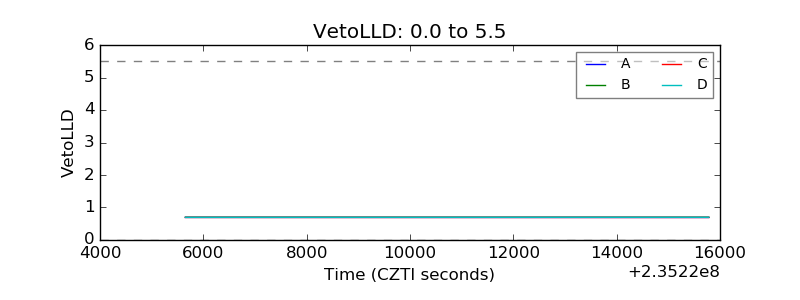 |
| Alpha Counter | 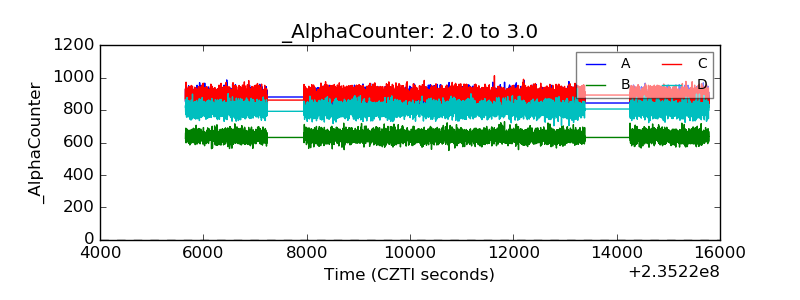 |
| _CPM_Rate | 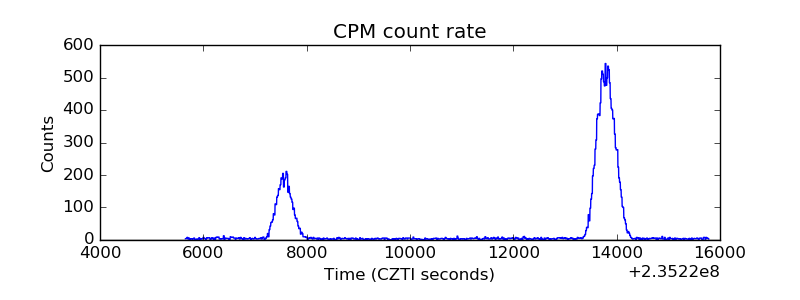 |
| CZT Counter |  |
| +2.5 Volts monitor | 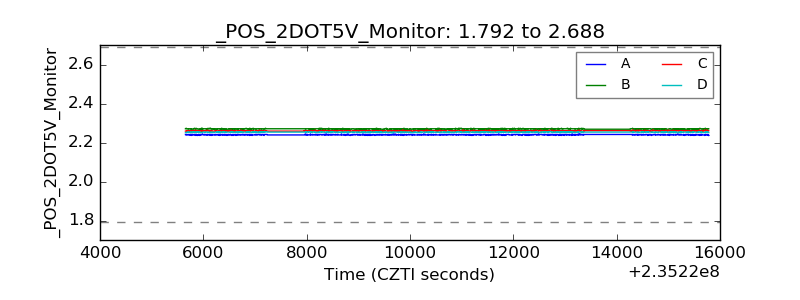 |
| +5 Volts monitor |  |
| _ROLL_ROT | 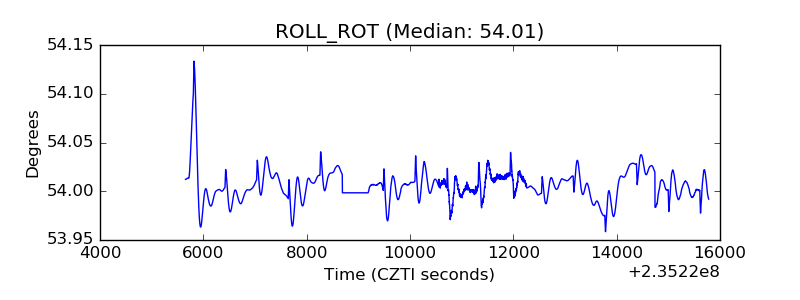 |
| _Roll_DEC | 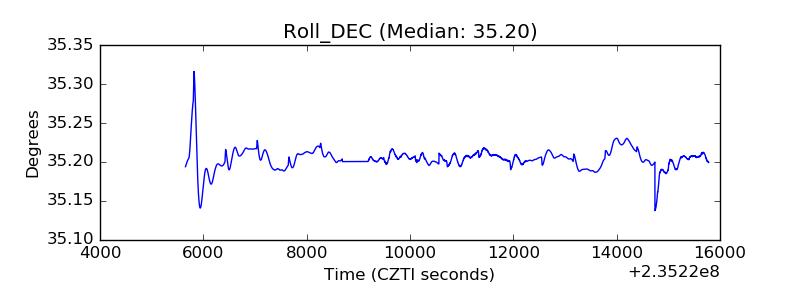 |
| _Roll_RA | 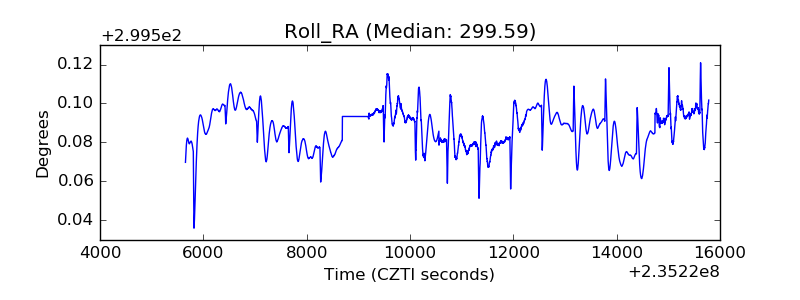 |
| Veto Counter | 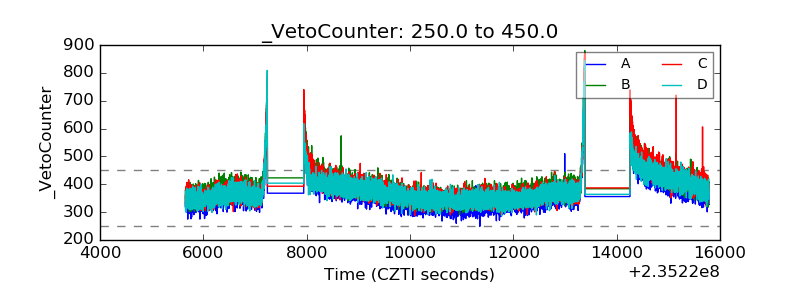 |