| Param | Original file | Final file |
|---|---|---|
| Filename | modeM0/AS1G07_077T01_9000001306cztM0_level2.fits | modeM0/AS1G07_077T01_9000001306cztM0_level2_quad_clean.evt |
| Size (bytes) | 406,848,960 | 362,946,240 |
| Size | 388.0 MB | 346.1 MB |
| Events in quadrant A | 2,398,536 | 2,046,798 |
| Events in quadrant B | 2,387,722 | 2,105,900 |
| Events in quadrant C | 2,446,322 | 2,026,476 |
| Events in quadrant D | 2,073,366 | 1,798,994 |
| Mode M0 | |||
|---|---|---|---|
| Quadrant | BADHDUFLAG | Total packets | Discarded packets |
| A | 0 | 114704 | 0 |
| B | 0 | 92627 | 0 |
| C | 0 | 90034 | 0 |
| D | 0 | 106430 | 0 |
| Mode SS | |||
|---|---|---|---|
| Quadrant | BADHDUFLAG | Total packets | Discarded packets |
| A | 0 | 892 | 0 |
| B | 0 | 890 | 0 |
| C | 0 | 908 | 0 |
| D | 0 | 912 | 0 |
| Mode M9 | |||
|---|---|---|---|
| Quadrant | BADHDUFLAG | Total packets | Discarded packets |
| A | 0 | 77 | 0 |
| B | 0 | 71 | 0 |
| C | 0 | 73 | 0 |
| D | 0 | 72 | 0 |
| Quadrant | Total seconds | Saturated seconds | Saturation percentage |
|---|---|---|---|
| A | 43768 | 1149 | 2.625206% |
| B | 43926 | 725 | 1.650503% |
| C | 43964 | 437 | 0.993995% |
| D | 43776 | 1703 | 3.890260% |
Noise dominated data is calculated using 1-second bins in cleaned event files. If a bin has >2000 counts, and if more than 50% of those come from <1% of pixels, then it is considered to be noise-dominated and hence unusable.
| Quadrant | # 1 sec bins | Bins with >0 counts | Bins with >2000 counts | High rate bins dominated by noise | Noise dominated (total time) | Noise dominated (detector-on time) | Marked lightcurve |
|---|---|---|---|---|---|---|---|
| A | 56528 | 45233 | 0 | 0 | 0.00% | 0.00% |  |
| B | 56528 | 45318 | 0 | 0 | 0.00% | 0.00% | 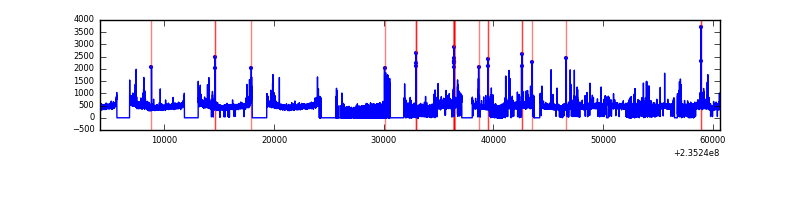 |
| C | 56528 | 45343 | 0 | 0 | 0.00% | 0.00% |  |
| D | 56528 | 45137 | 0 | 0 | 0.00% | 0.00% | 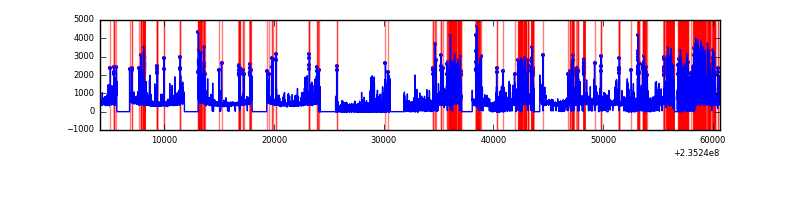 |
Top three noisy pixels from each quadrant. If the there are fewer than three noisy pixels in the level2.evt file, extra rows are filled as -1
| Pixel properties | Quadrant properties | ||||||
|---|---|---|---|---|---|---|---|
| Quadrant | DetID | PixID | Counts | Sigma | Mean | Median | Sigma |
| A | 0 | 29 | 2312 | 10.95 | 624 | 585 | 157.7 |
| A | 7 | 110 | 2041 | 9.23 | 624 | 585 | 157.7 |
| A | 0 | 28 | 1763 | 7.47 | 624 | 585 | 157.7 |
| B | 2 | 9 | 2056 | 11.75 | 628 | 599 | 124.0 |
| B | 12 | 226 | 1611 | 8.16 | 628 | 599 | 124.0 |
| B | 3 | 17 | 1603 | 8.09 | 628 | 599 | 124.0 |
| C | 1 | 80 | 1849 | 7.37 | 645 | 600 | 169.4 |
| C | 1 | 81 | 1781 | 6.97 | 645 | 600 | 169.4 |
| C | 12 | 241 | 1720 | 6.61 | 645 | 600 | 169.4 |
| D | 3 | 14 | 1575 | 6.5 | 589 | 532 | 160.5 |
| D | 6 | 231 | 1558 | 6.39 | 589 | 532 | 160.5 |
| D | 3 | 31 | 1548 | 6.33 | 589 | 532 | 160.5 |
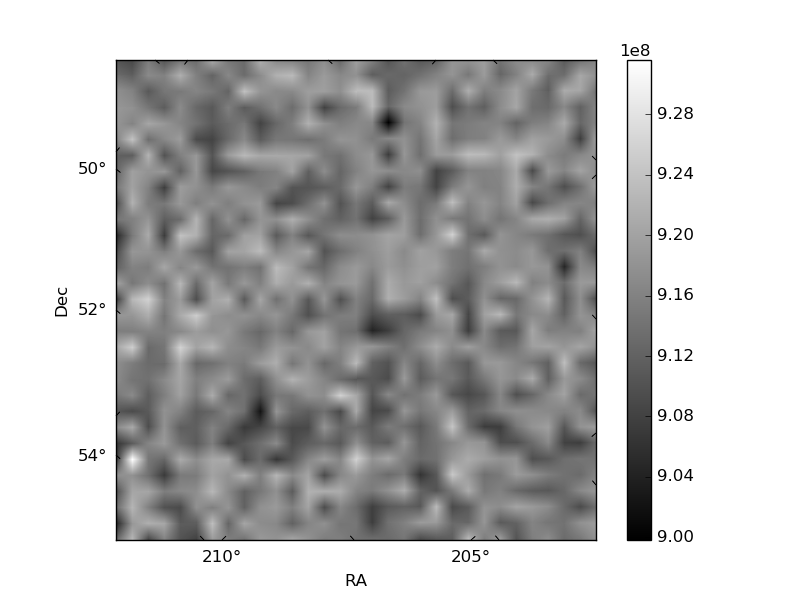
Histogram calculated using DETX and DETY for each event in the final _common_clean file
| Quadrant A | 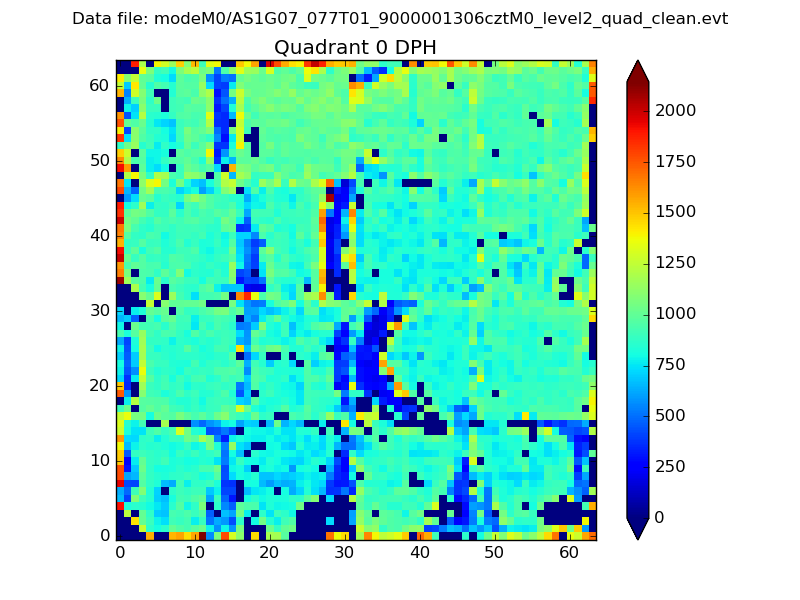 |
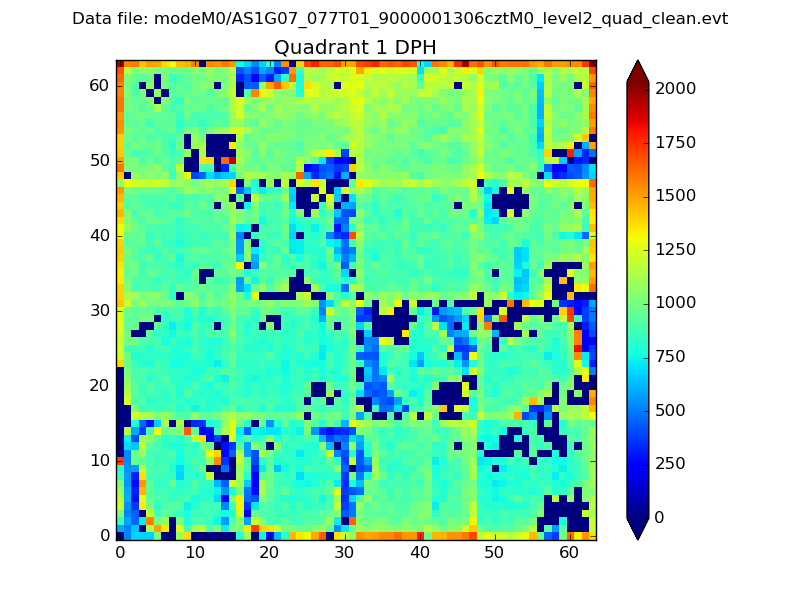 |
Quadrant B |
|---|---|---|---|
| Quadrant D |  |
 |
Quadrant C |
| Plot type | Count rate plots | Images |
|---|---|---|
| Comparison with Poisson distribution Blue bars denote a histogram of data divided into 1 sec bins. Red curve is a Poisson curve with rate = median count rate of data. |
 |
 |
| Quadrant-wise count rates Data is divided into 100 sec bins |
 |
|
| Module-wise count rates for Quadrant A Data is divided into 100 sec bins |
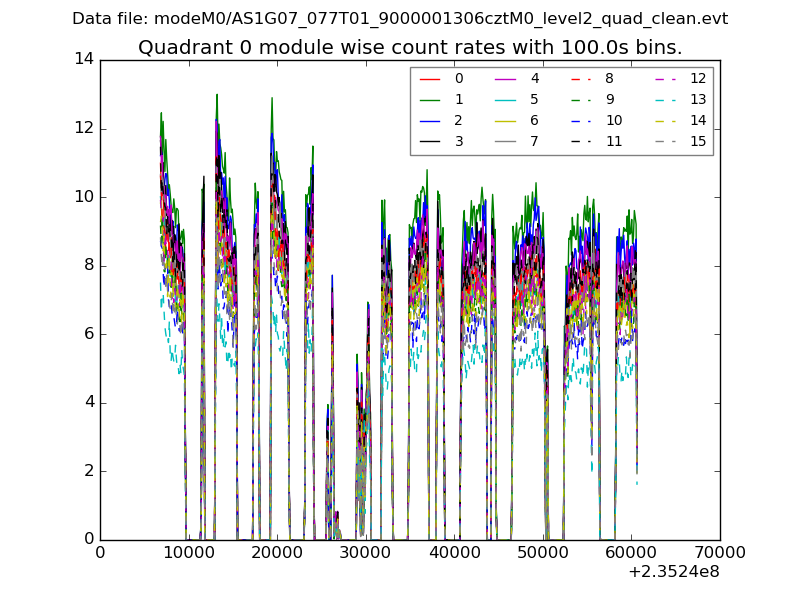 |
 |
| Module-wise count rates for Quadrant B Data is divided into 100 sec bins |
 |
 |
| Module-wise count rates for Quadrant C Data is divided into 100 sec bins |
 |
 |
| Module-wise count rates for Quadrant D Data is divided into 100 sec bins |
 |
 |
| Parameter | Plot |
|---|---|
| CZT HV Monitor | 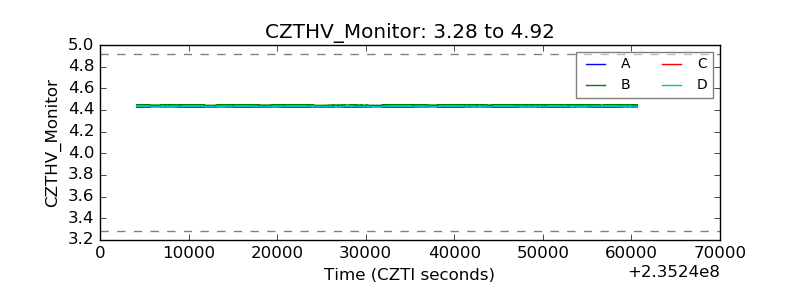 |
| D_VDD |  |
| Temperature 1 | 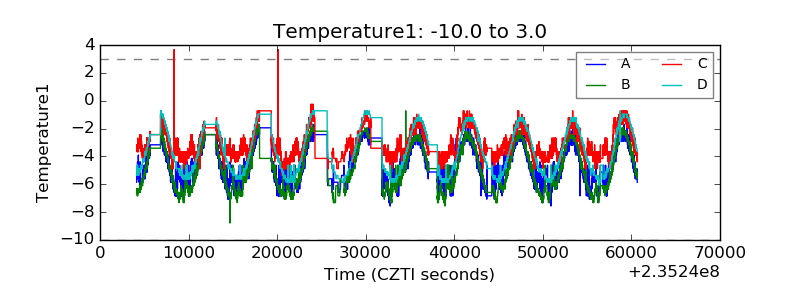 |
| Veto HV Monitor |  |
| Veto LLD | 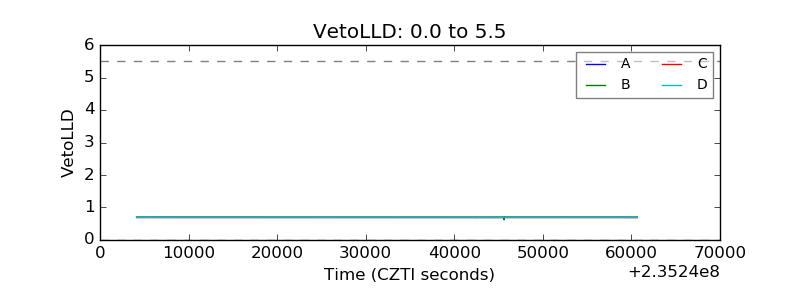 |
| Alpha Counter |  |
| _CPM_Rate |  |
| CZT Counter | 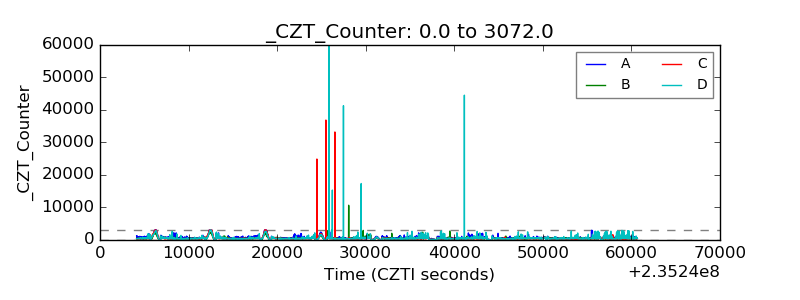 |
| +2.5 Volts monitor |  |
| +5 Volts monitor |  |
| _ROLL_ROT | 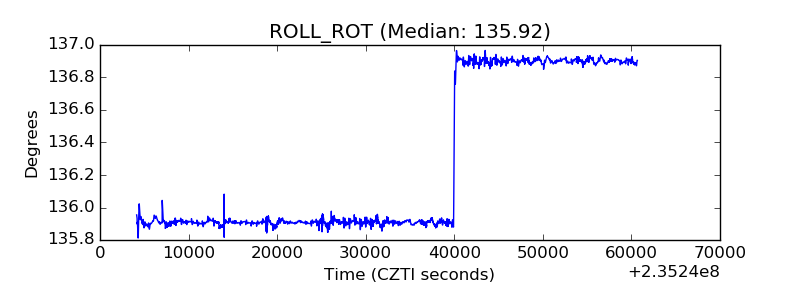 |
| _Roll_DEC |  |
| _Roll_RA |  |
| Veto Counter |  |