| Param | Original file | Final file |
|---|---|---|
| Filename | modeM0/AS1G07_077T01_9000001306_09275cztM0_level2.evt | modeM0/AS1G07_077T01_9000001306_09275cztM0_level2_quad_clean.evt |
| Size (bytes) | 220,147,200 | 29,825,280 |
| Size | 209.9 MB | 28.4 MB |
| Events in quadrant A | 2,169,096 | 174,558 |
| Events in quadrant B | 1,420,575 | 181,408 |
| Events in quadrant C | 1,330,680 | 180,554 |
| Events in quadrant D | 1,559,263 | 170,360 |
| Mode M0 | |||
|---|---|---|---|
| Quadrant | BADHDUFLAG | Total packets | Discarded packets |
| A | 0 | 8441 | 2 |
| B | 0 | 6000 | 1 |
| C | 0 | 5723 | 1 |
| D | 0 | 6394 | 1 |
| Mode SS | |||
|---|---|---|---|
| Quadrant | BADHDUFLAG | Total packets | Discarded packets |
| A | 0 | 56 | 0 |
| B | 0 | 56 | 0 |
| C | 0 | 56 | 0 |
| D | 0 | 56 | 0 |
| Mode M9 | |||
|---|---|---|---|
| Quadrant | BADHDUFLAG | Total packets | Discarded packets |
| A | 0 | 12 | 0 |
| B | 0 | 12 | 0 |
| C | 0 | 12 | 0 |
| D | 0 | 12 | 0 |
| Quadrant | Total seconds | Saturated seconds | Saturation percentage |
|---|---|---|---|
| A | 2736 | 75 | 2.741228% |
| B | 2736 | 22 | 0.804094% |
| C | 2736 | 20 | 0.730994% |
| D | 2736 | 54 | 1.973684% |
Noise dominated data is calculated using 1-second bins in cleaned event files. If a bin has >2000 counts, and if more than 50% of those come from <1% of pixels, then it is considered to be noise-dominated and hence unusable.
| Quadrant | # 1 sec bins | Bins with >0 counts | Bins with >2000 counts | High rate bins dominated by noise | Noise dominated (total time) | Noise dominated (detector-on time) | Marked lightcurve |
|---|---|---|---|---|---|---|---|
| A | 3901 | 2737 | 8 | 8 | 0.21% | 0.29% | 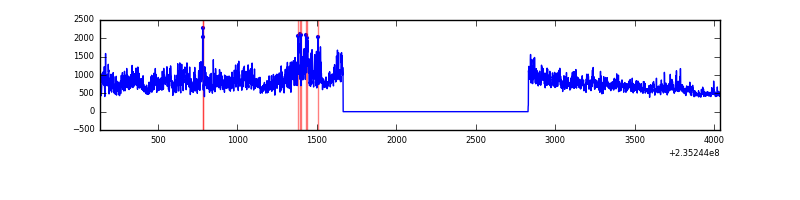 |
| B | 3901 | 2737 | 0 | 0 | 0.00% | 0.00% | 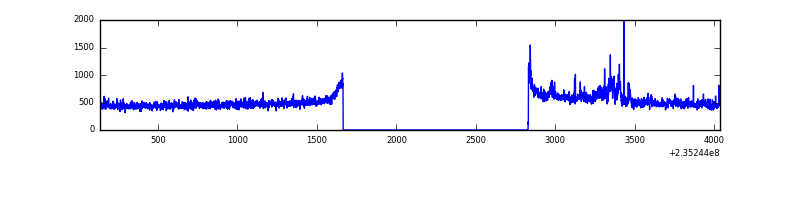 |
| C | 3901 | 2737 | 0 | 0 | 0.00% | 0.00% | 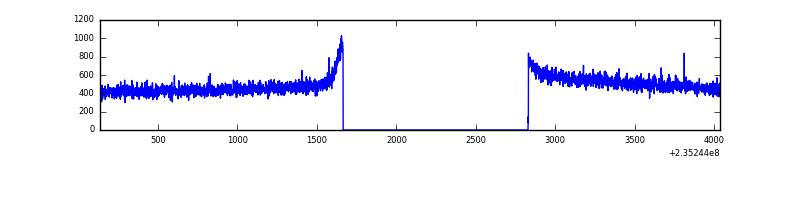 |
| D | 3901 | 2737 | 16 | 16 | 0.41% | 0.58% | 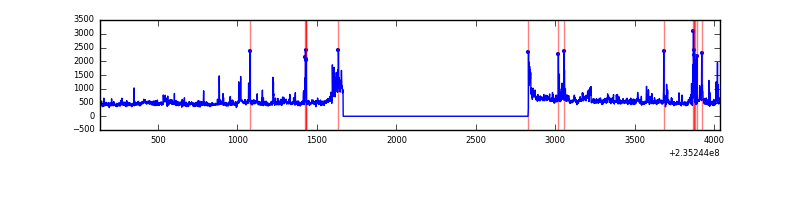 |
Top three noisy pixels from each quadrant. If the there are fewer than three noisy pixels in the level2.evt file, extra rows are filled as -1
| Pixel properties | Quadrant properties | ||||||
|---|---|---|---|---|---|---|---|
| Quadrant | DetID | PixID | Counts | Sigma | Mean | Median | Sigma |
| A | 8 | 5 | 788499 | 11270.4 | 343 | 336 | 69.9 |
| A | 1 | 162 | 16082 | 225.16 | 343 | 336 | 69.9 |
| A | 13 | 251 | 14024 | 195.73 | 343 | 336 | 69.9 |
| B | 0 | 230 | 35583 | 519.03 | 349 | 340 | 67.9 |
| B | 4 | 173 | 15880 | 228.86 | 349 | 340 | 67.9 |
| B | 12 | 111 | 7038 | 98.64 | 349 | 340 | 67.9 |
| C | 13 | 61 | 2546 | 27.46 | 340 | 341 | 80.3 |
| C | 8 | 222 | 1998 | 20.64 | 340 | 341 | 80.3 |
| C | 14 | 67 | 1489 | 14.3 | 340 | 341 | 80.3 |
| D | 12 | 233 | 104984 | 1226.08 | 337 | 328 | 85.4 |
| D | 1 | 52 | 88879 | 1037.4 | 337 | 328 | 85.4 |
| D | 2 | 152 | 52293 | 608.79 | 337 | 328 | 85.4 |
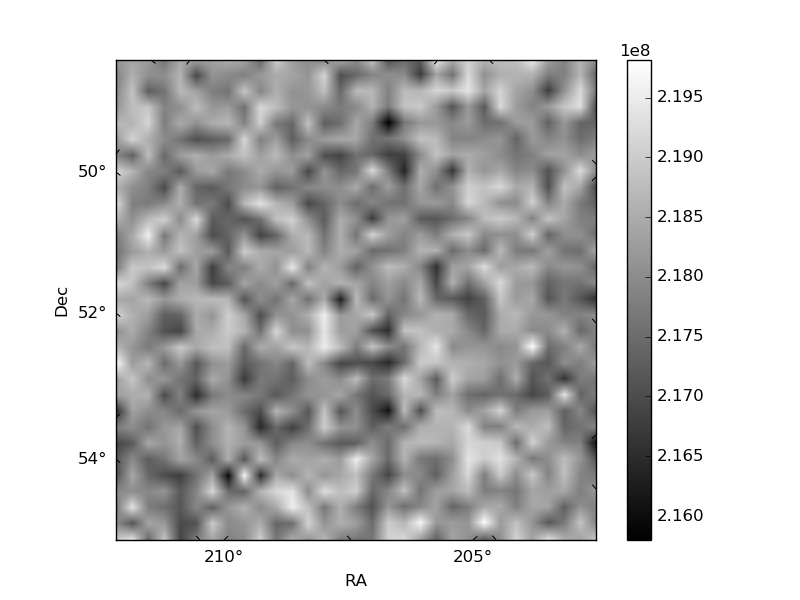
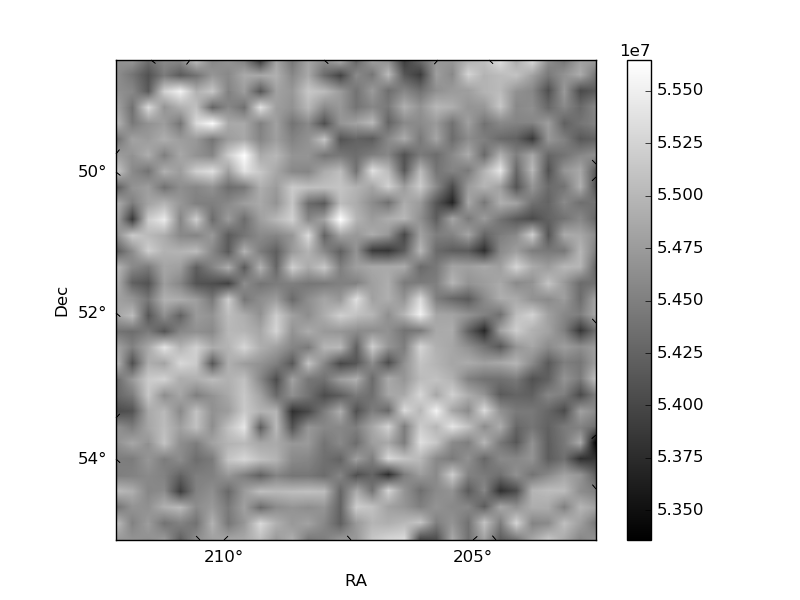
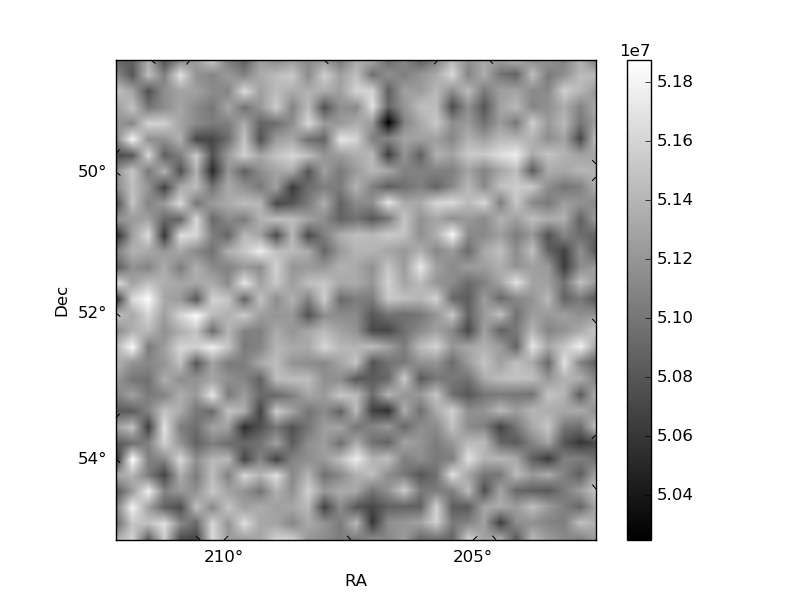
Histogram calculated using DETX and DETY for each event in the final _common_clean file
| Quadrant A | 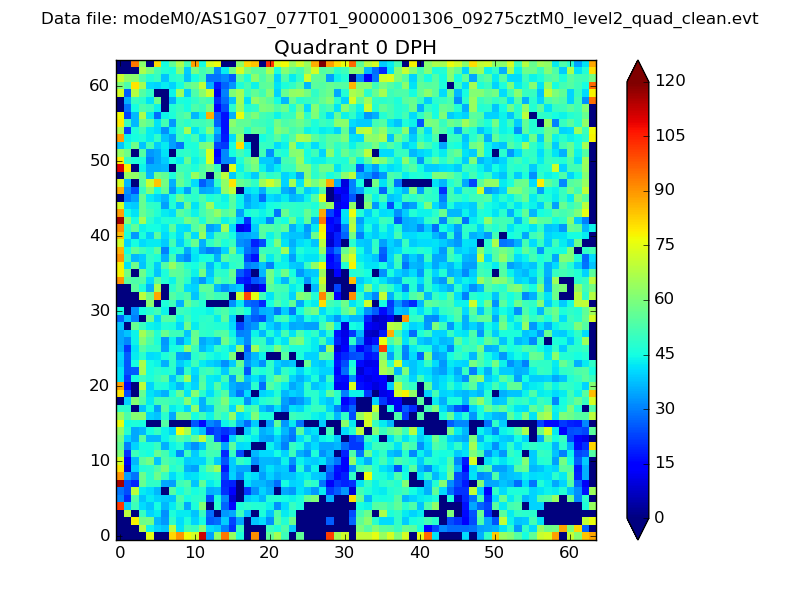 |
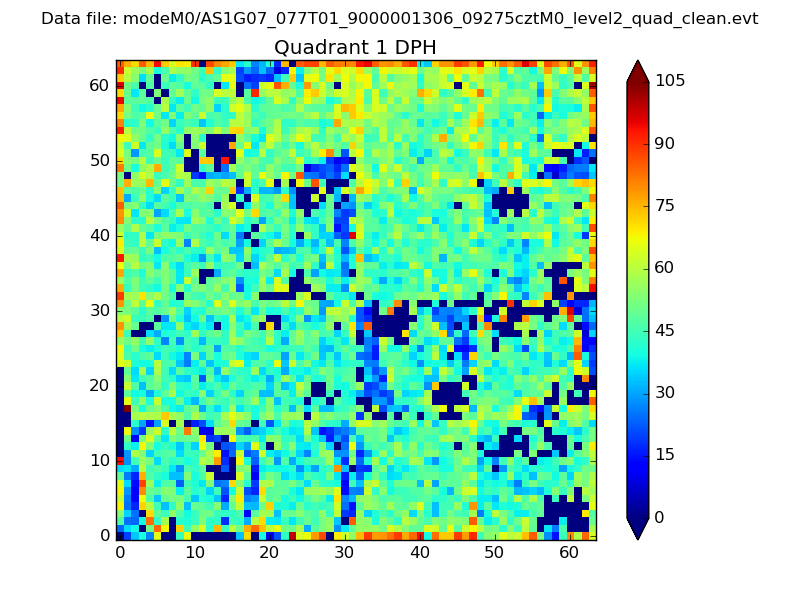 |
Quadrant B |
|---|---|---|---|
| Quadrant D |  |
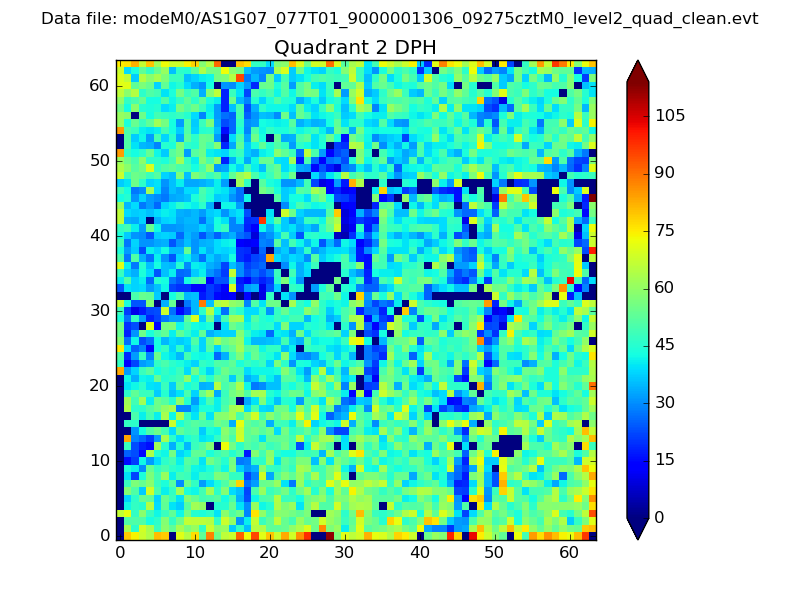 |
Quadrant C |
| Plot type | Count rate plots | Images |
|---|---|---|
| Comparison with Poisson distribution Blue bars denote a histogram of data divided into 1 sec bins. Red curve is a Poisson curve with rate = median count rate of data. |
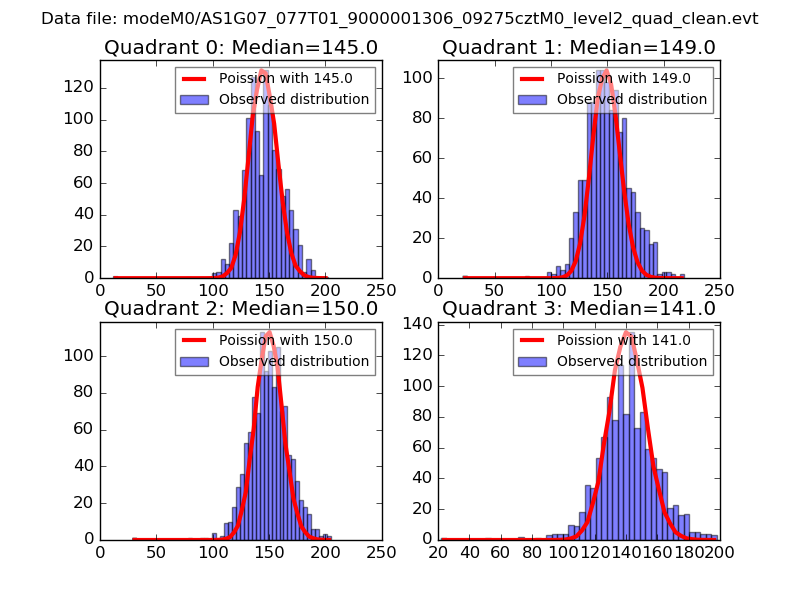 |
 |
| Quadrant-wise count rates Data is divided into 100 sec bins |
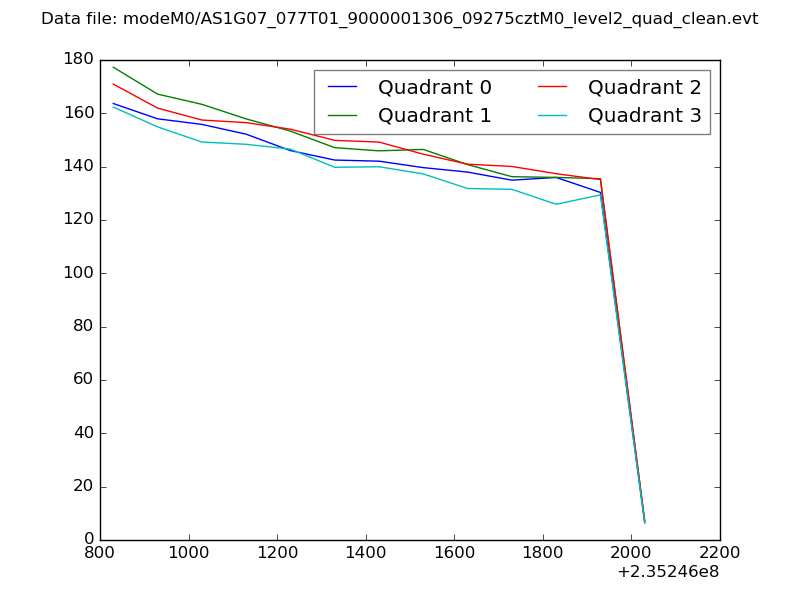 |
|
| Module-wise count rates for Quadrant A Data is divided into 100 sec bins |
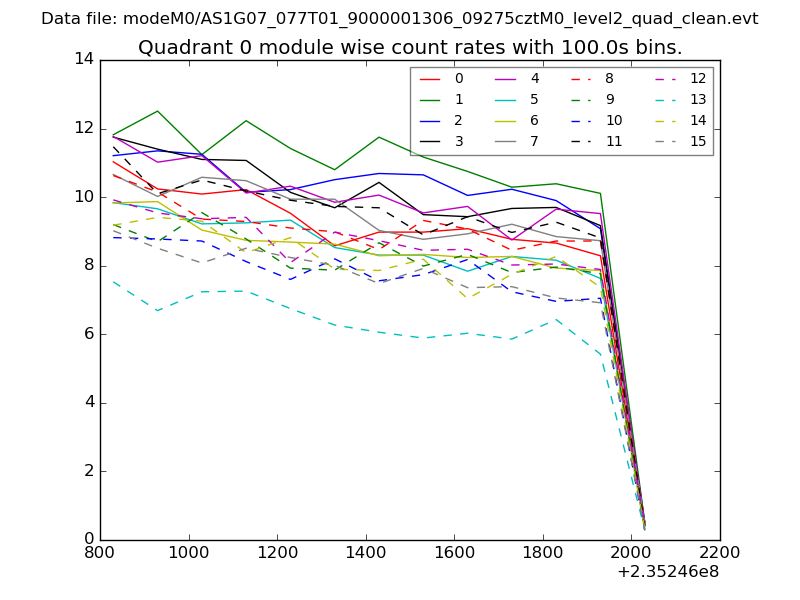 |
 |
| Module-wise count rates for Quadrant B Data is divided into 100 sec bins |
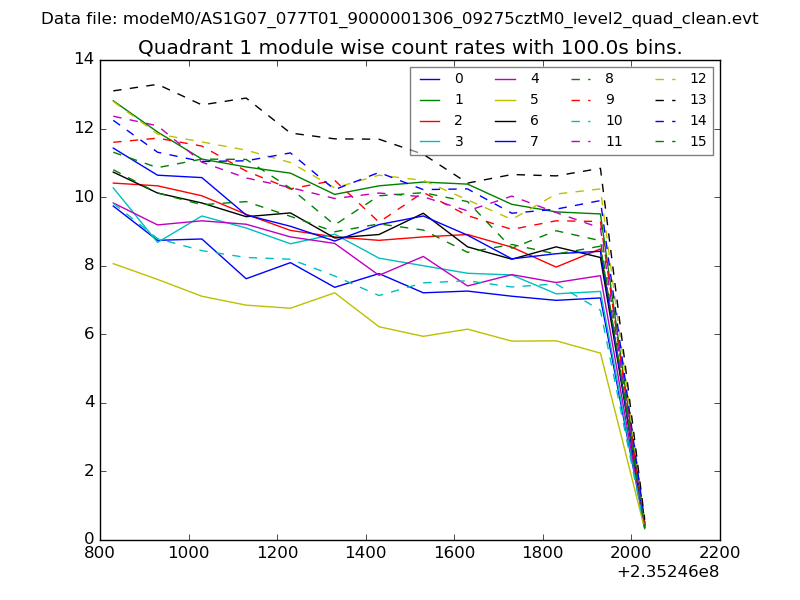 |
 |
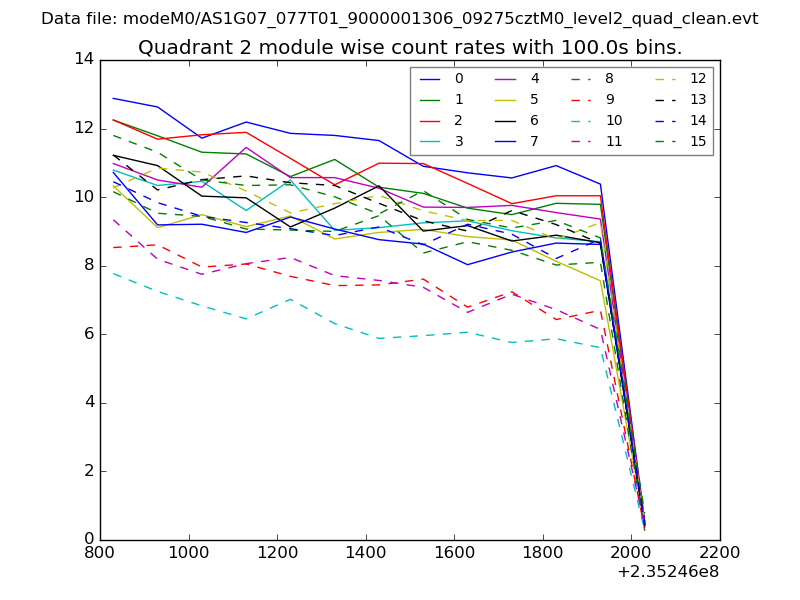
| Module-wise count rates for Quadrant C Data is divided into 100 sec bins |
 |
 |
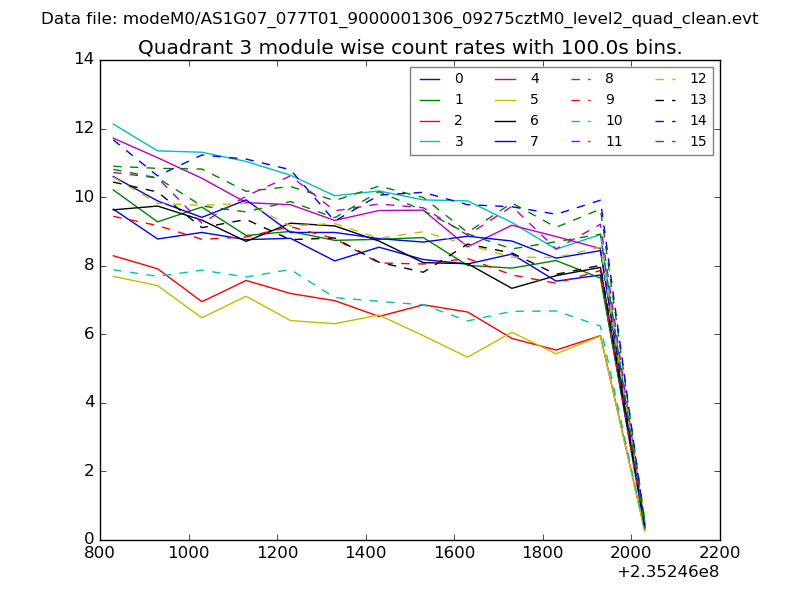
| Module-wise count rates for Quadrant D Data is divided into 100 sec bins |
 |
 |
| Parameter | Plot |
|---|---|
| CZT HV Monitor | 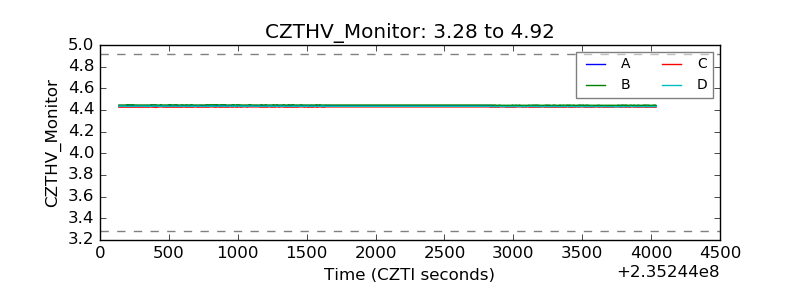 |
| D_VDD | 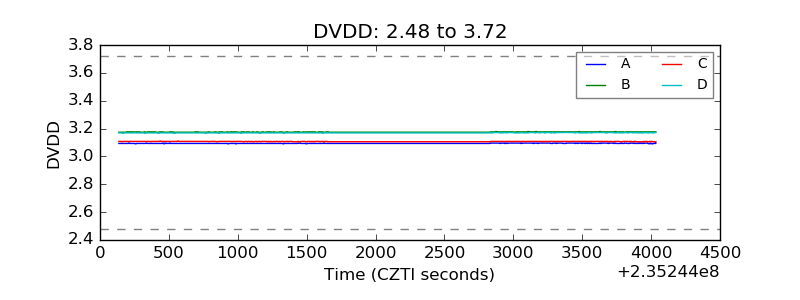 |
| Temperature 1 | 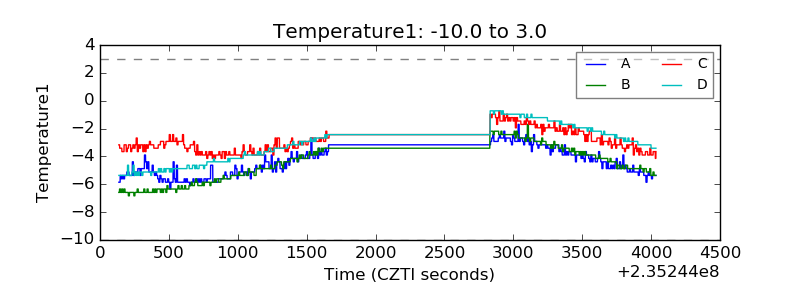 |
| Veto HV Monitor | 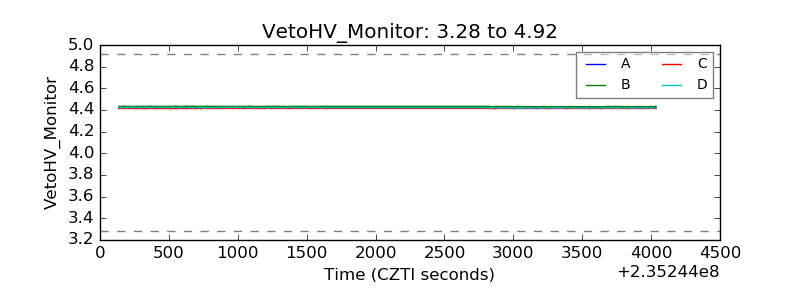 |
| Veto LLD | 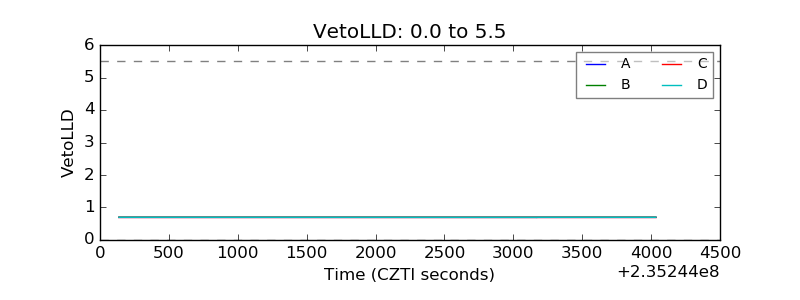 |
| Alpha Counter | 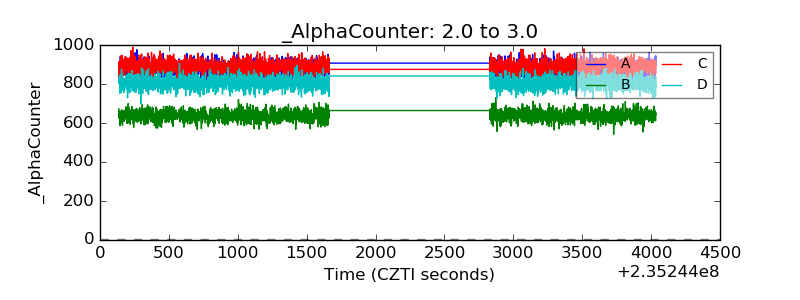 |
| _CPM_Rate | 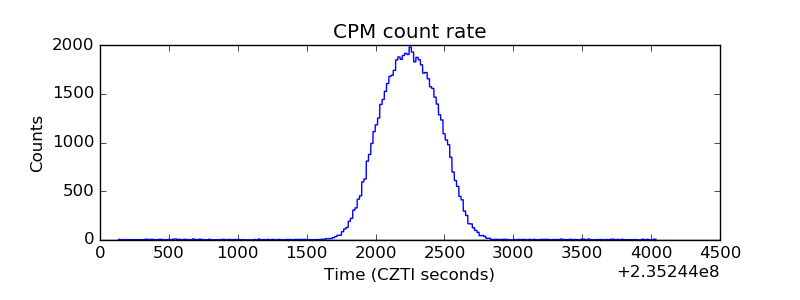 |
| CZT Counter | 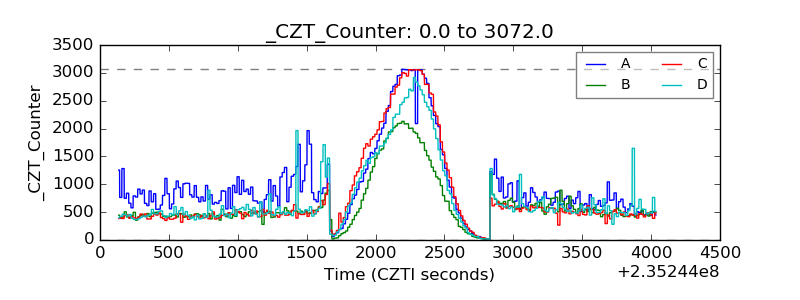 |
| +2.5 Volts monitor | 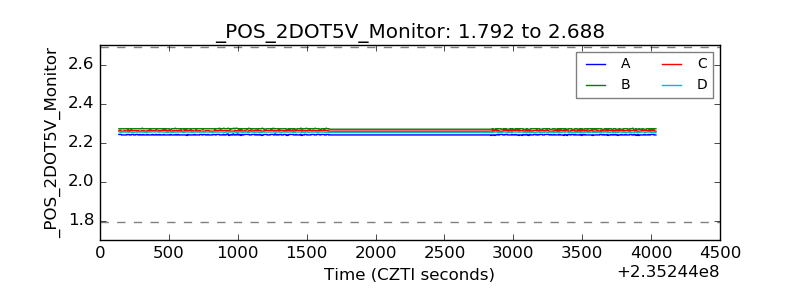 |
| +5 Volts monitor | 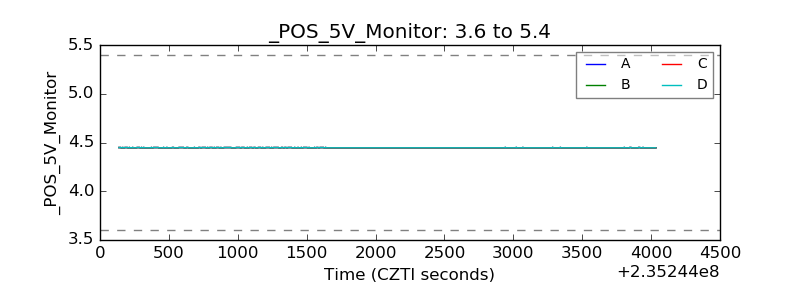 |
| _ROLL_ROT | 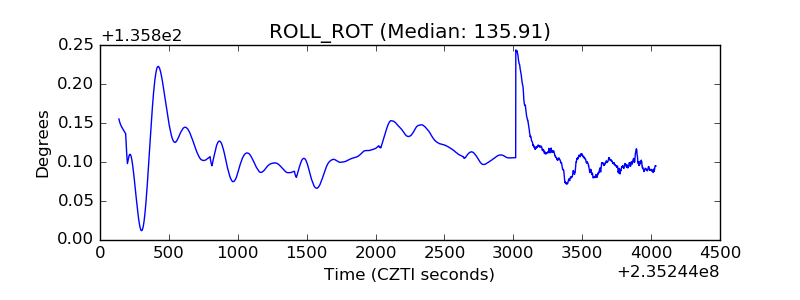 |
| _Roll_DEC | 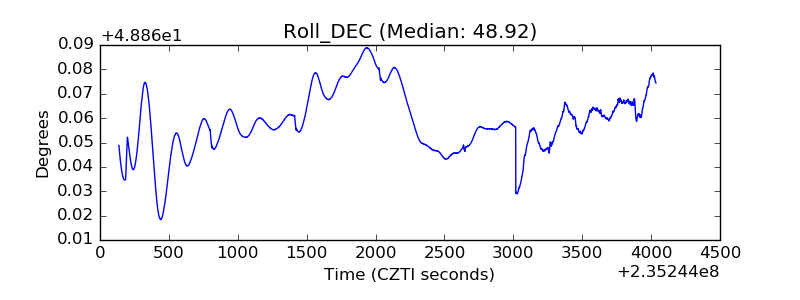 |
| _Roll_RA | 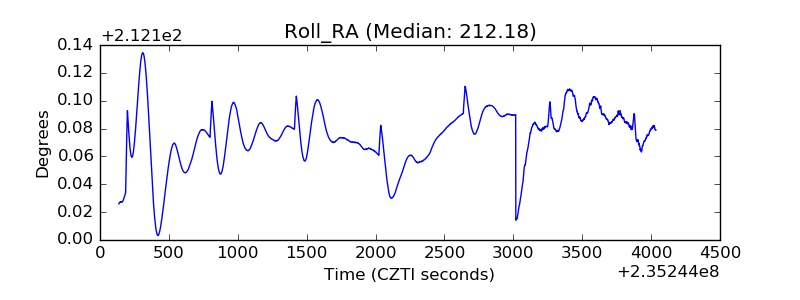 |
| Veto Counter | 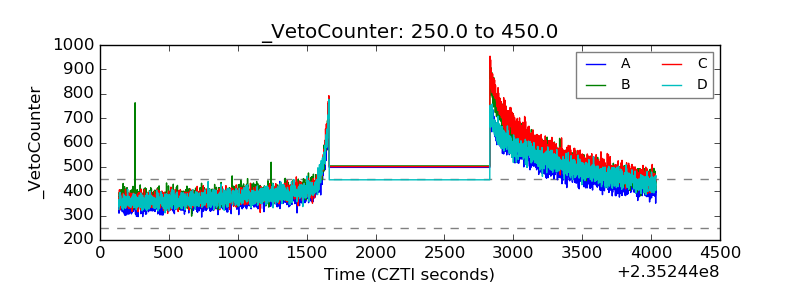 |