| Param | Original file | Final file |
|---|---|---|
| Filename | modeM0/AS1G07_077T01_9000001306_09276cztM0_level2.evt | modeM0/AS1G07_077T01_9000001306_09276cztM0_level2_quad_clean.evt |
| Size (bytes) | 461,327,040 | 92,099,520 |
| Size | 440.0 MB | 87.8 MB |
| Events in quadrant A | 3,990,121 | 582,286 |
| Events in quadrant B | 3,064,457 | 605,476 |
| Events in quadrant C | 2,888,252 | 605,936 |
| Events in quadrant D | 3,610,328 | 565,437 |
| Mode M0 | |||
|---|---|---|---|
| Quadrant | BADHDUFLAG | Total packets | Discarded packets |
| A | 0 | 16044 | 3 |
| B | 0 | 13266 | 2 |
| C | 0 | 12763 | 2 |
| D | 0 | 15009 | 2 |
| Mode SS | |||
|---|---|---|---|
| Quadrant | BADHDUFLAG | Total packets | Discarded packets |
| A | 0 | 126 | 0 |
| B | 0 | 126 | 0 |
| C | 0 | 126 | 0 |
| D | 0 | 126 | 0 |
| Mode M9 | |||
|---|---|---|---|
| Quadrant | BADHDUFLAG | Total packets | Discarded packets |
| A | 0 | 20 | 0 |
| B | 0 | 20 | 0 |
| C | 0 | 20 | 0 |
| D | 0 | 21 | 0 |
| Quadrant | Total seconds | Saturated seconds | Saturation percentage |
|---|---|---|---|
| A | 6155 | 75 | 1.218522% |
| B | 6155 | 27 | 0.438668% |
| C | 6155 | 26 | 0.422421% |
| D | 6155 | 172 | 2.794476% |
Noise dominated data is calculated using 1-second bins in cleaned event files. If a bin has >2000 counts, and if more than 50% of those come from <1% of pixels, then it is considered to be noise-dominated and hence unusable.
| Quadrant | # 1 sec bins | Bins with >0 counts | Bins with >2000 counts | High rate bins dominated by noise | Noise dominated (total time) | Noise dominated (detector-on time) | Marked lightcurve |
|---|---|---|---|---|---|---|---|
| A | 7415 | 6156 | 46 | 46 | 0.62% | 0.75% | 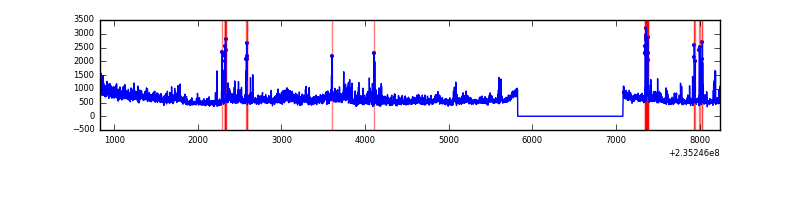 |
| B | 7415 | 6156 | 1 | 1 | 0.01% | 0.02% | 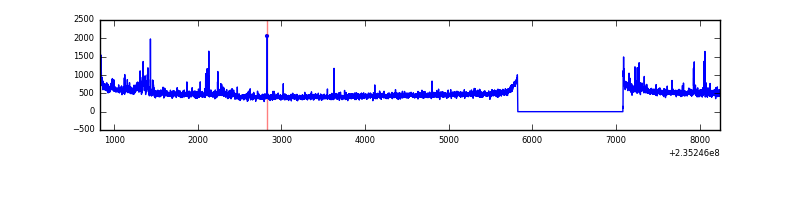 |
| C | 7415 | 6156 | 0 | 0 | 0.00% | 0.00% | 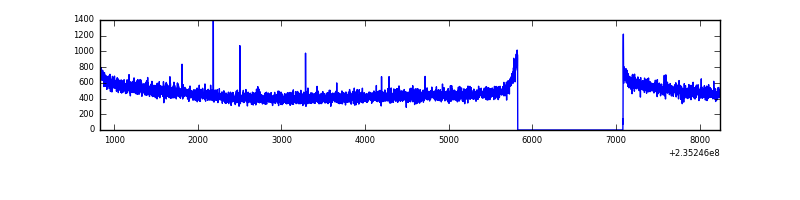 |
| D | 7415 | 6156 | 113 | 113 | 1.52% | 1.84% | 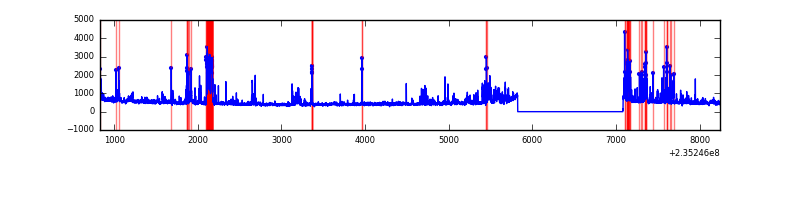 |
Top three noisy pixels from each quadrant. If the there are fewer than three noisy pixels in the level2.evt file, extra rows are filled as -1
| Pixel properties | Quadrant properties | ||||||
|---|---|---|---|---|---|---|---|
| Quadrant | DetID | PixID | Counts | Sigma | Mean | Median | Sigma |
| A | 8 | 5 | 925929 | 6243.42 | 736 | 720 | 148.2 |
| A | 5 | 16 | 65083 | 434.33 | 736 | 720 | 148.2 |
| A | 4 | 2 | 59528 | 396.84 | 736 | 720 | 148.2 |
| B | 0 | 230 | 41751 | 291.05 | 749 | 730 | 140.9 |
| B | 0 | 214 | 32894 | 228.21 | 749 | 730 | 140.9 |
| B | 4 | 173 | 26976 | 186.22 | 749 | 730 | 140.9 |
| C | 14 | 67 | 6948 | 36.61 | 737 | 739 | 169.6 |
| C | 13 | 61 | 5507 | 28.11 | 737 | 739 | 169.6 |
| C | 8 | 222 | 3716 | 17.55 | 737 | 739 | 169.6 |
| D | 12 | 233 | 452803 | 2445.91 | 717 | 699 | 184.8 |
| D | 1 | 52 | 166681 | 897.97 | 717 | 699 | 184.8 |
| D | 2 | 136 | 89867 | 482.4 | 717 | 699 | 184.8 |
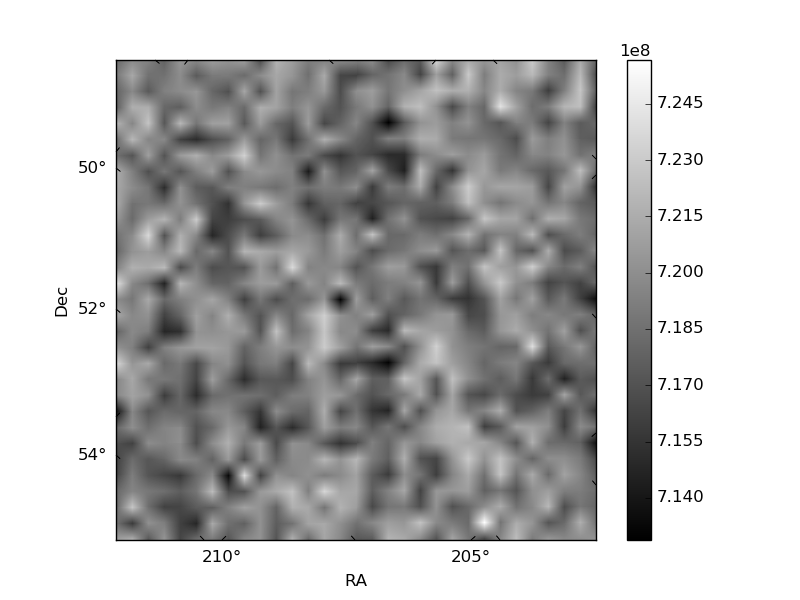
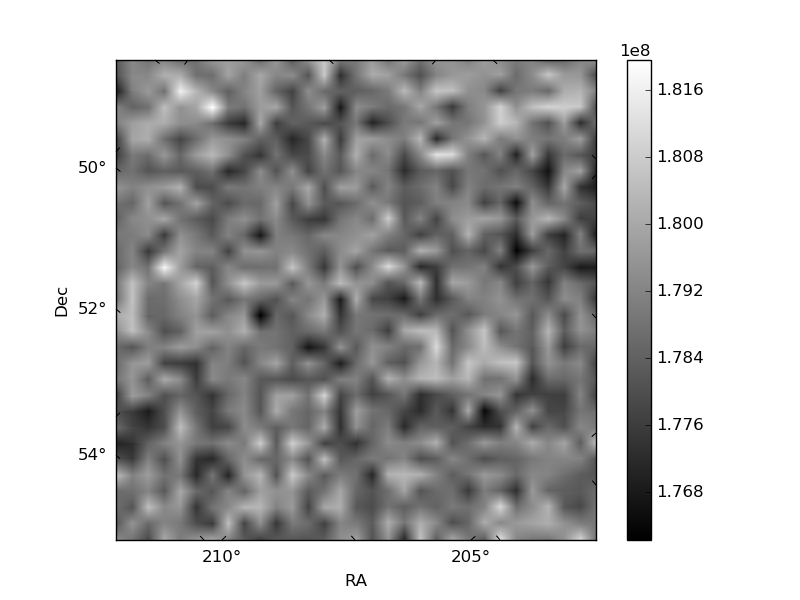
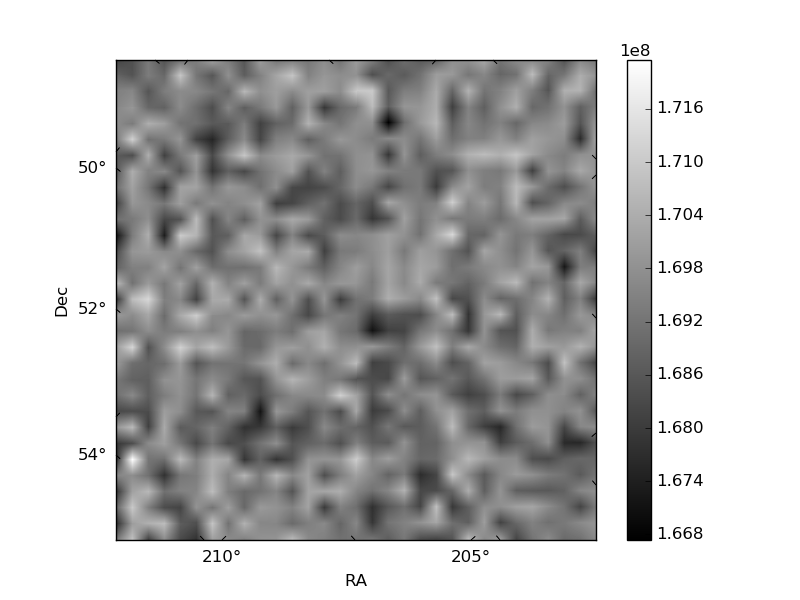
Histogram calculated using DETX and DETY for each event in the final _common_clean file
| Quadrant A | 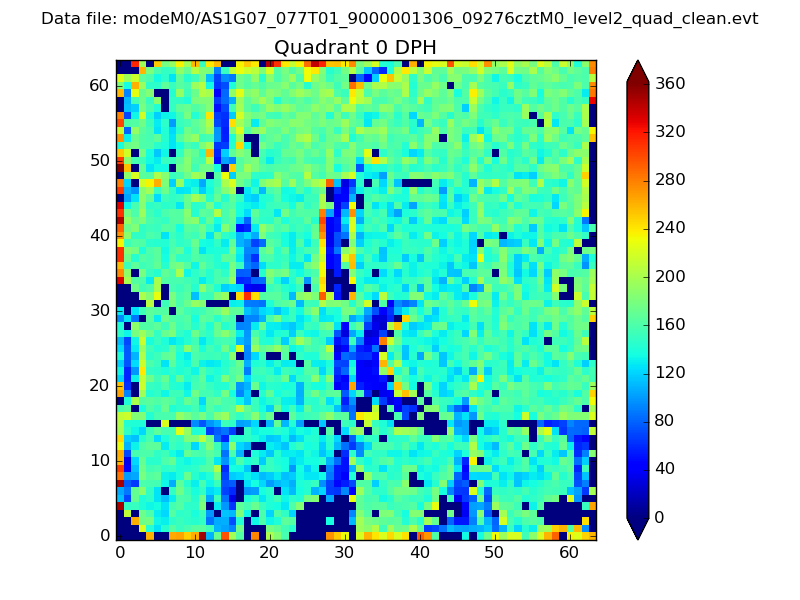 |
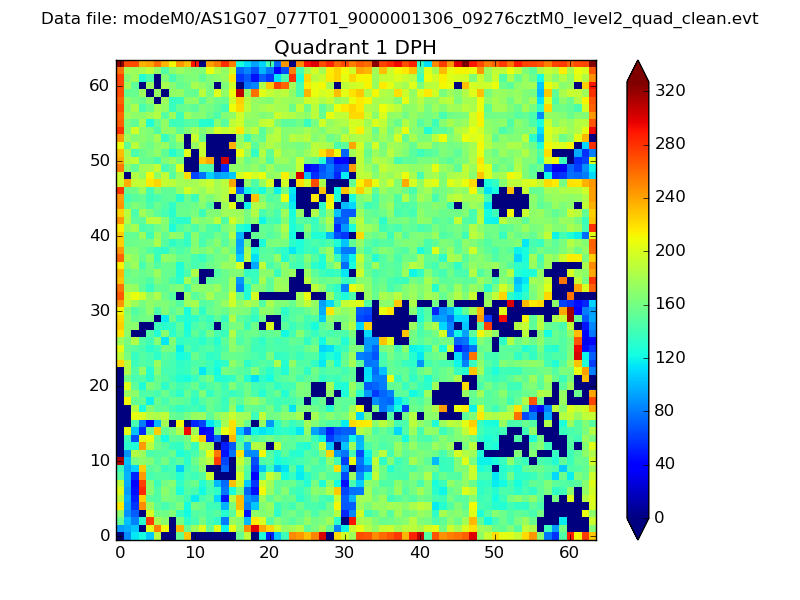 |
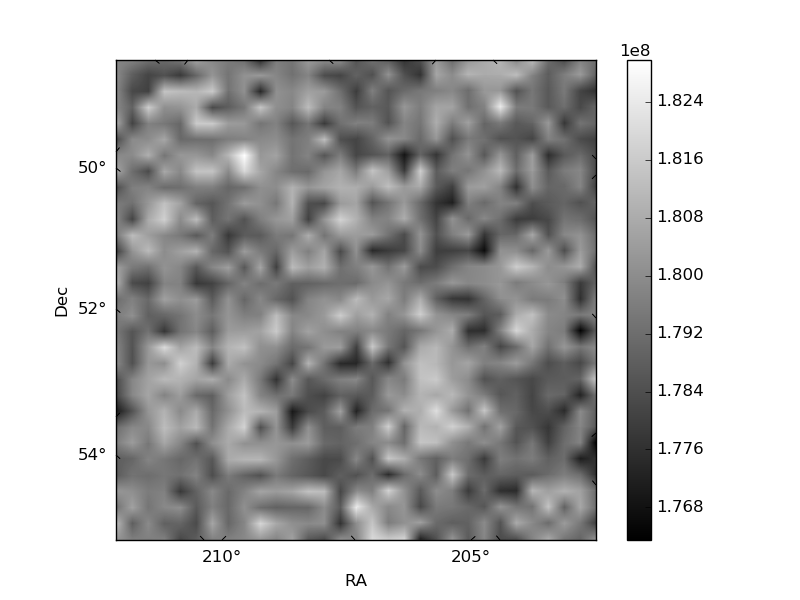
Quadrant B |
|---|---|---|---|
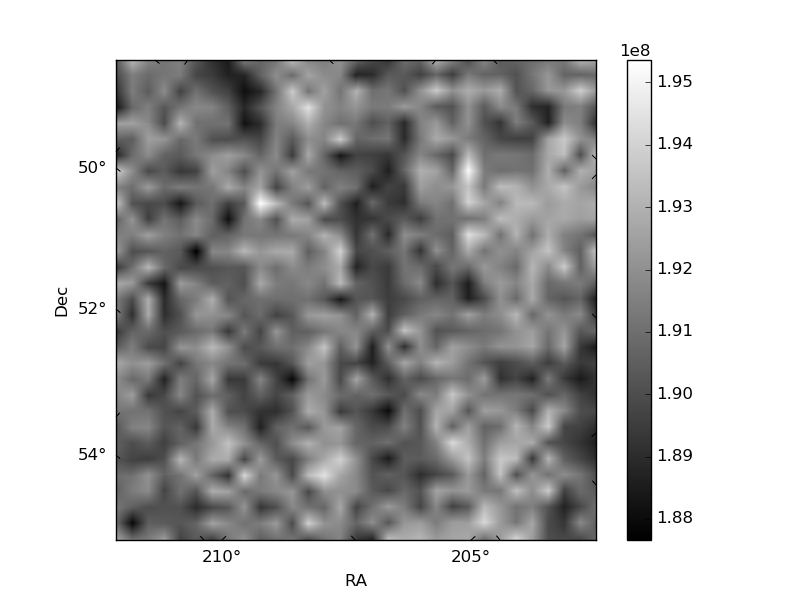
| Quadrant D | 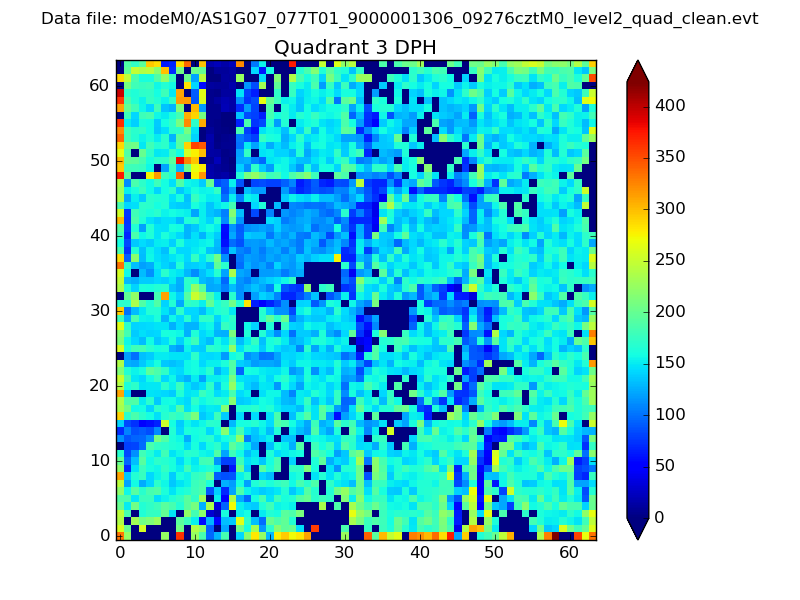 |
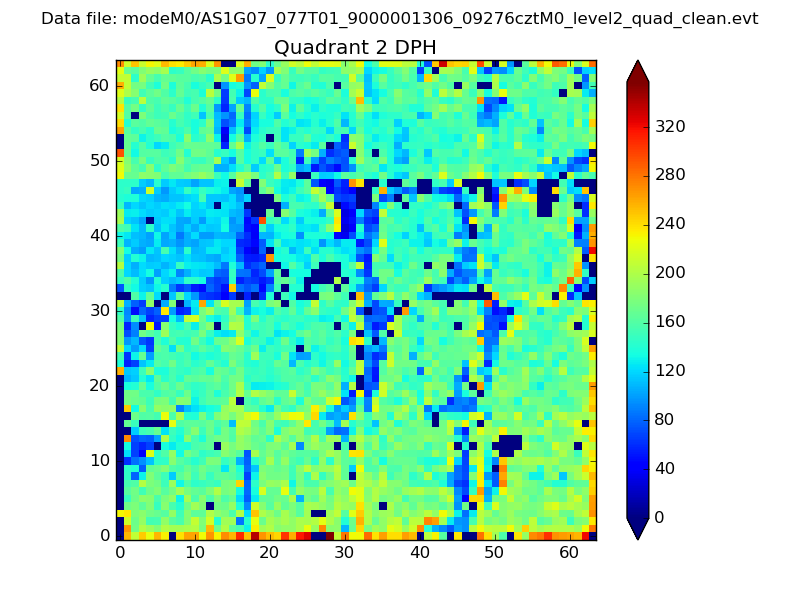 |
Quadrant C |
| Plot type | Count rate plots | Images |
|---|---|---|
| Comparison with Poisson distribution Blue bars denote a histogram of data divided into 1 sec bins. Red curve is a Poisson curve with rate = median count rate of data. |
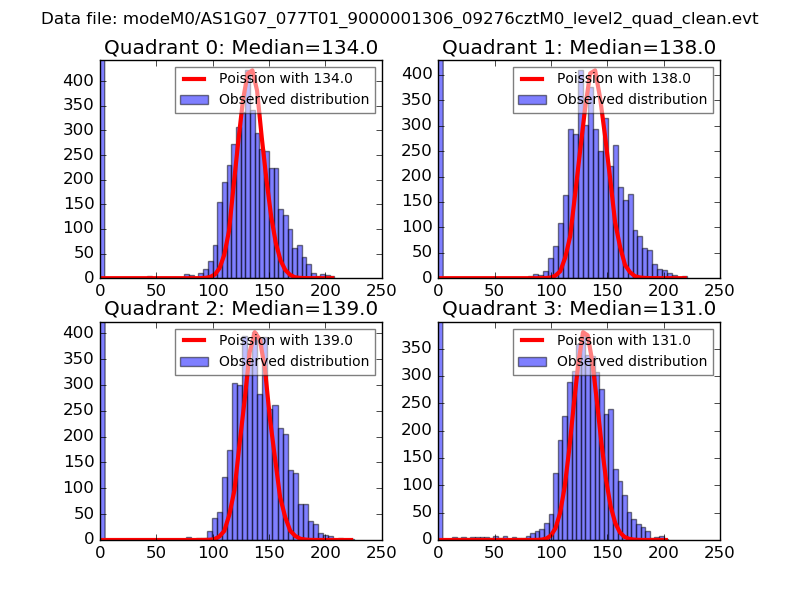 |
 |
| Quadrant-wise count rates Data is divided into 100 sec bins |
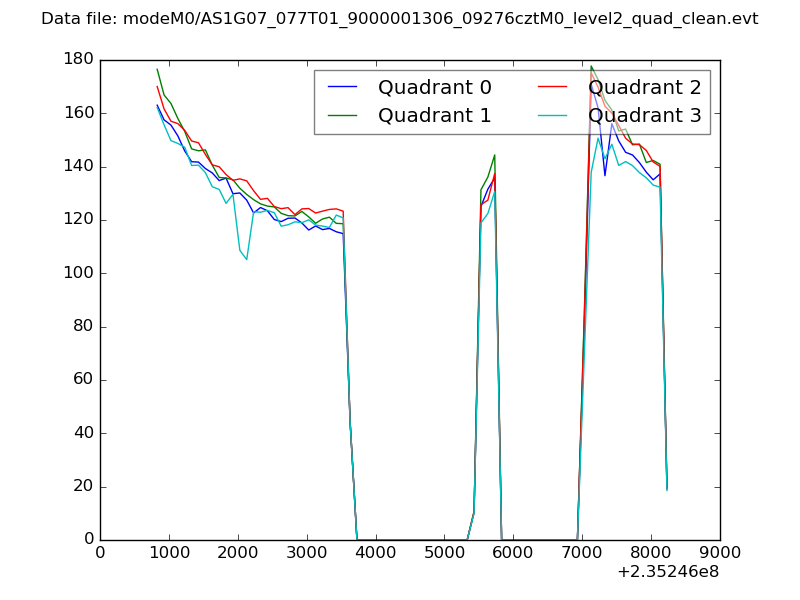 |
|
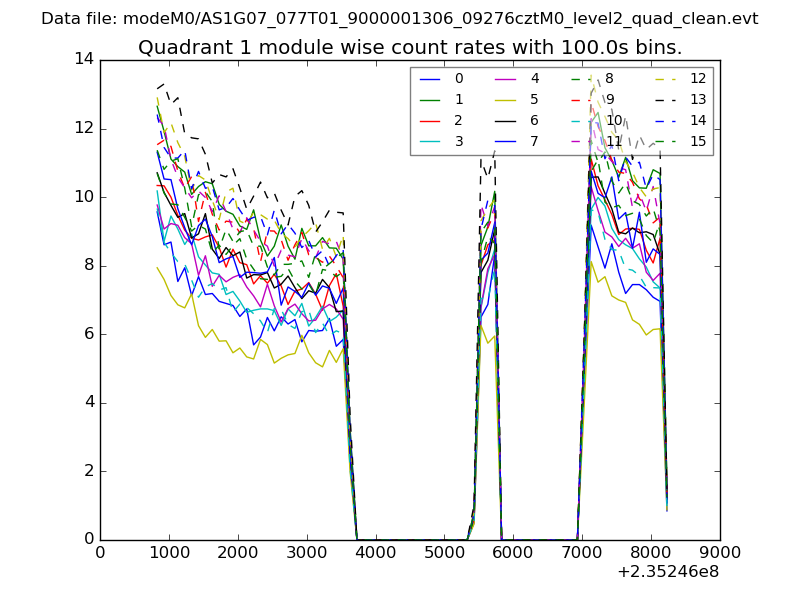
| Module-wise count rates for Quadrant A Data is divided into 100 sec bins |
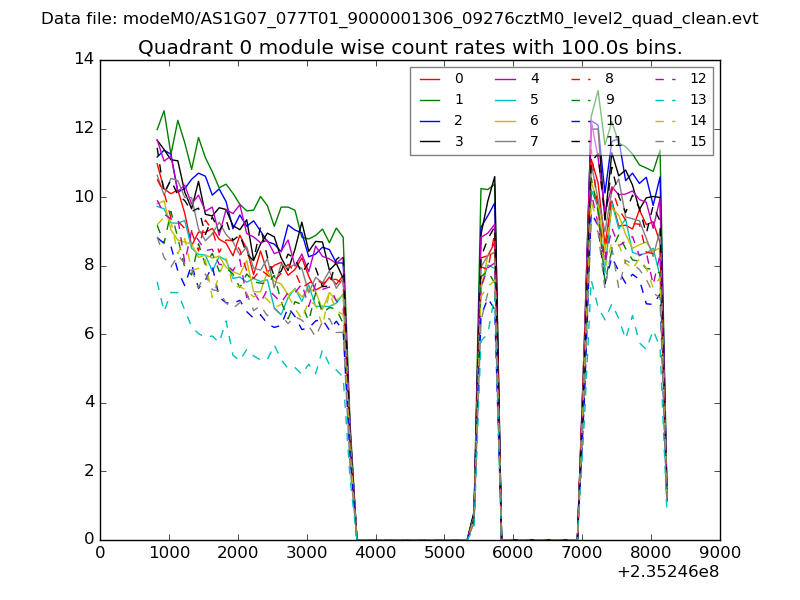 |
 |
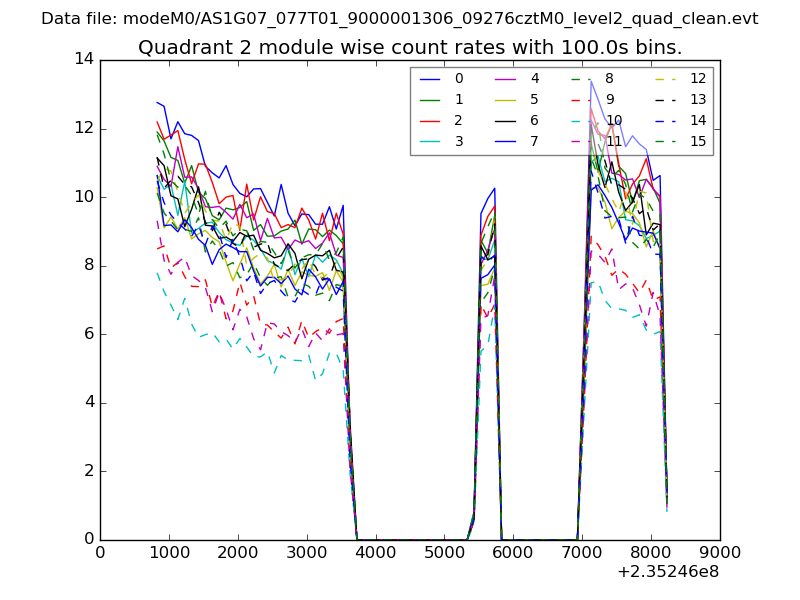
| Module-wise count rates for Quadrant B Data is divided into 100 sec bins |
 |
 |
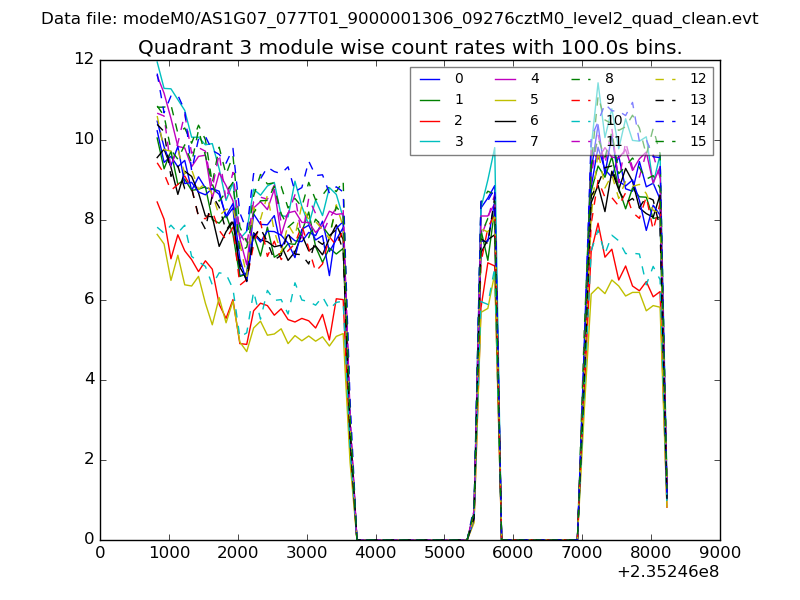
| Module-wise count rates for Quadrant C Data is divided into 100 sec bins |
 |
 |
| Module-wise count rates for Quadrant D Data is divided into 100 sec bins |
 |
 |
| Parameter | Plot |
|---|---|
| CZT HV Monitor | 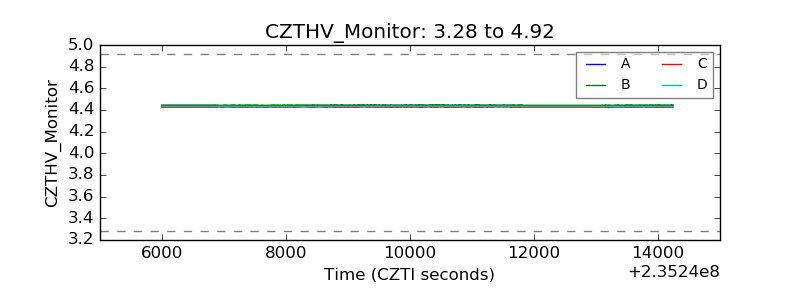 |
| D_VDD | 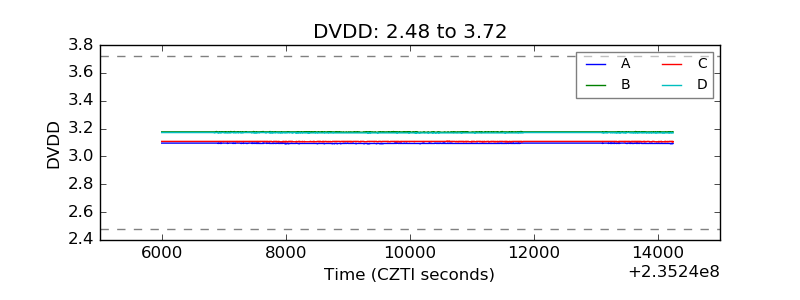 |
| Temperature 1 | 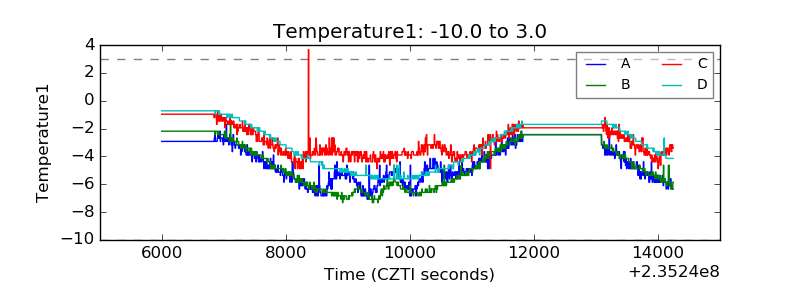 |
| Veto HV Monitor | 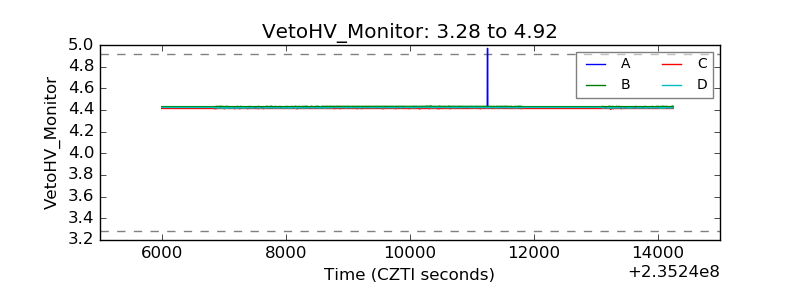 |
| Veto LLD | 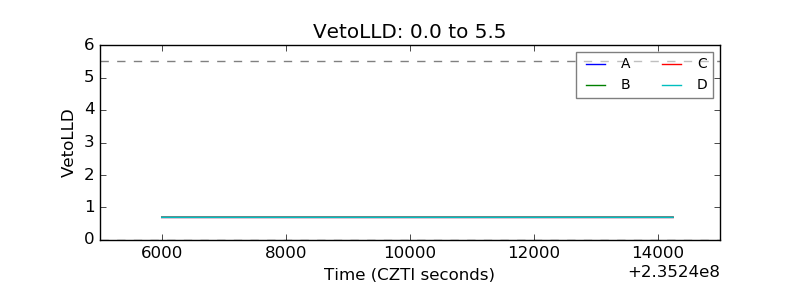 |
| Alpha Counter | 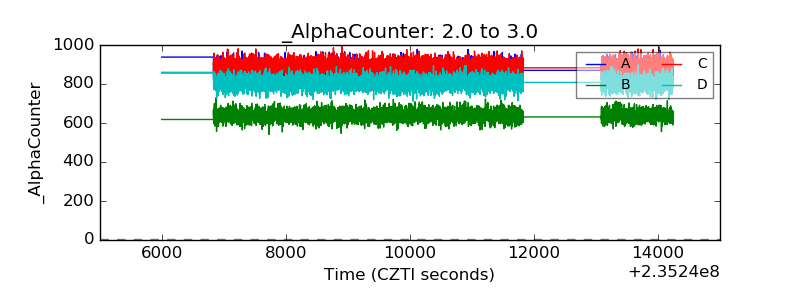 |
| _CPM_Rate | 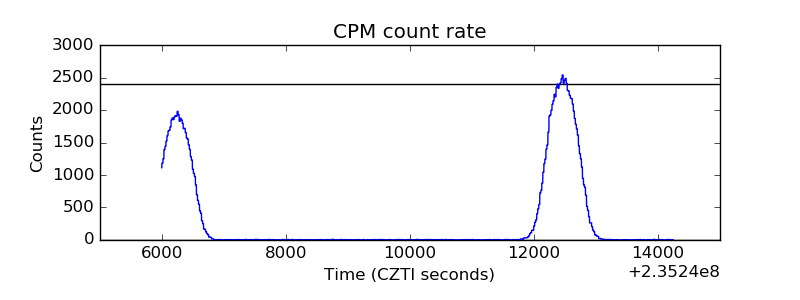 |
| CZT Counter | 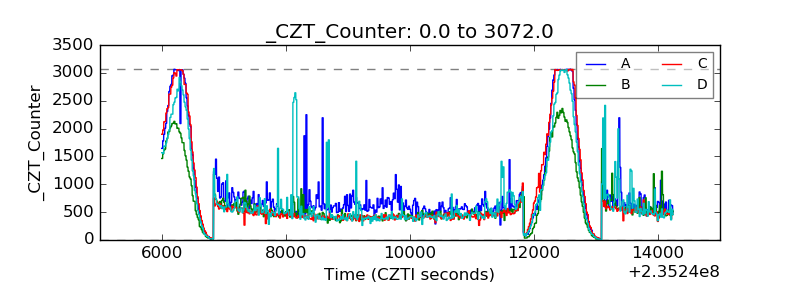 |
| +2.5 Volts monitor |  |
| +5 Volts monitor |  |
| _ROLL_ROT | 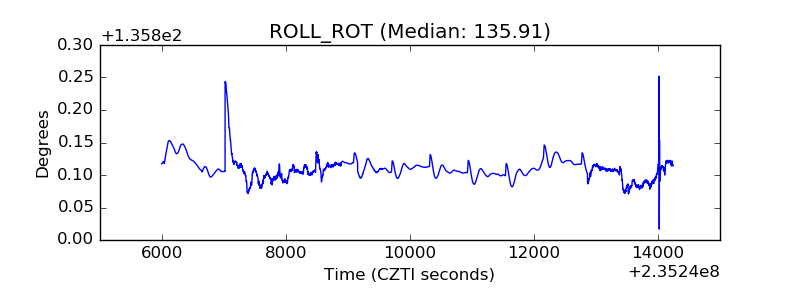 |
| _Roll_DEC |  |
| _Roll_RA | 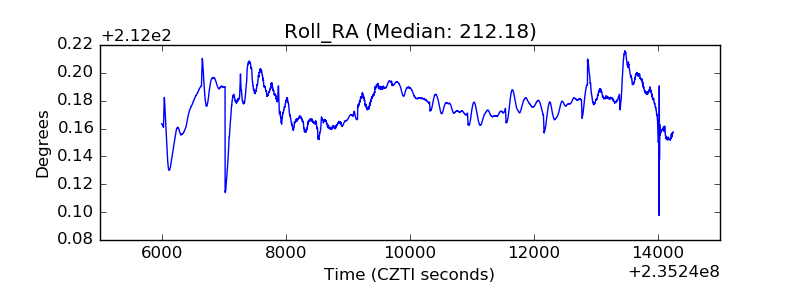 |
| Veto Counter | 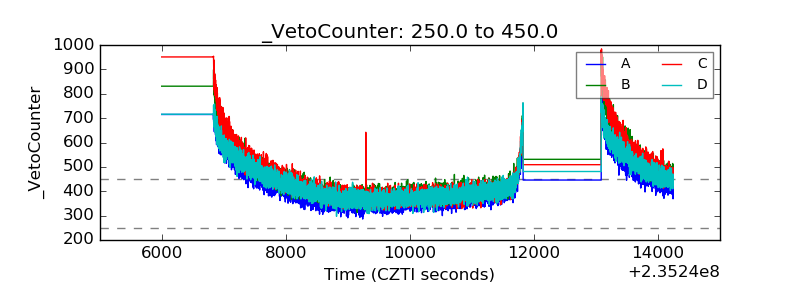 |