| Param | Original file | Final file |
|---|---|---|
| Filename | modeM0/AS1G07_077T01_9000001306_09277cztM0_level2.evt | modeM0/AS1G07_077T01_9000001306_09277cztM0_level2_quad_clean.evt |
| Size (bytes) | 462,047,040 | 93,444,480 |
| Size | 440.6 MB | 89.1 MB |
| Events in quadrant A | 4,336,569 | 588,727 |
| Events in quadrant B | 3,090,420 | 619,573 |
| Events in quadrant C | 2,898,294 | 616,041 |
| Events in quadrant D | 3,250,865 | 576,990 |
| Mode M0 | |||
|---|---|---|---|
| Quadrant | BADHDUFLAG | Total packets | Discarded packets |
| A | 0 | 17263 | 114 |
| B | 0 | 13242 | 50 |
| C | 0 | 12735 | 63 |
| D | 0 | 14053 | 63 |
| Mode SS | |||
|---|---|---|---|
| Quadrant | BADHDUFLAG | Total packets | Discarded packets |
| A | 0 | 126 | 2 |
| B | 0 | 126 | 2 |
| C | 0 | 126 | 0 |
| D | 0 | 126 | 2 |
| Mode M9 | |||
|---|---|---|---|
| Quadrant | BADHDUFLAG | Total packets | Discarded packets |
| A | 0 | 18 | 0 |
| B | 0 | 18 | 0 |
| C | 0 | 18 | 0 |
| D | 0 | 19 | 0 |
| Quadrant | Total seconds | Saturated seconds | Saturation percentage |
|---|---|---|---|
| A | 6130 | 117 | 1.908646% |
| B | 6147 | 46 | 0.748333% |
| C | 6139 | 16 | 0.260629% |
| D | 6146 | 132 | 2.147738% |
Noise dominated data is calculated using 1-second bins in cleaned event files. If a bin has >2000 counts, and if more than 50% of those come from <1% of pixels, then it is considered to be noise-dominated and hence unusable.
| Quadrant | # 1 sec bins | Bins with >0 counts | Bins with >2000 counts | High rate bins dominated by noise | Noise dominated (total time) | Noise dominated (detector-on time) | Marked lightcurve |
|---|---|---|---|---|---|---|---|
| A | 7499 | 6167 | 35 | 35 | 0.47% | 0.57% | 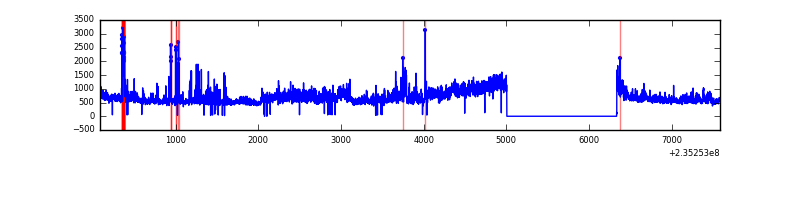 |
| B | 7499 | 6170 | 3 | 3 | 0.04% | 0.05% | 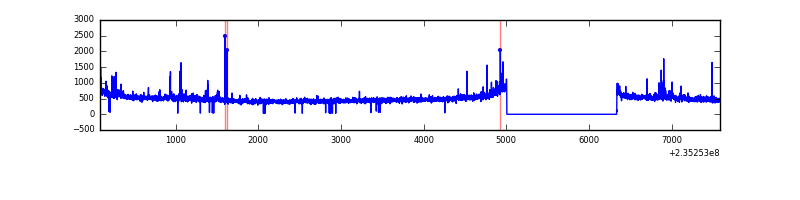 |
| C | 7499 | 6169 | 0 | 0 | 0.00% | 0.00% | 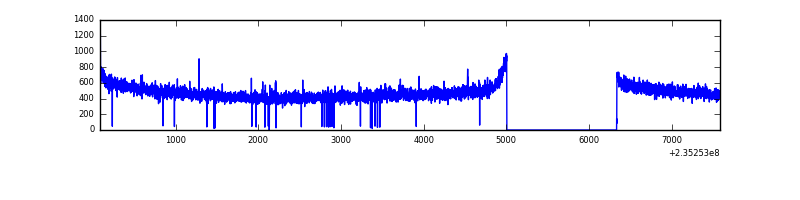 |
| D | 7499 | 6170 | 64 | 64 | 0.85% | 1.04% |  |
Top three noisy pixels from each quadrant. If the there are fewer than three noisy pixels in the level2.evt file, extra rows are filled as -1
| Pixel properties | Quadrant properties | ||||||
|---|---|---|---|---|---|---|---|
| Quadrant | DetID | PixID | Counts | Sigma | Mean | Median | Sigma |
| A | 8 | 5 | 1277301 | 8671.65 | 732 | 718 | 147.2 |
| A | 13 | 251 | 85003 | 572.54 | 732 | 718 | 147.2 |
| A | 5 | 16 | 60905 | 408.84 | 732 | 718 | 147.2 |
| B | 0 | 214 | 47463 | 331.11 | 754 | 735 | 141.1 |
| B | 0 | 187 | 22760 | 156.07 | 754 | 735 | 141.1 |
| B | 0 | 213 | 22088 | 151.3 | 754 | 735 | 141.1 |
| C | 14 | 67 | 9683 | 52.51 | 738 | 742 | 170.3 |
| C | 13 | 61 | 5585 | 28.44 | 738 | 742 | 170.3 |
| C | 10 | 22 | 3975 | 18.99 | 738 | 742 | 170.3 |
| D | 12 | 233 | 334618 | 1832.88 | 715 | 697 | 182.2 |
| D | 7 | 71 | 81305 | 442.45 | 715 | 697 | 182.2 |
| D | 2 | 152 | 45068 | 243.55 | 715 | 697 | 182.2 |
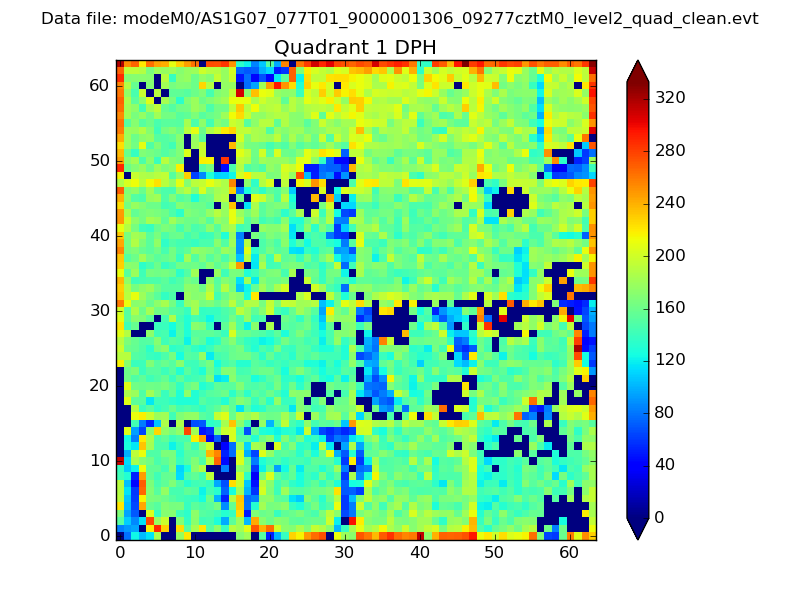
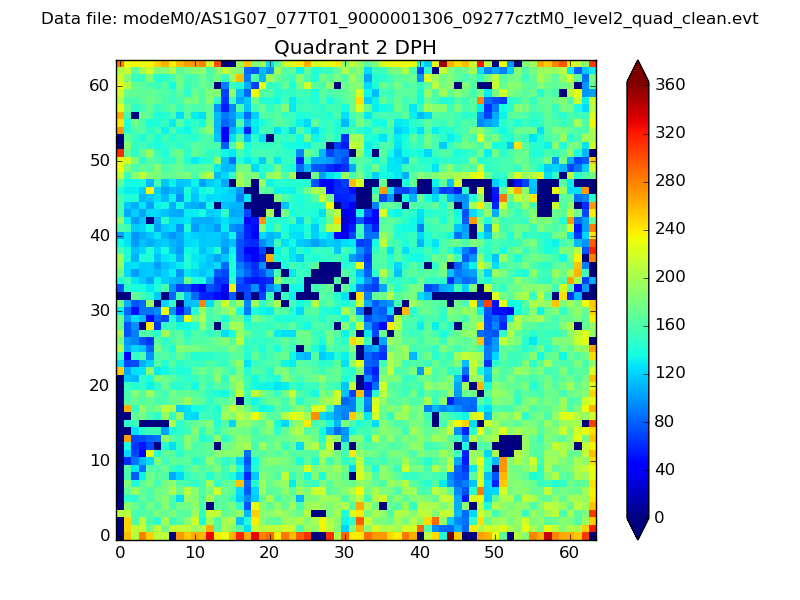
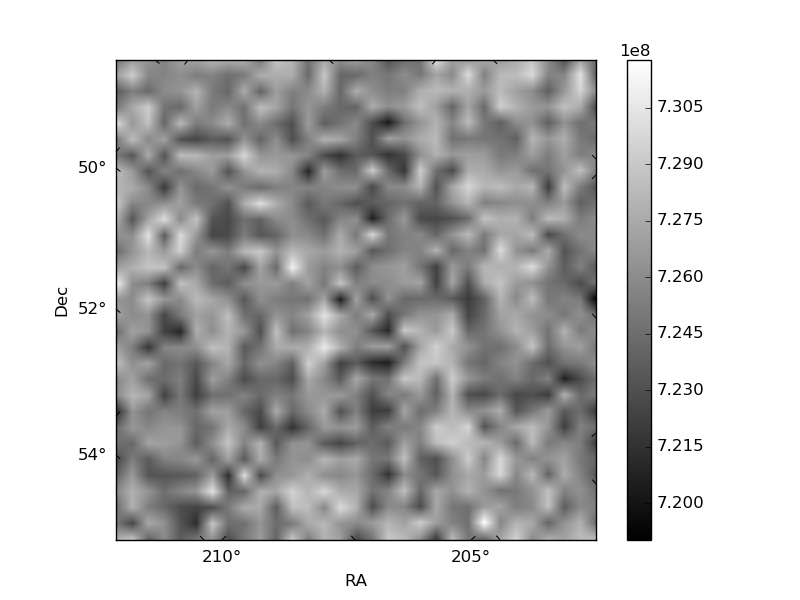
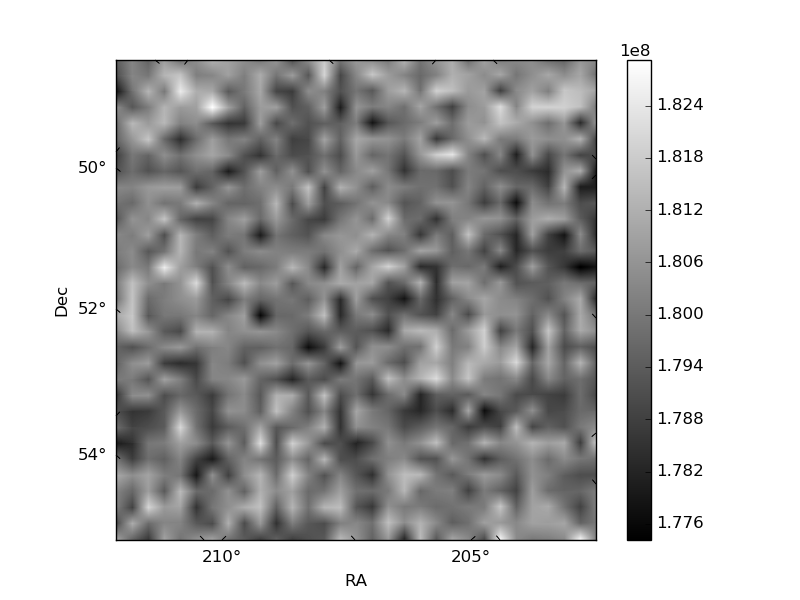
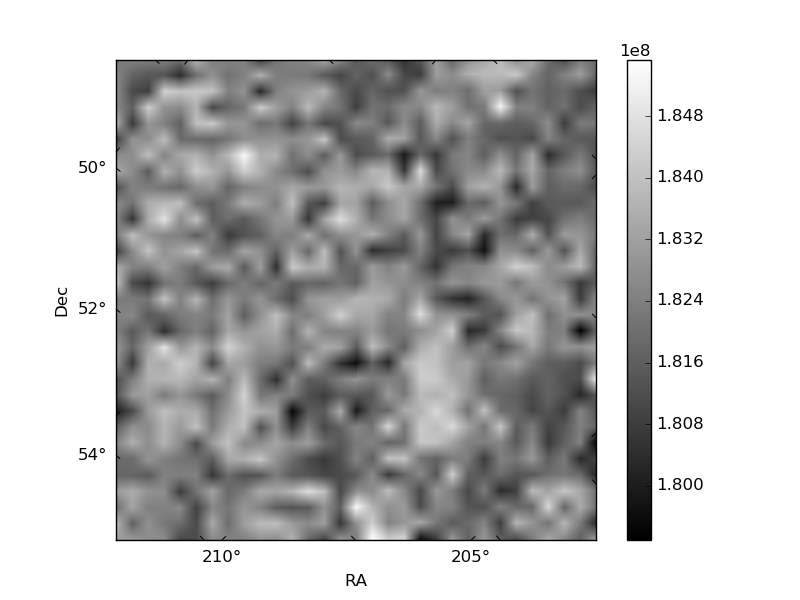
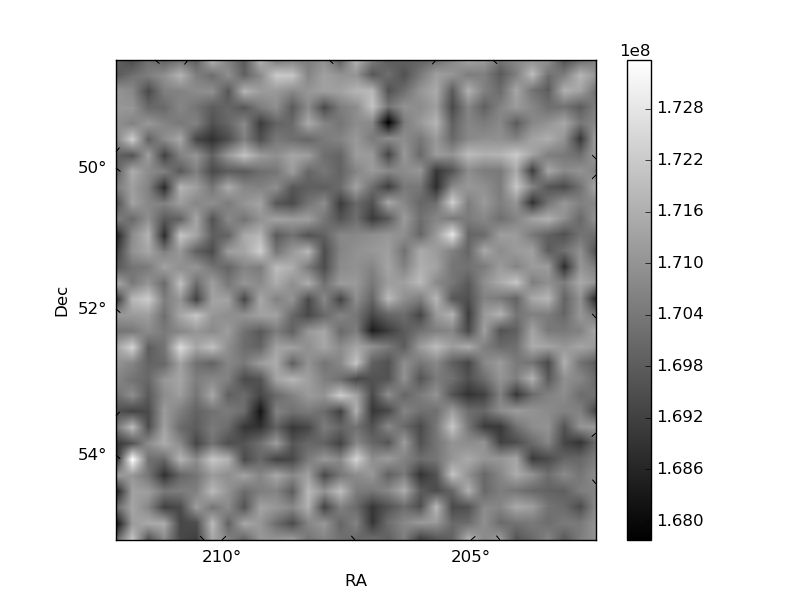
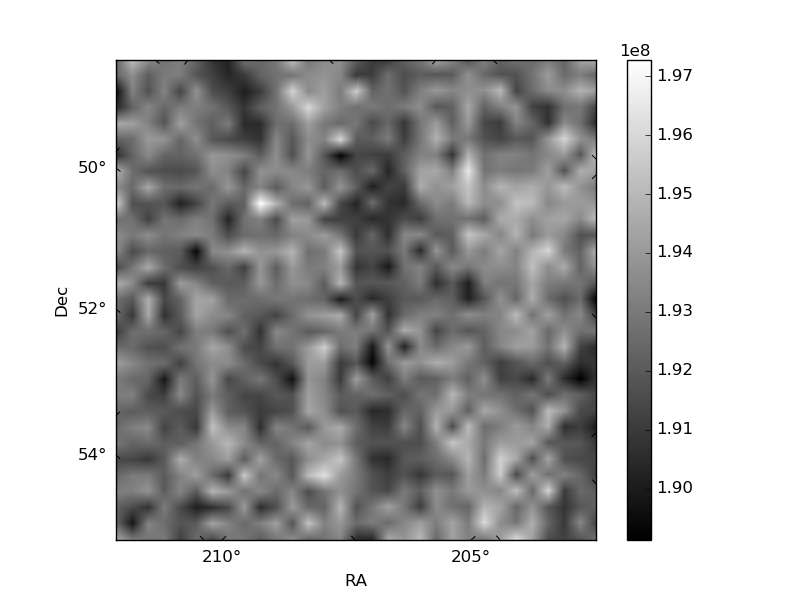
Histogram calculated using DETX and DETY for each event in the final _common_clean file
| Quadrant A | 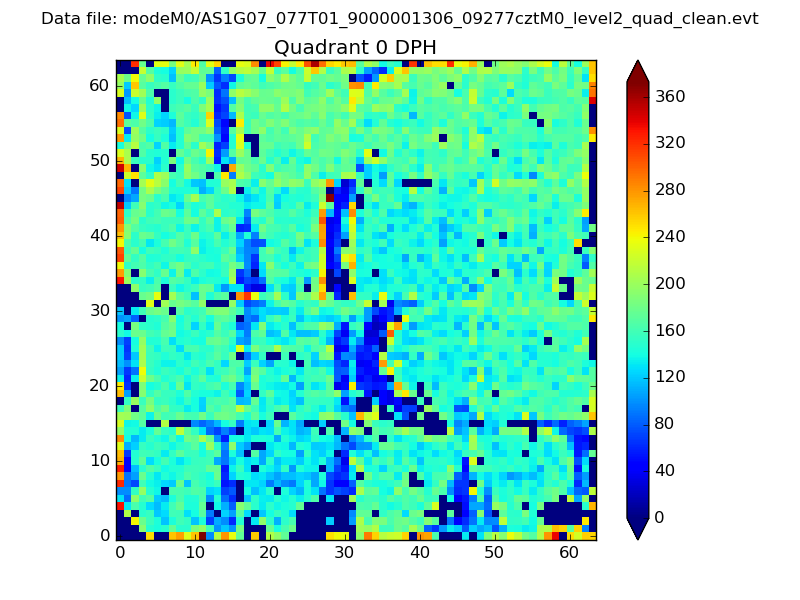 |
 |
Quadrant B |
|---|---|---|---|
| Quadrant D | 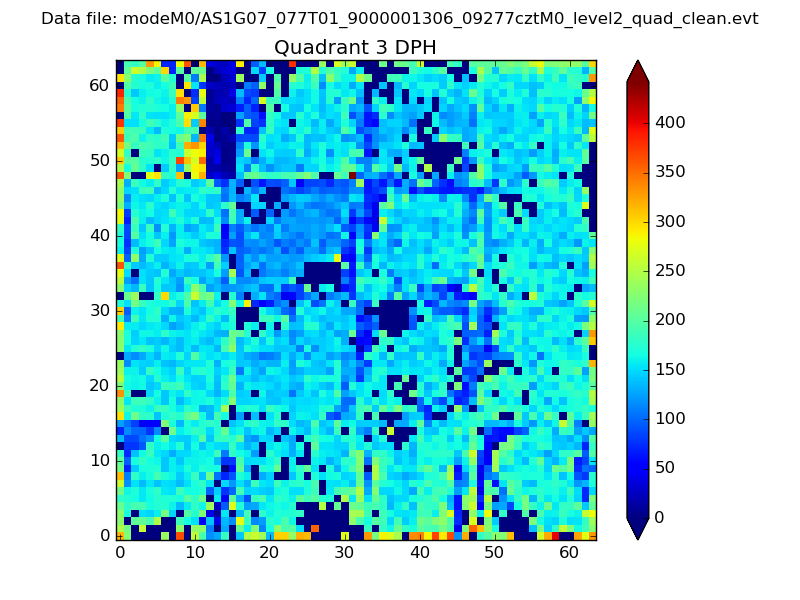 |
 |
Quadrant C |
| Plot type | Count rate plots | Images |
|---|---|---|
| Comparison with Poisson distribution Blue bars denote a histogram of data divided into 1 sec bins. Red curve is a Poisson curve with rate = median count rate of data. |
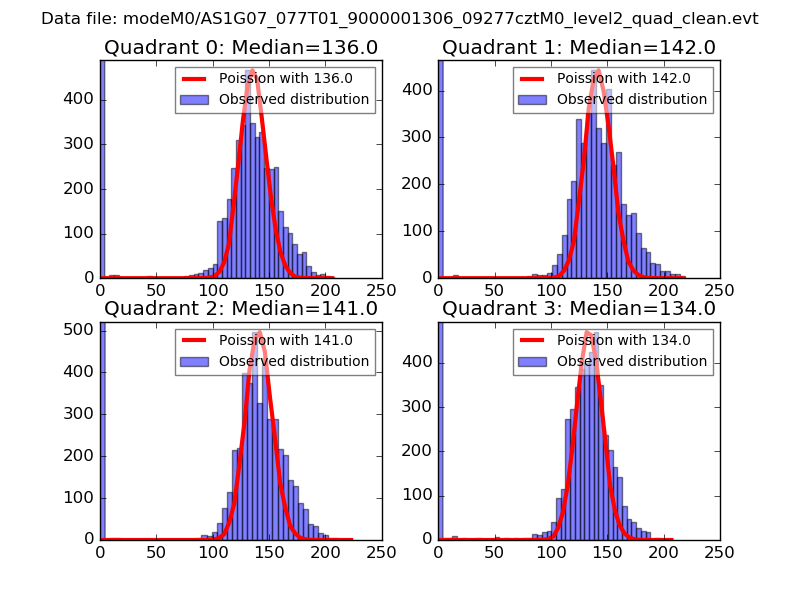 |
 |
| Quadrant-wise count rates Data is divided into 100 sec bins |
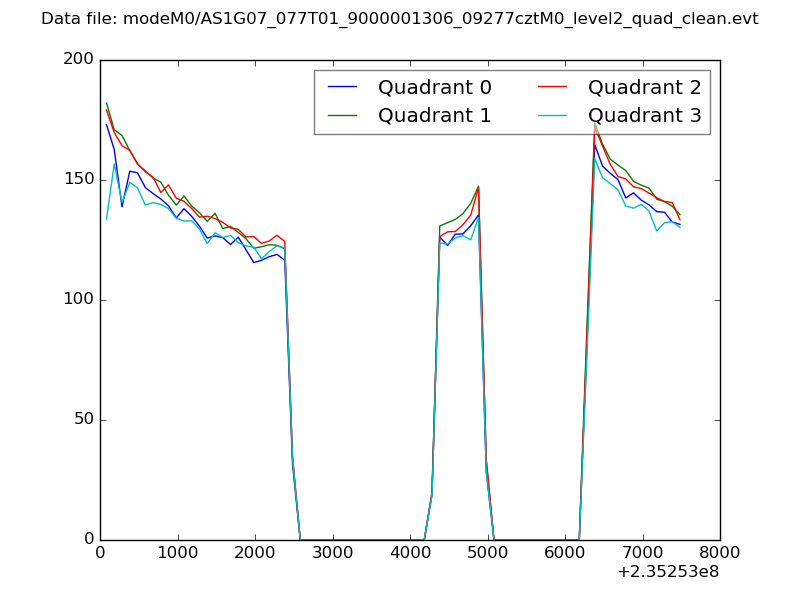 |
|
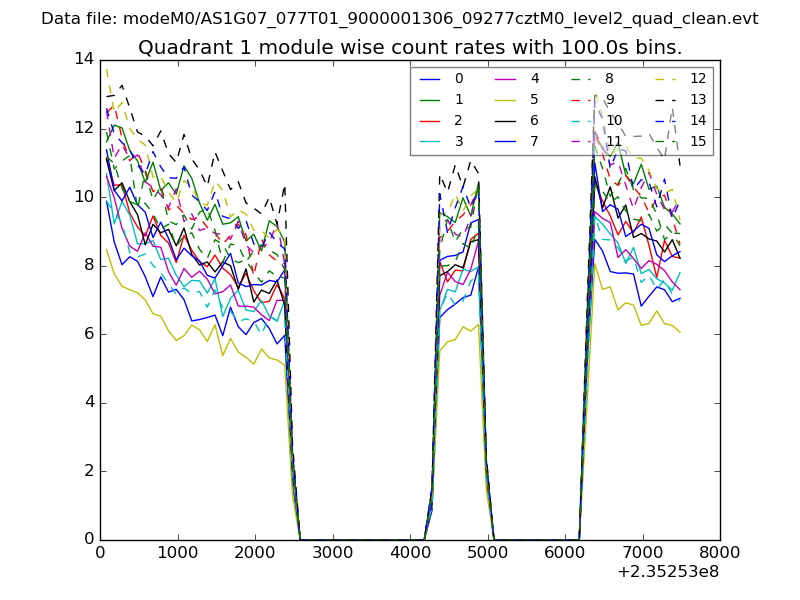
| Module-wise count rates for Quadrant A Data is divided into 100 sec bins |
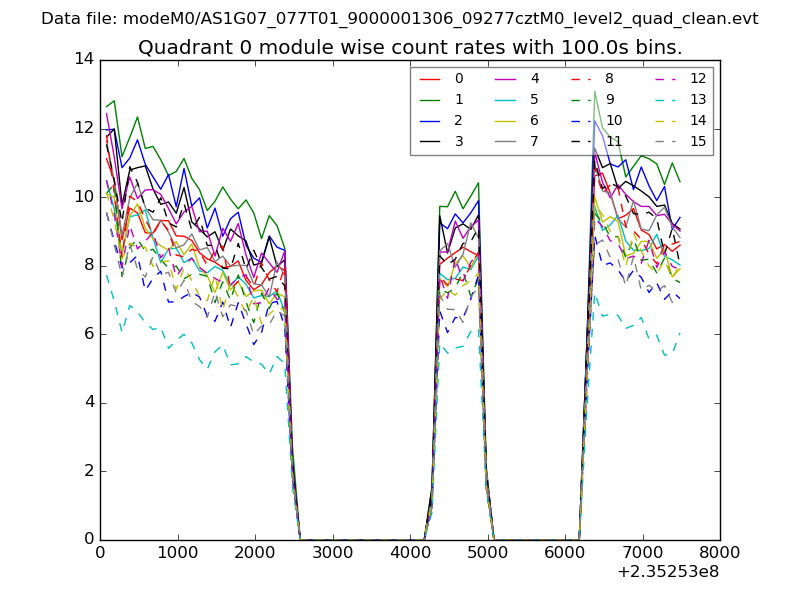 |
 |
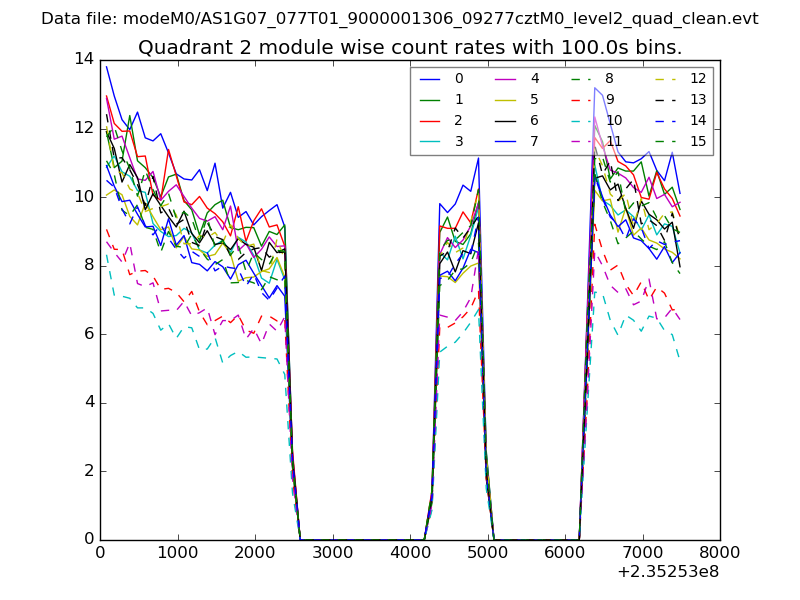
| Module-wise count rates for Quadrant B Data is divided into 100 sec bins |
 |
 |
| Module-wise count rates for Quadrant C Data is divided into 100 sec bins |
 |
 |
| Module-wise count rates for Quadrant D Data is divided into 100 sec bins |
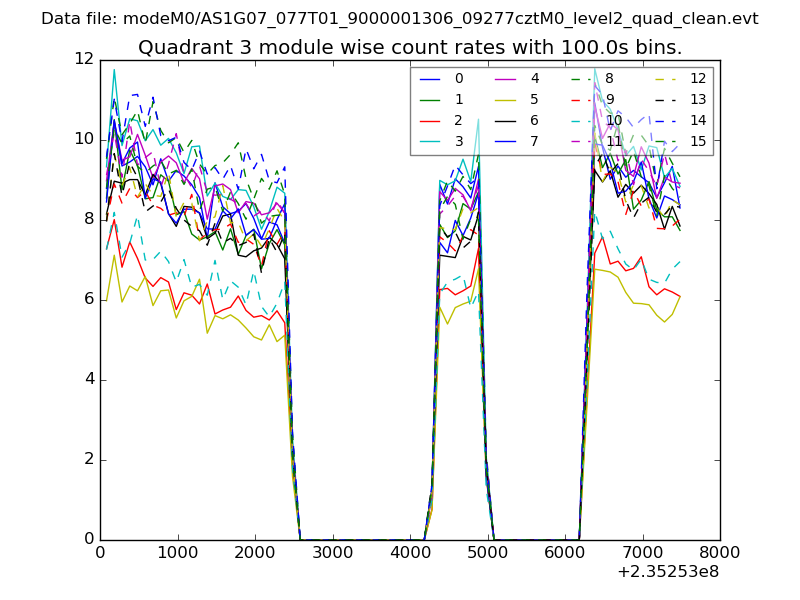 |
 |
| Parameter | Plot |
|---|---|
| CZT HV Monitor | 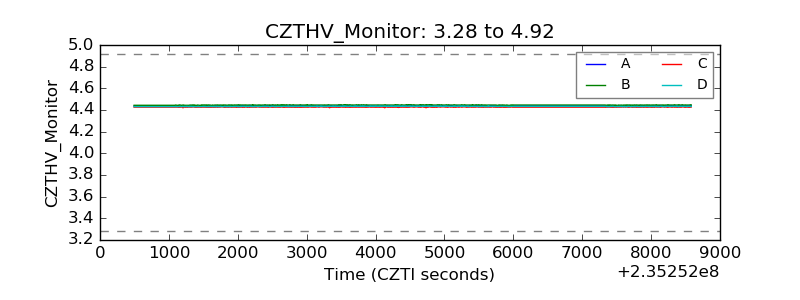 |
| D_VDD |  |
| Temperature 1 | 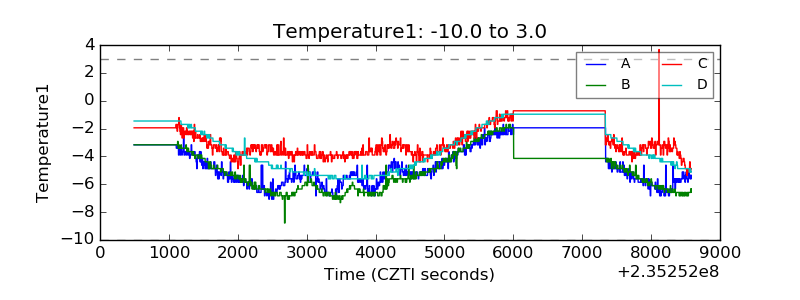 |
| Veto HV Monitor | 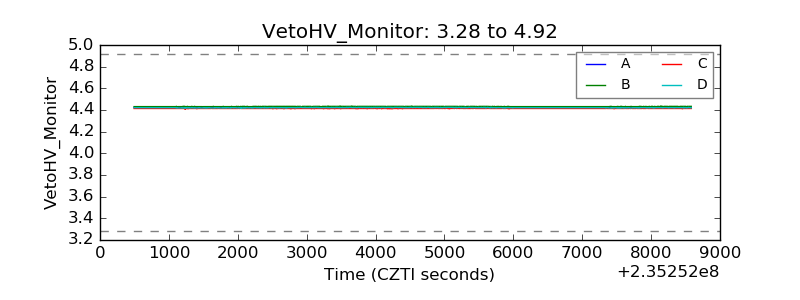 |
| Veto LLD | 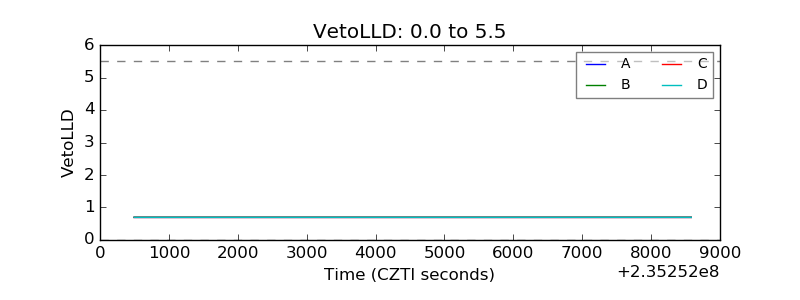 |
| Alpha Counter | 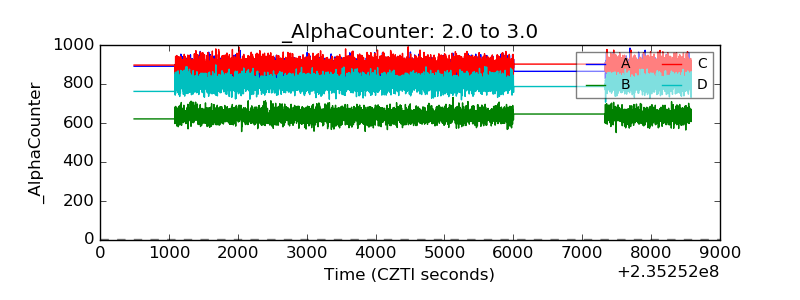 |
| _CPM_Rate | 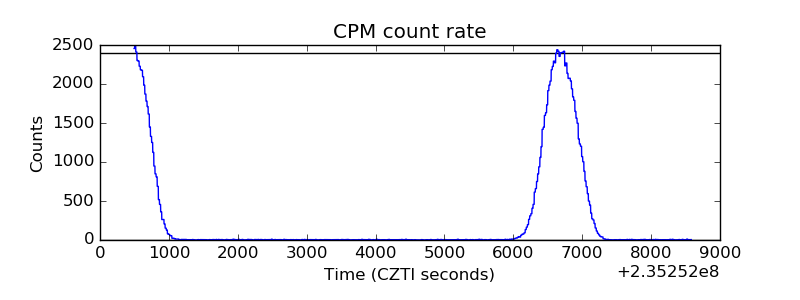 |
| CZT Counter | 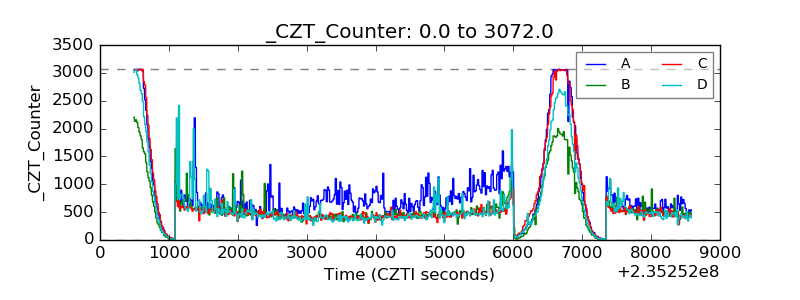 |
| +2.5 Volts monitor |  |
| +5 Volts monitor |  |
| _ROLL_ROT | 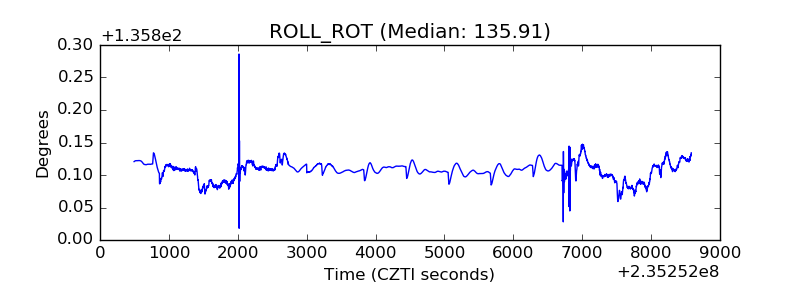 |
| _Roll_DEC | 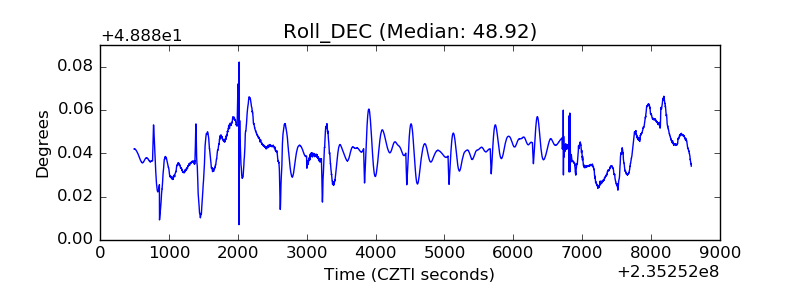 |
| _Roll_RA | 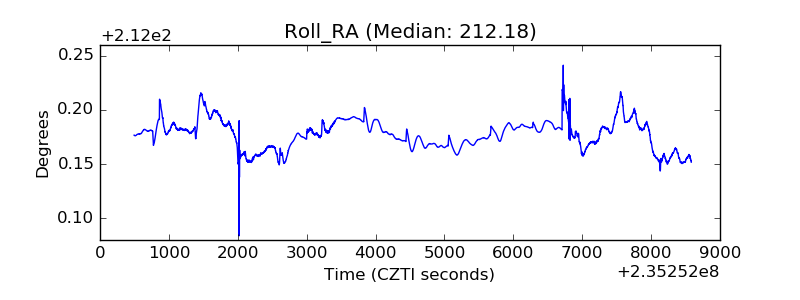 |
| Veto Counter | 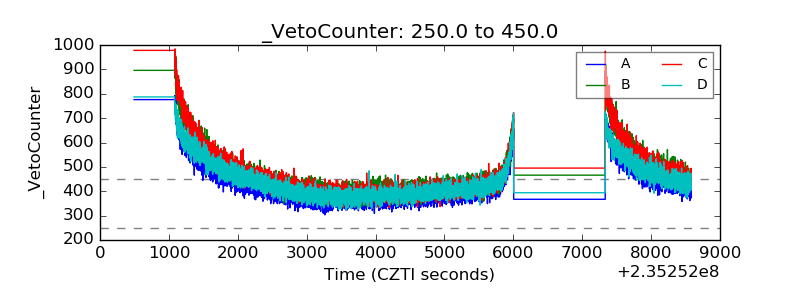 |