| Param | Original file | Final file |
|---|---|---|
| Filename | modeM0/AS1G07_077T01_9000001306_09278cztM0_level2.evt | modeM0/AS1G07_077T01_9000001306_09278cztM0_level2_quad_clean.evt |
| Size (bytes) | 407,401,920 | 83,983,680 |
| Size | 388.5 MB | 80.1 MB |
| Events in quadrant A | 3,590,878 | 529,875 |
| Events in quadrant B | 2,784,483 | 554,561 |
| Events in quadrant C | 2,636,351 | 549,280 |
| Events in quadrant D | 2,942,151 | 514,835 |
| Mode M0 | |||
|---|---|---|---|
| Quadrant | BADHDUFLAG | Total packets | Discarded packets |
| A | 0 | 15858 | 1559 |
| B | 0 | 13051 | 1069 |
| C | 0 | 12635 | 1005 |
| D | 0 | 13864 | 1131 |
| Mode SS | |||
|---|---|---|---|
| Quadrant | BADHDUFLAG | Total packets | Discarded packets |
| A | 0 | 126 | 12 |
| B | 0 | 125 | 4 |
| C | 0 | 126 | 10 |
| D | 0 | 126 | 10 |
| Mode M9 | |||
|---|---|---|---|
| Quadrant | BADHDUFLAG | Total packets | Discarded packets |
| A | 0 | 17 | 0 |
| B | 0 | 17 | 0 |
| C | 0 | 17 | 0 |
| D | 0 | 18 | 0 |
| Quadrant | Total seconds | Saturated seconds | Saturation percentage |
|---|---|---|---|
| A | 5562 | 77 | 1.384394% |
| B | 5641 | 49 | 0.868640% |
| C | 5655 | 31 | 0.548187% |
| D | 5653 | 105 | 1.857421% |
Noise dominated data is calculated using 1-second bins in cleaned event files. If a bin has >2000 counts, and if more than 50% of those come from <1% of pixels, then it is considered to be noise-dominated and hence unusable.
| Quadrant | # 1 sec bins | Bins with >0 counts | Bins with >2000 counts | High rate bins dominated by noise | Noise dominated (total time) | Noise dominated (detector-on time) | Marked lightcurve |
|---|---|---|---|---|---|---|---|
| A | 7461 | 6029 | 20 | 20 | 0.27% | 0.33% | 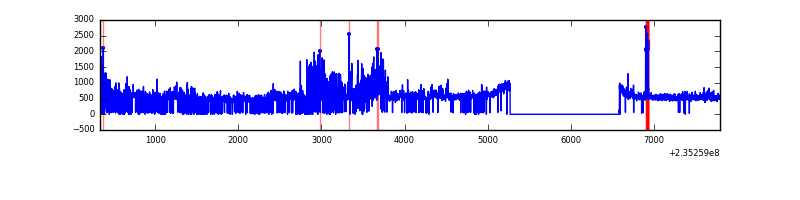 |
| B | 7461 | 6056 | 0 | 0 | 0.00% | 0.00% | 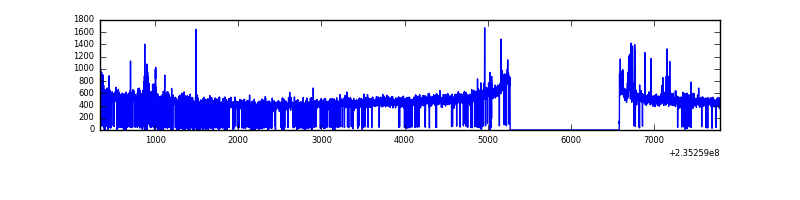 |
| C | 7461 | 6054 | 0 | 0 | 0.00% | 0.00% | 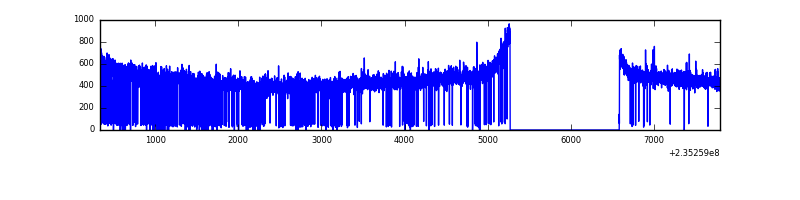 |
| D | 7461 | 6066 | 32 | 32 | 0.43% | 0.53% | 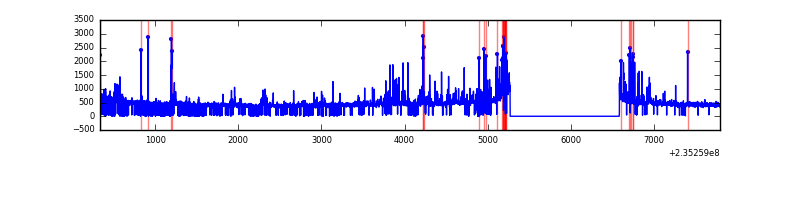 |
Top three noisy pixels from each quadrant. If the there are fewer than three noisy pixels in the level2.evt file, extra rows are filled as -1
| Pixel properties | Quadrant properties | ||||||
|---|---|---|---|---|---|---|---|
| Quadrant | DetID | PixID | Counts | Sigma | Mean | Median | Sigma |
| A | 8 | 5 | 852969 | 6371.21 | 663 | 651 | 133.8 |
| A | 13 | 251 | 77466 | 574.2 | 663 | 651 | 133.8 |
| A | 15 | 174 | 39091 | 287.34 | 663 | 651 | 133.8 |
| B | 0 | 214 | 29549 | 225.07 | 688 | 671 | 128.3 |
| B | 8 | 234 | 28214 | 214.66 | 688 | 671 | 128.3 |
| B | 0 | 219 | 23263 | 176.07 | 688 | 671 | 128.3 |
| C | 14 | 67 | 7839 | 46.26 | 672 | 676 | 154.8 |
| C | 10 | 22 | 5310 | 29.93 | 672 | 676 | 154.8 |
| C | 13 | 61 | 4902 | 27.29 | 672 | 676 | 154.8 |
| D | 12 | 233 | 234047 | 1417.92 | 650 | 633 | 164.6 |
| D | 2 | 136 | 65532 | 394.24 | 650 | 633 | 164.6 |
| D | 2 | 152 | 57792 | 347.22 | 650 | 633 | 164.6 |
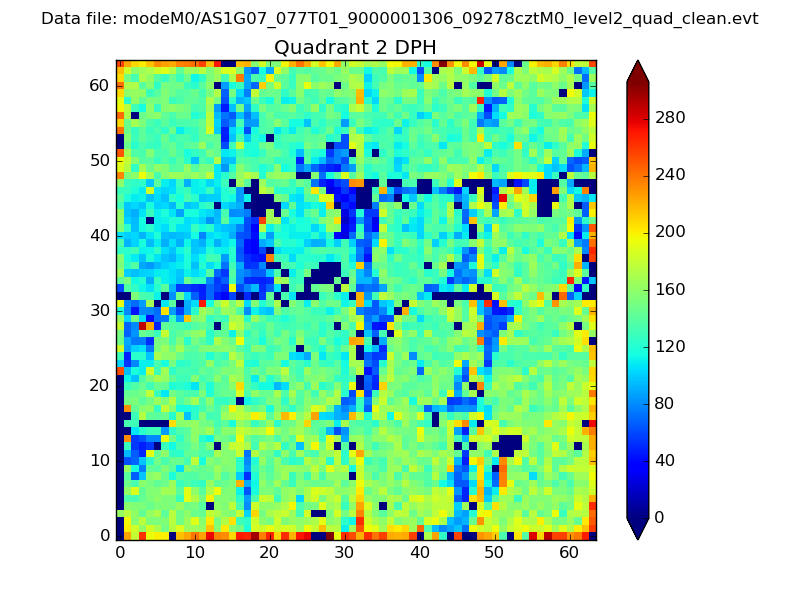
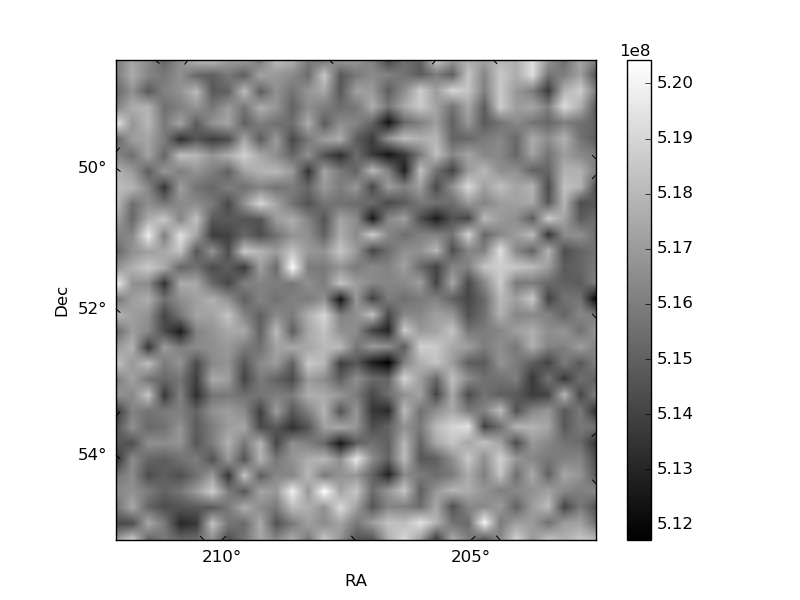
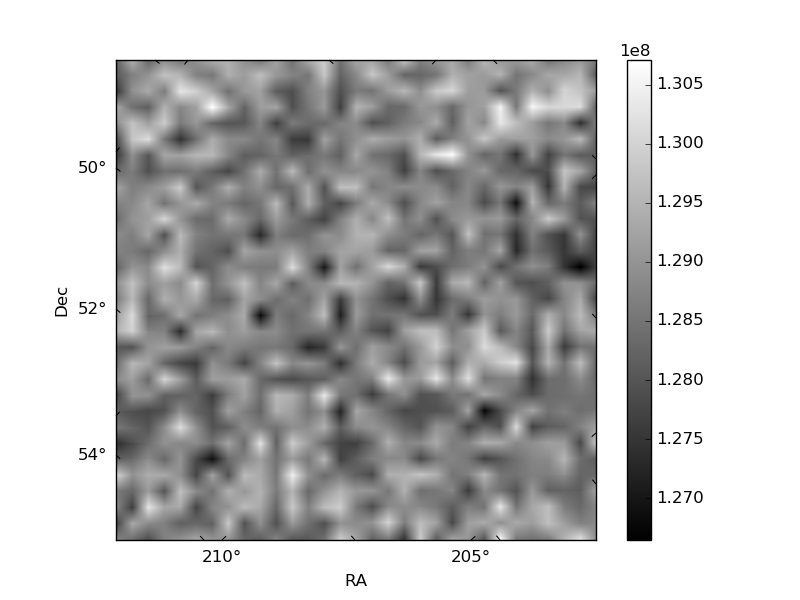
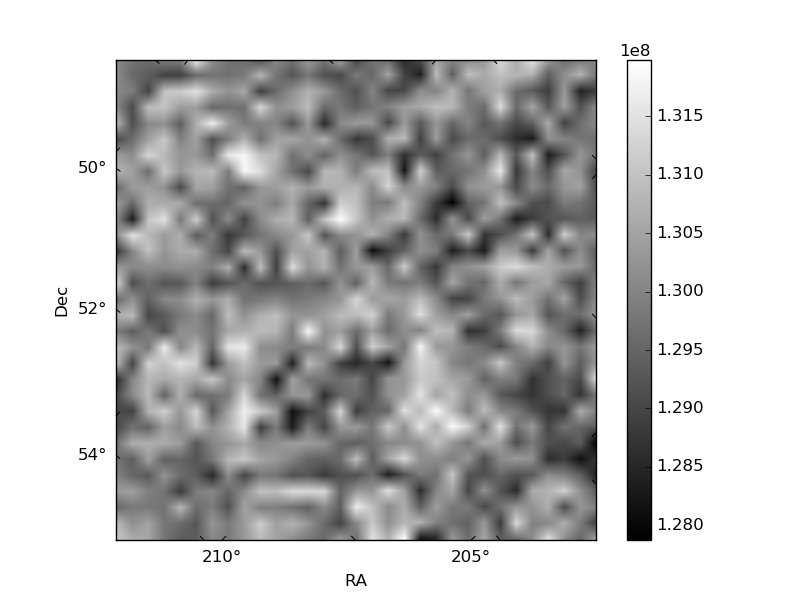
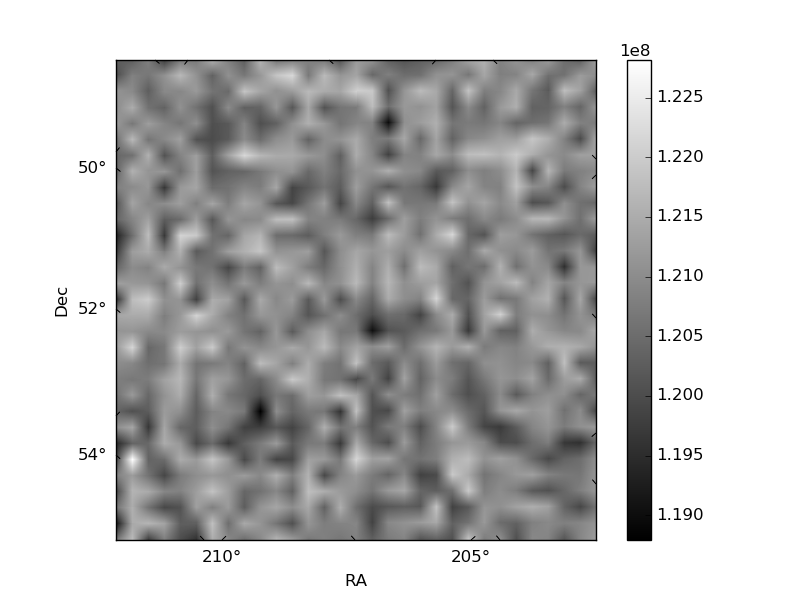
Histogram calculated using DETX and DETY for each event in the final _common_clean file
| Quadrant A | 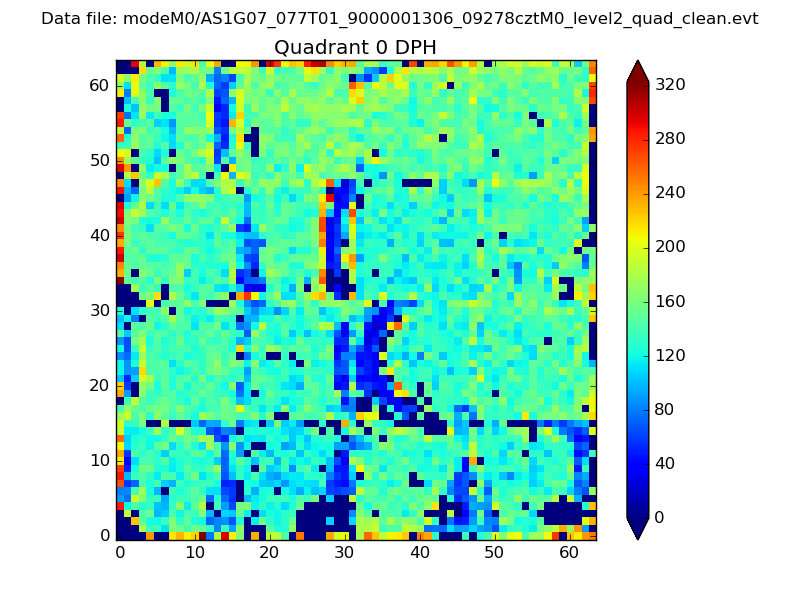 |
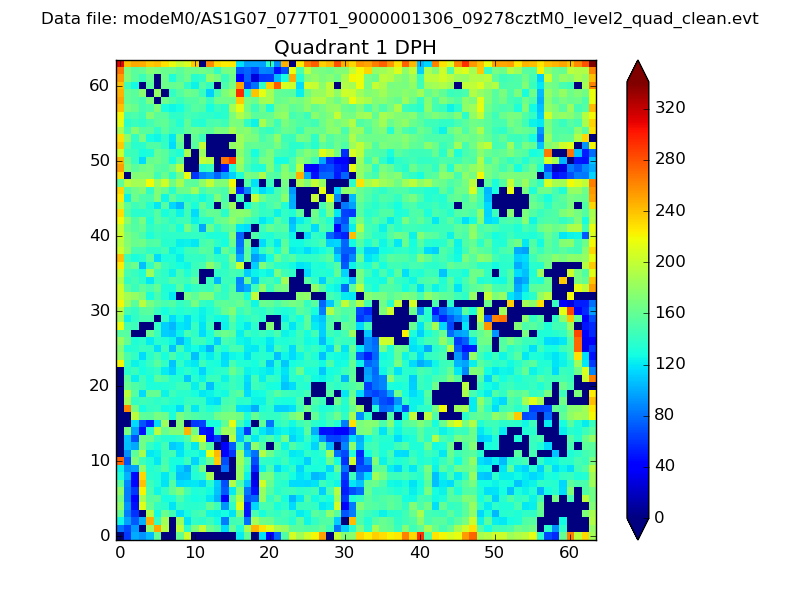 |
Quadrant B |
|---|---|---|---|
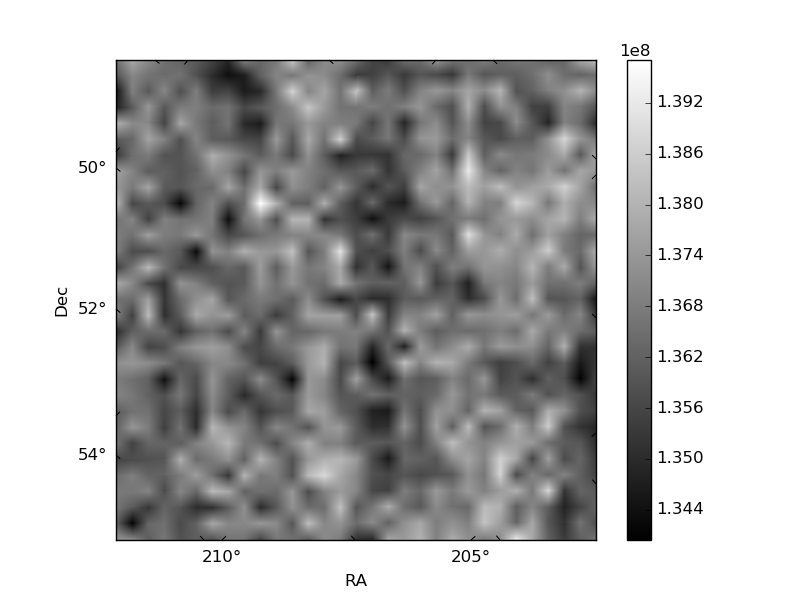
| Quadrant D | 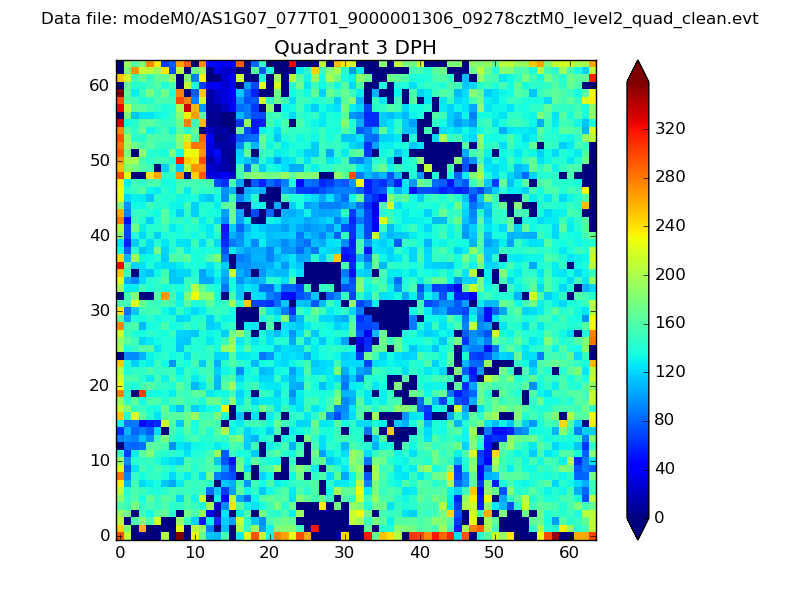 |
 |
Quadrant C |
| Plot type | Count rate plots | Images |
|---|---|---|
| Comparison with Poisson distribution Blue bars denote a histogram of data divided into 1 sec bins. Red curve is a Poisson curve with rate = median count rate of data. |
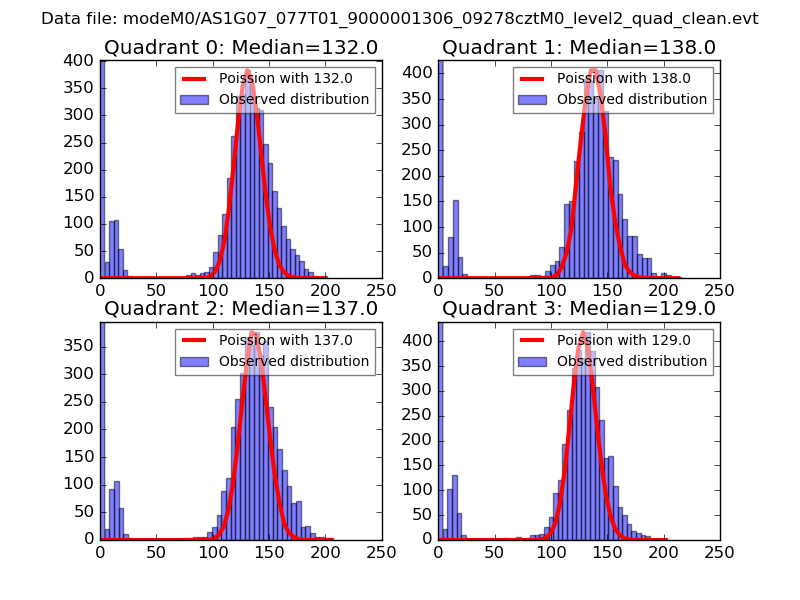 |
 |
| Quadrant-wise count rates Data is divided into 100 sec bins |
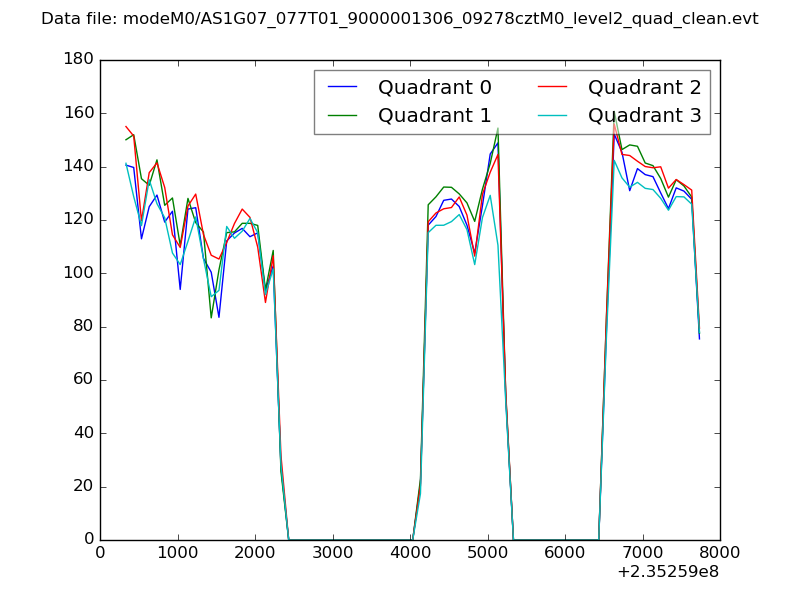 |
|
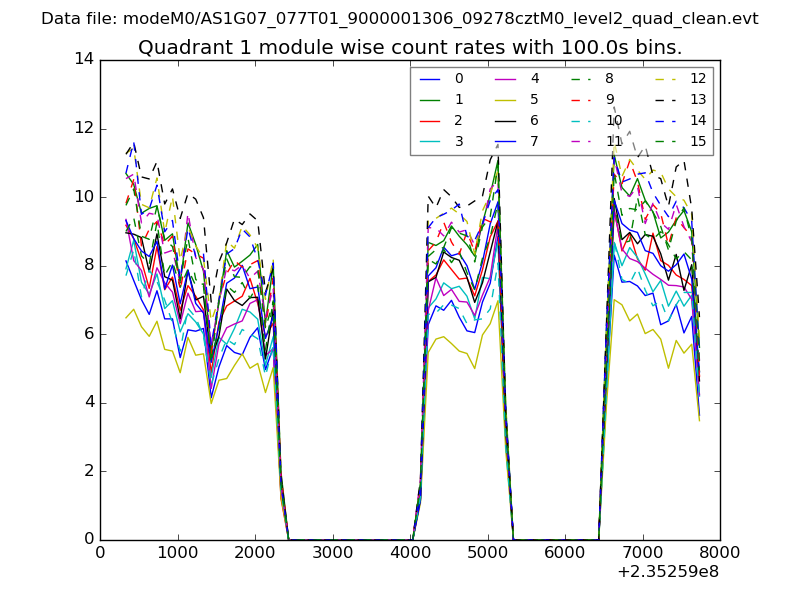
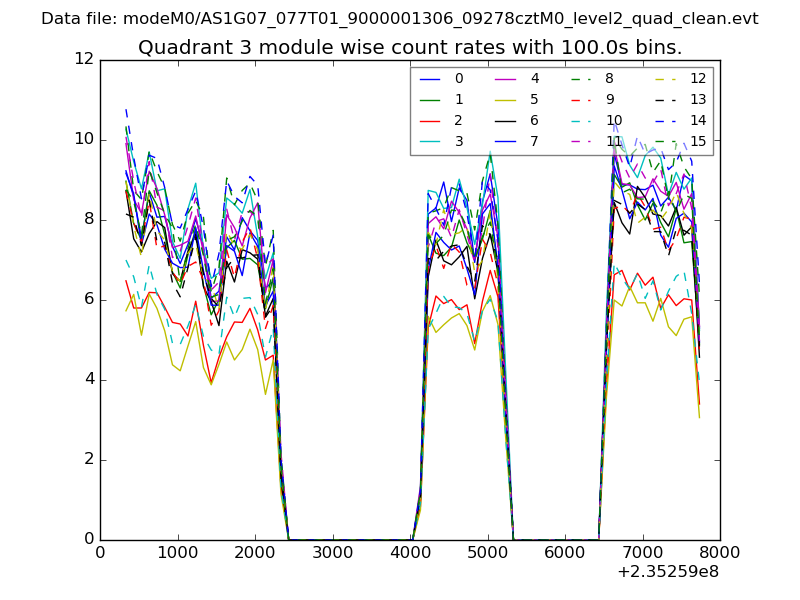
| Module-wise count rates for Quadrant A Data is divided into 100 sec bins |
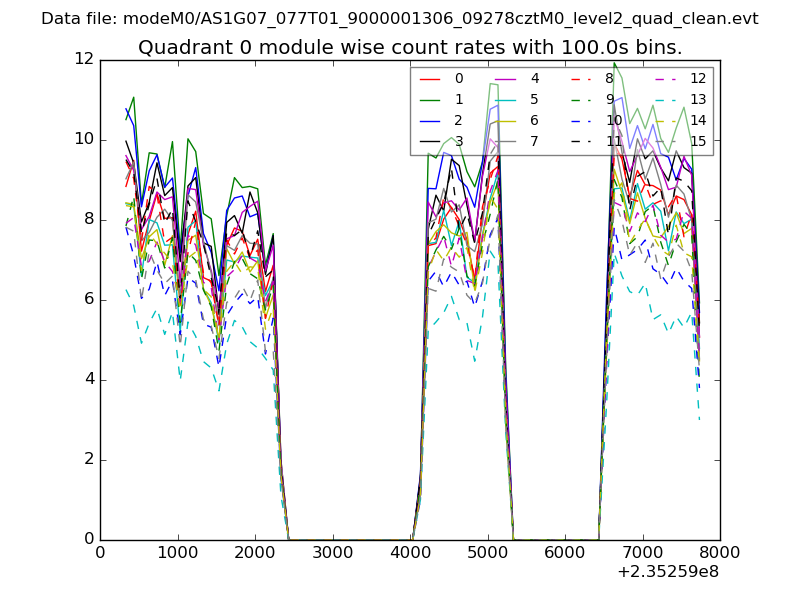 |
 |
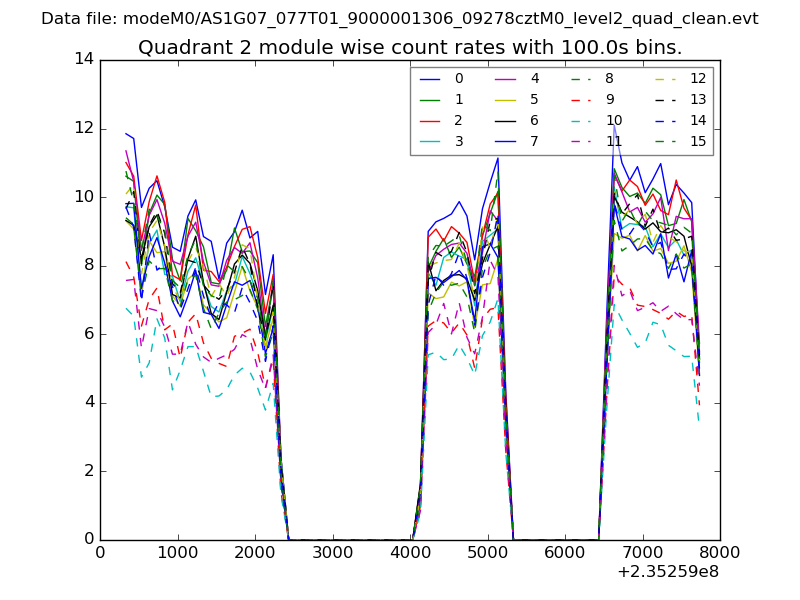
| Module-wise count rates for Quadrant B Data is divided into 100 sec bins |
 |
 |
| Module-wise count rates for Quadrant C Data is divided into 100 sec bins |
 |
 |
| Module-wise count rates for Quadrant D Data is divided into 100 sec bins |
 |
 |
| Parameter | Plot |
|---|---|
| CZT HV Monitor | 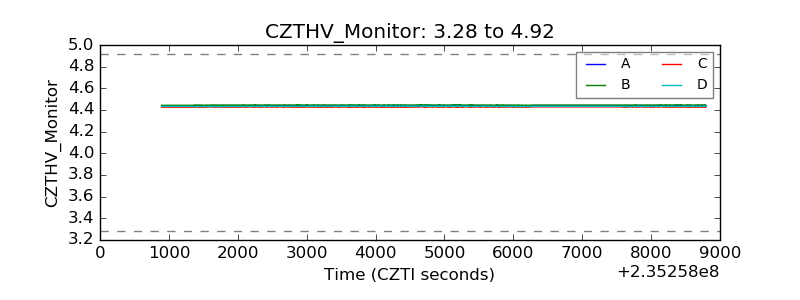 |
| D_VDD | 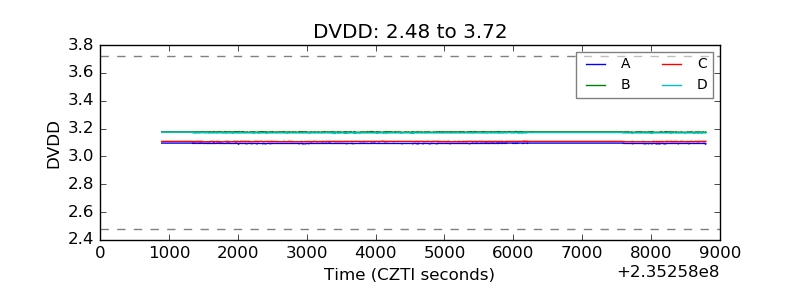 |
| Temperature 1 | 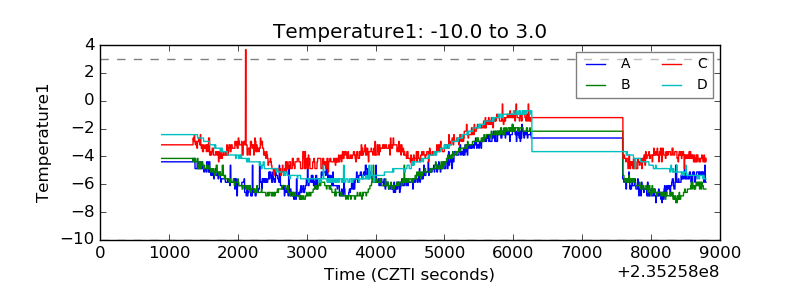 |
| Veto HV Monitor | 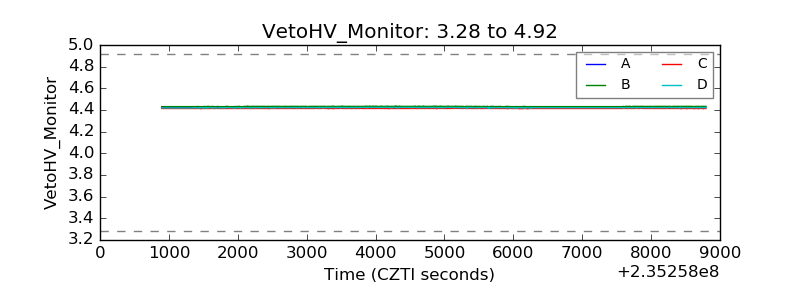 |
| Veto LLD | 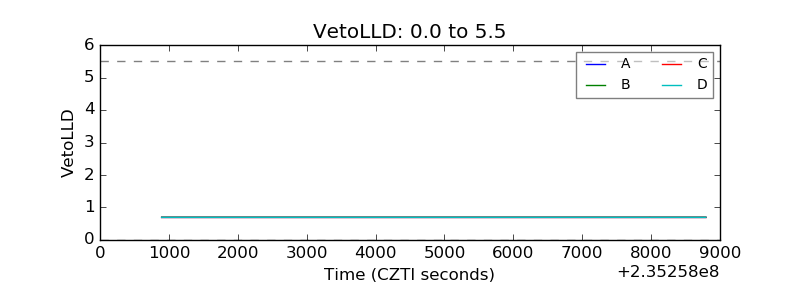 |
| Alpha Counter | 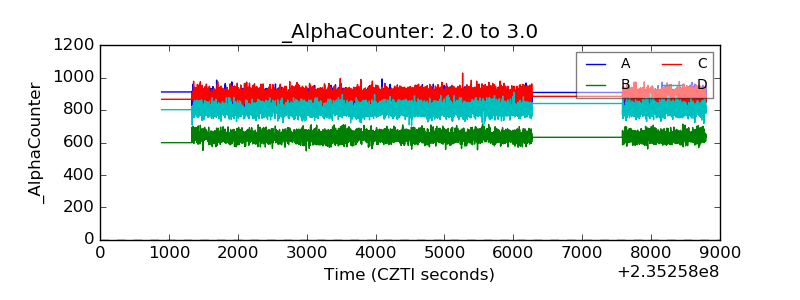 |
| _CPM_Rate | 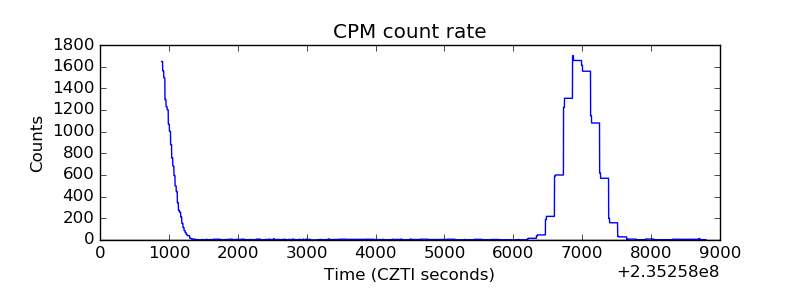 |
| CZT Counter | 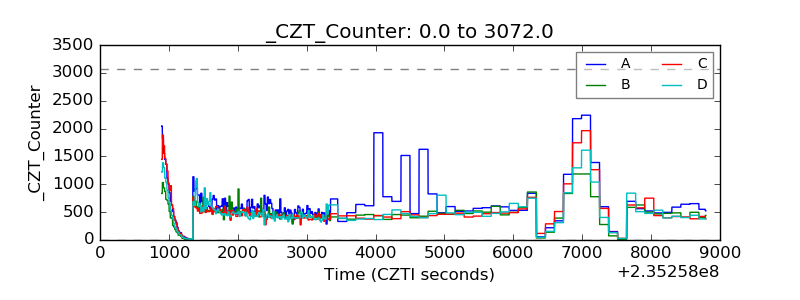 |
| +2.5 Volts monitor | 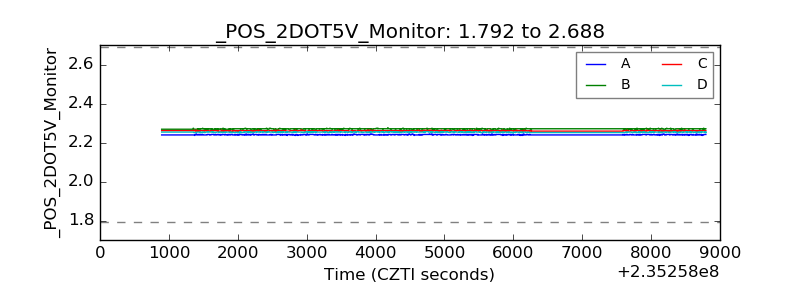 |
| +5 Volts monitor | 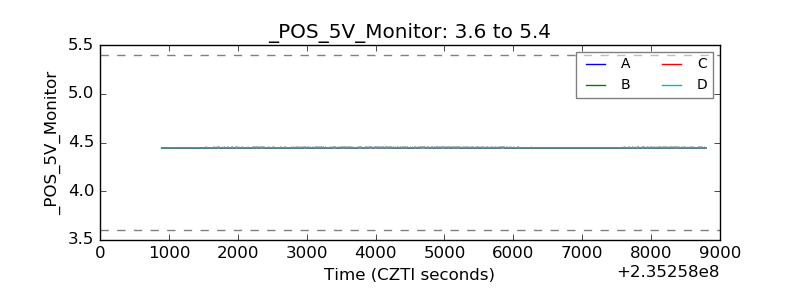 |
| _ROLL_ROT | 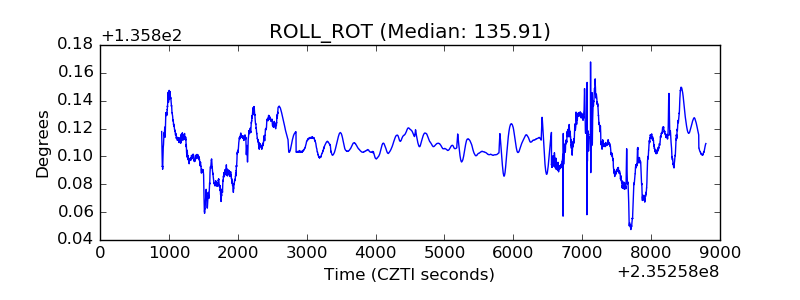 |
| _Roll_DEC | 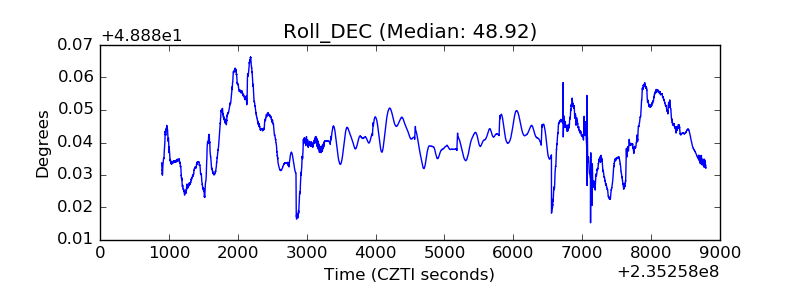 |
| _Roll_RA | 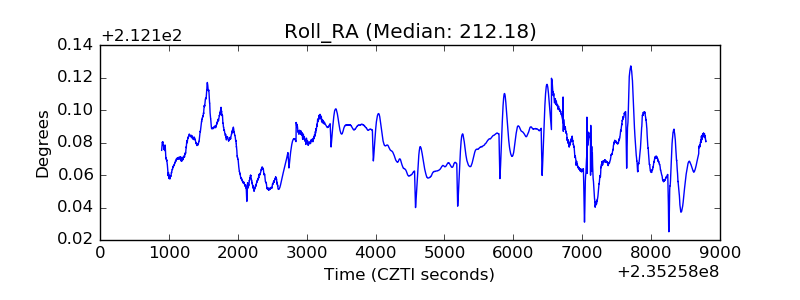 |
| Veto Counter | 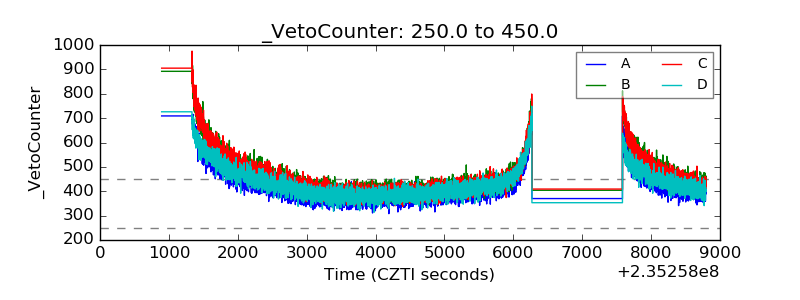 |