| Param | Original file | Final file |
|---|---|---|
| Filename | modeM0/AS1G07_077T01_9000001306_09279cztM0_level2.evt | modeM0/AS1G07_077T01_9000001306_09279cztM0_level2_quad_clean.evt |
| Size (bytes) | 840,697,920 | 153,944,640 |
| Size | 801.8 MB | 146.8 MB |
| Events in quadrant A | 7,737,506 | 944,660 |
| Events in quadrant B | 5,746,256 | 985,970 |
| Events in quadrant C | 5,382,122 | 984,527 |
| Events in quadrant D | 5,790,104 | 925,770 |
| Mode M0 | |||
|---|---|---|---|
| Quadrant | BADHDUFLAG | Total packets | Discarded packets |
| A | 0 | 39333 | 8455 |
| B | 0 | 33123 | 8058 |
| C | 0 | 31725 | 7500 |
| D | 0 | 34496 | 8705 |
| Mode SS | |||
|---|---|---|---|
| Quadrant | BADHDUFLAG | Total packets | Discarded packets |
| A | 0 | 315 | 81 |
| B | 0 | 316 | 78 |
| C | 0 | 317 | 69 |
| D | 0 | 316 | 60 |
| Mode M9 | |||
|---|---|---|---|
| Quadrant | BADHDUFLAG | Total packets | Discarded packets |
| A | 0 | 39 | 4 |
| B | 0 | 39 | 11 |
| C | 0 | 40 | 9 |
| D | 0 | 40 | 10 |
| Quadrant | Total seconds | Saturated seconds | Saturation percentage |
|---|---|---|---|
| A | 11815 | 132 | 1.117224% |
| B | 11879 | 80 | 0.673457% |
| C | 11895 | 19 | 0.159731% |
| D | 11840 | 107 | 0.903716% |
Noise dominated data is calculated using 1-second bins in cleaned event files. If a bin has >2000 counts, and if more than 50% of those come from <1% of pixels, then it is considered to be noise-dominated and hence unusable.
| Quadrant | # 1 sec bins | Bins with >0 counts | Bins with >2000 counts | High rate bins dominated by noise | Noise dominated (total time) | Noise dominated (detector-on time) | Marked lightcurve |
|---|---|---|---|---|---|---|---|
| A | 19438 | 12687 | 18 | 18 | 0.09% | 0.14% | 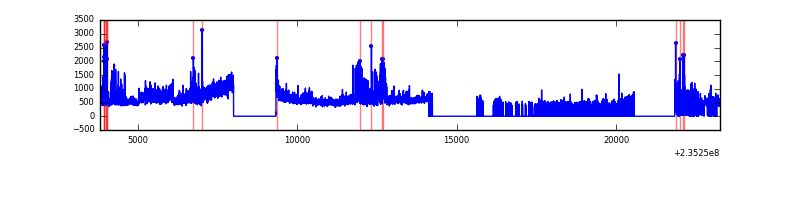 |
| B | 19438 | 12761 | 7 | 7 | 0.04% | 0.05% | 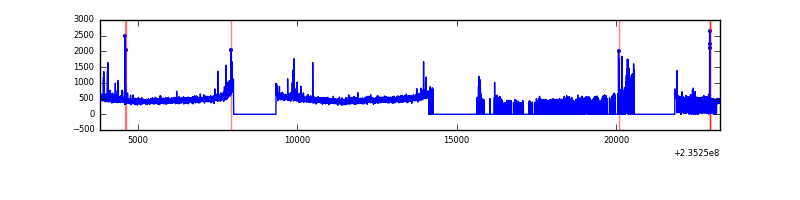 |
| C | 19438 | 12772 | 0 | 0 | 0.00% | 0.00% | 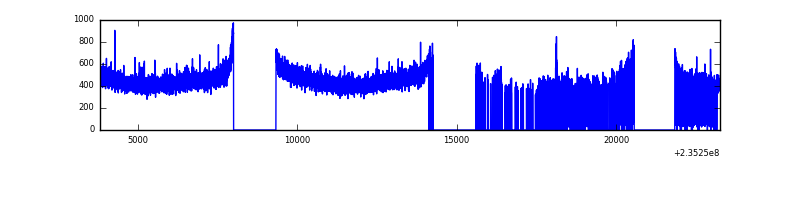 |
| D | 19438 | 12661 | 46 | 46 | 0.24% | 0.36% | 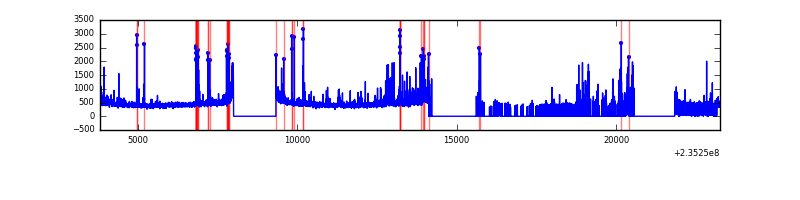 |
Top three noisy pixels from each quadrant. If the there are fewer than three noisy pixels in the level2.evt file, extra rows are filled as -1
| Pixel properties | Quadrant properties | ||||||
|---|---|---|---|---|---|---|---|
| Quadrant | DetID | PixID | Counts | Sigma | Mean | Median | Sigma |
| A | 8 | 5 | 2160686 | 7850.62 | 1374 | 1347 | 275.1 |
| A | 13 | 251 | 134578 | 484.38 | 1374 | 1347 | 275.1 |
| A | 1 | 162 | 81785 | 292.45 | 1374 | 1347 | 275.1 |
| B | 0 | 214 | 80504 | 302.71 | 1409 | 1373 | 261.4 |
| B | 8 | 234 | 51882 | 193.22 | 1409 | 1373 | 261.4 |
| B | 0 | 245 | 41793 | 154.62 | 1409 | 1373 | 261.4 |
| C | 14 | 67 | 14308 | 41.21 | 1372 | 1380 | 313.7 |
| C | 13 | 61 | 10348 | 28.59 | 1372 | 1380 | 313.7 |
| C | 10 | 22 | 7820 | 20.53 | 1372 | 1380 | 313.7 |
| D | 12 | 233 | 380117 | 1150.91 | 1334 | 1299 | 329.1 |
| D | 2 | 136 | 105874 | 317.72 | 1334 | 1299 | 329.1 |
| D | 2 | 152 | 88269 | 264.23 | 1334 | 1299 | 329.1 |
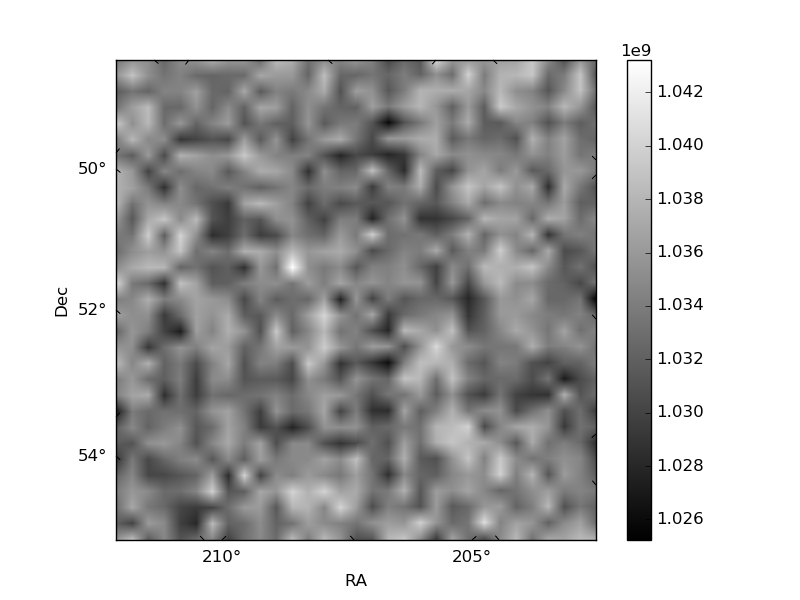
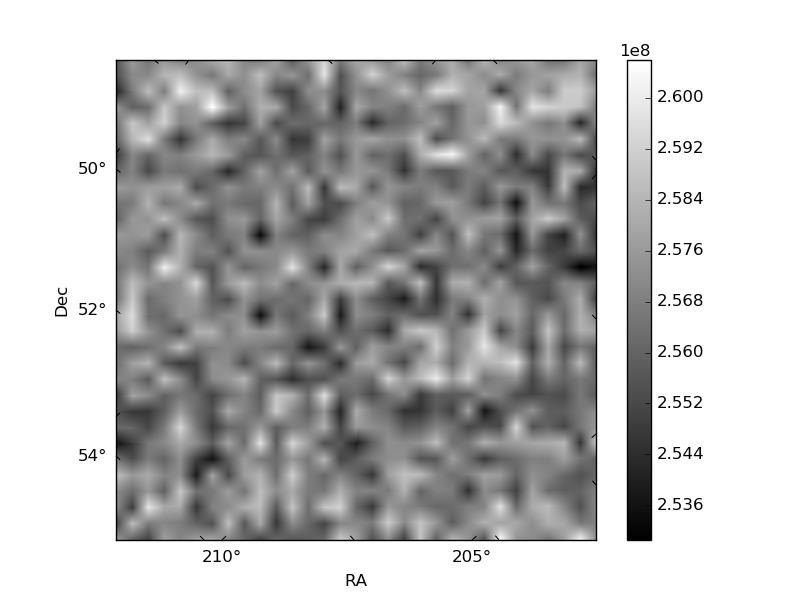
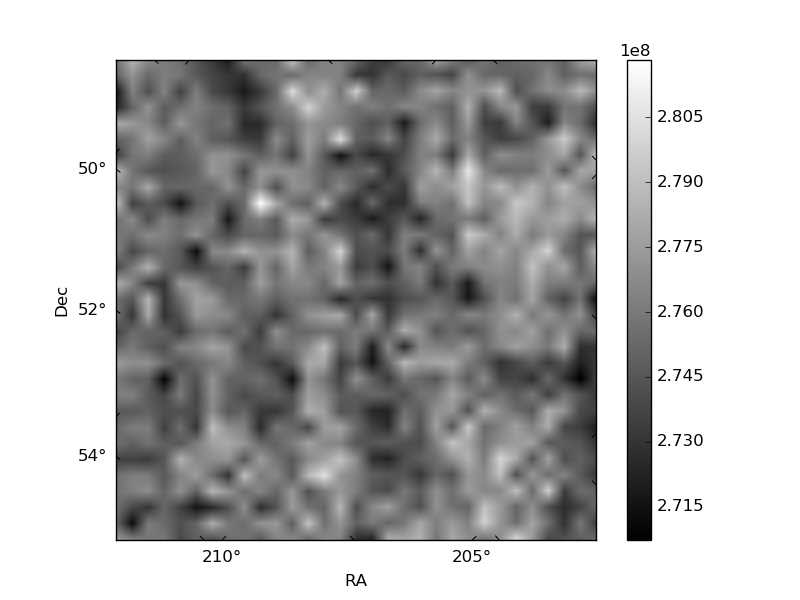
Histogram calculated using DETX and DETY for each event in the final _common_clean file
| Quadrant A | 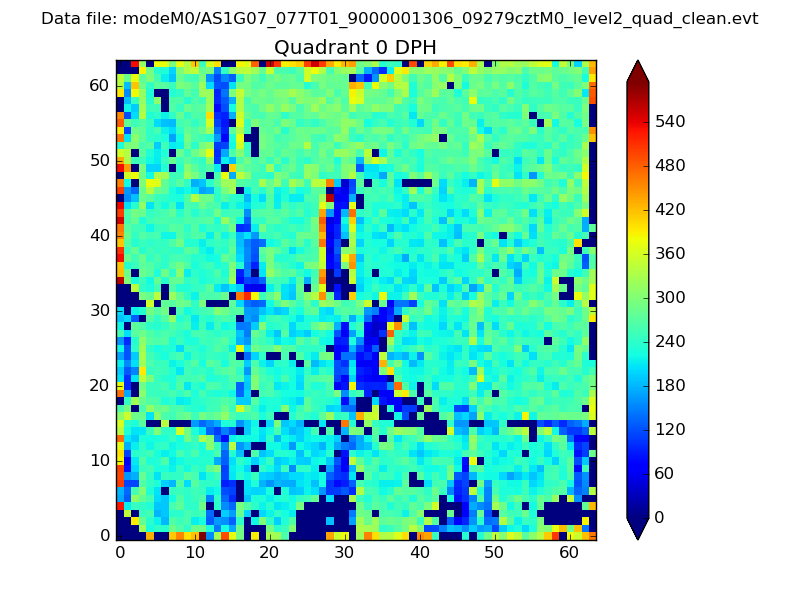 |
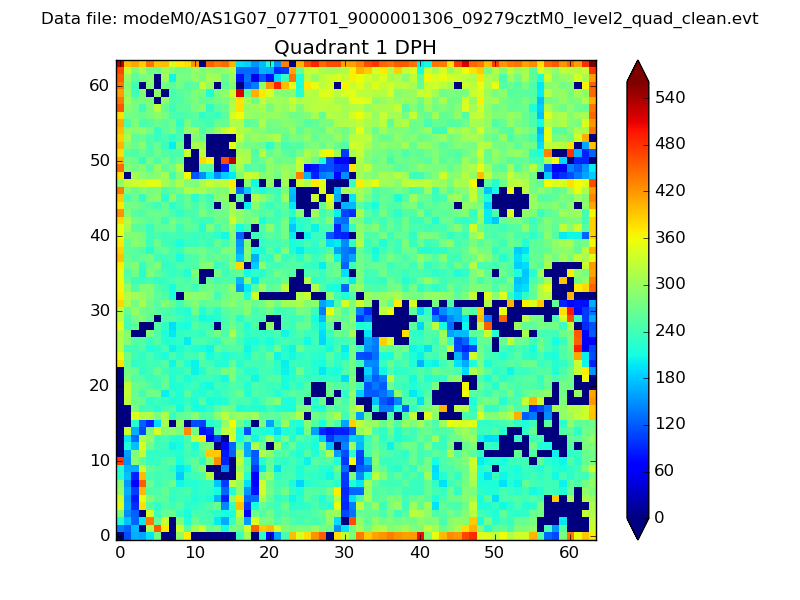 |
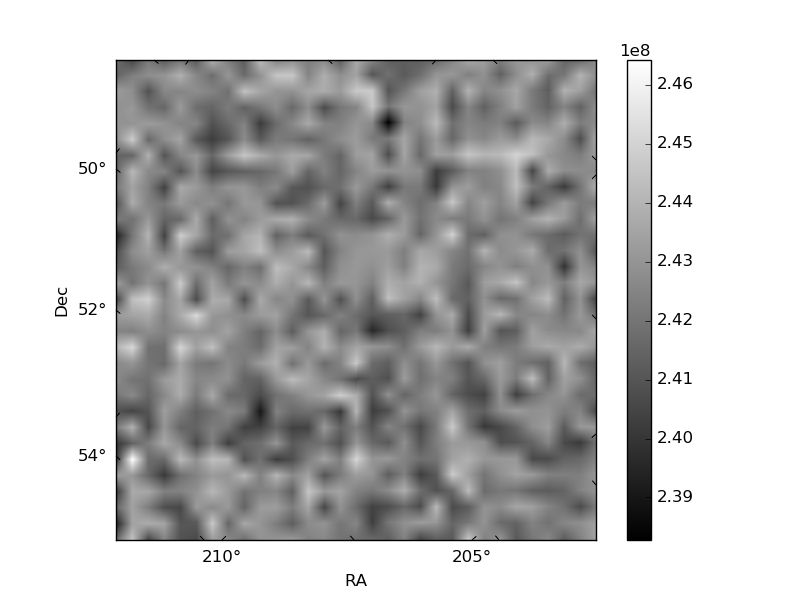
Quadrant B |
|---|---|---|---|
| Quadrant D | 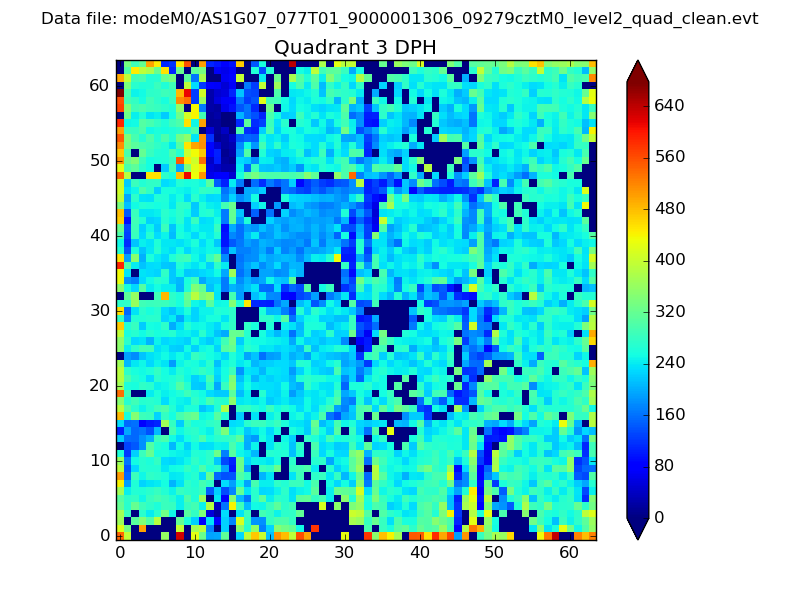 |
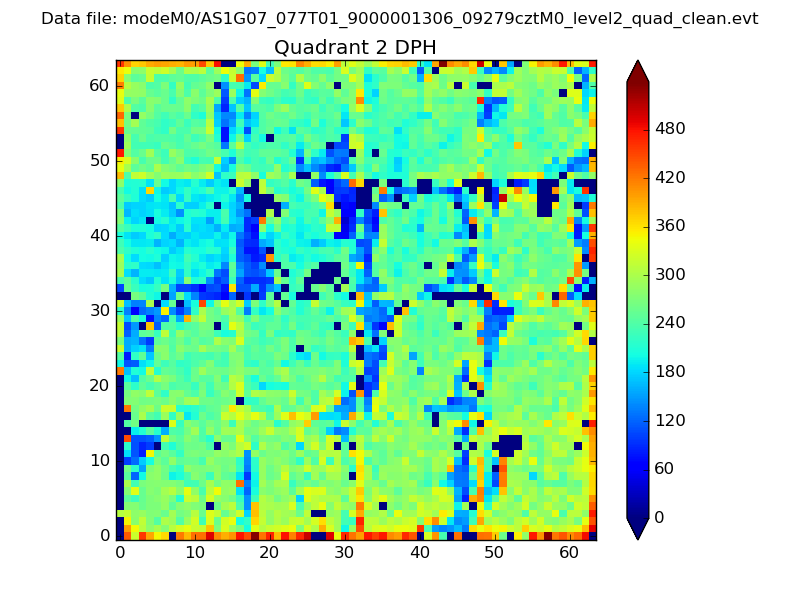 |
Quadrant C |
| Plot type | Count rate plots | Images |
|---|---|---|
| Comparison with Poisson distribution Blue bars denote a histogram of data divided into 1 sec bins. Red curve is a Poisson curve with rate = median count rate of data. |
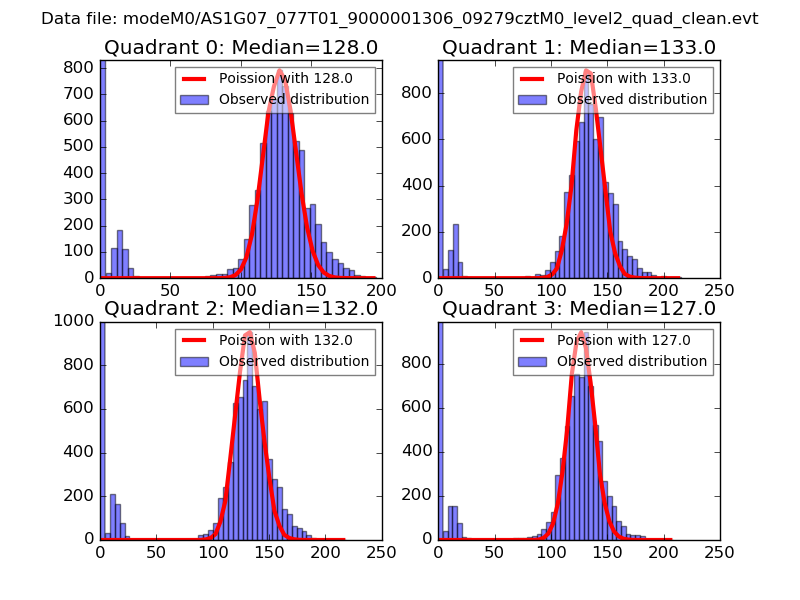 |
 |
| Quadrant-wise count rates Data is divided into 100 sec bins |
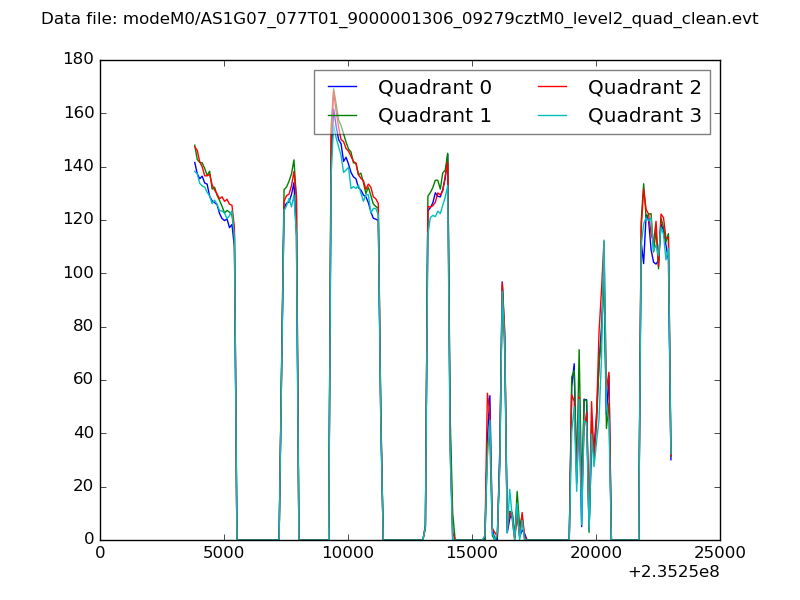 |
|
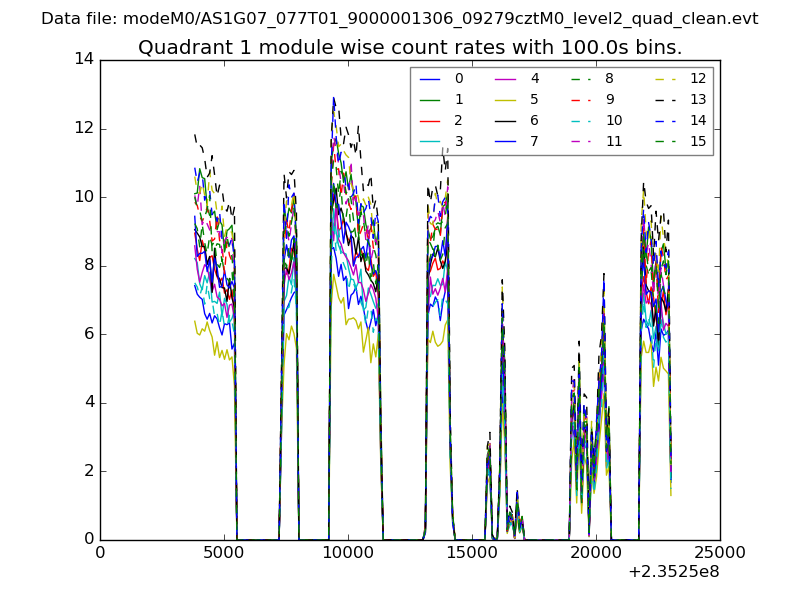
| Module-wise count rates for Quadrant A Data is divided into 100 sec bins |
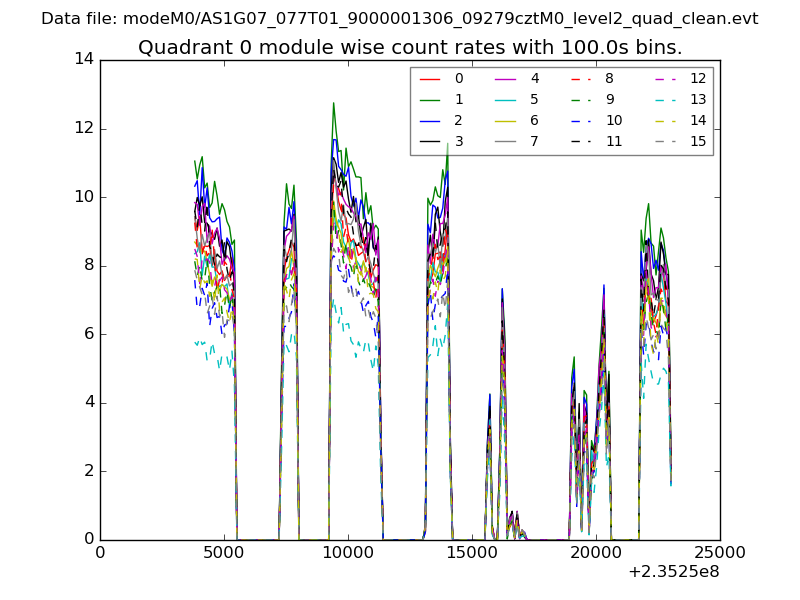 |
 |
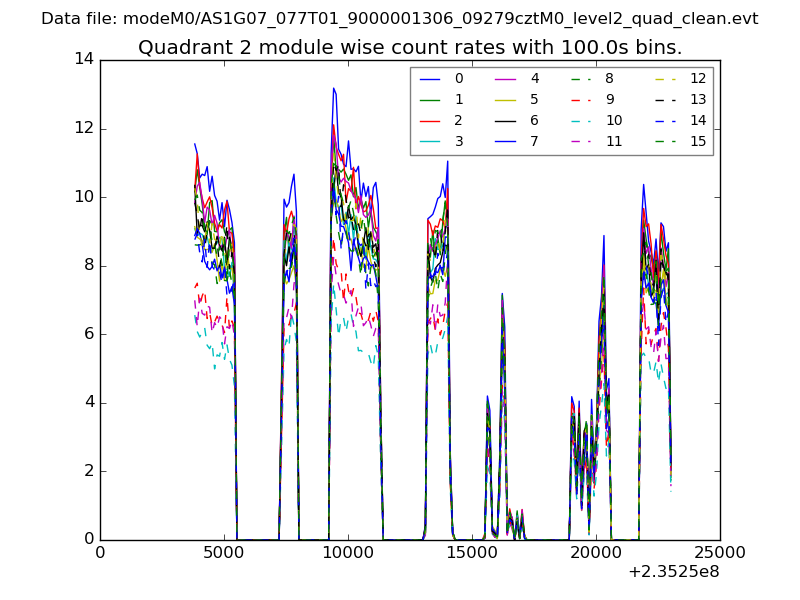
| Module-wise count rates for Quadrant B Data is divided into 100 sec bins |
 |
 |
| Module-wise count rates for Quadrant C Data is divided into 100 sec bins |
 |
 |
| Module-wise count rates for Quadrant D Data is divided into 100 sec bins |
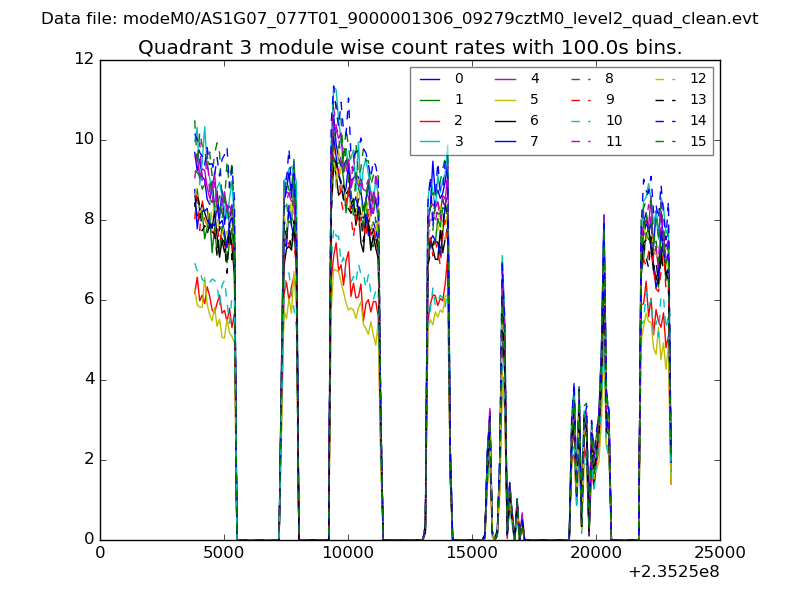 |
 |
| Parameter | Plot |
|---|---|
| CZT HV Monitor | 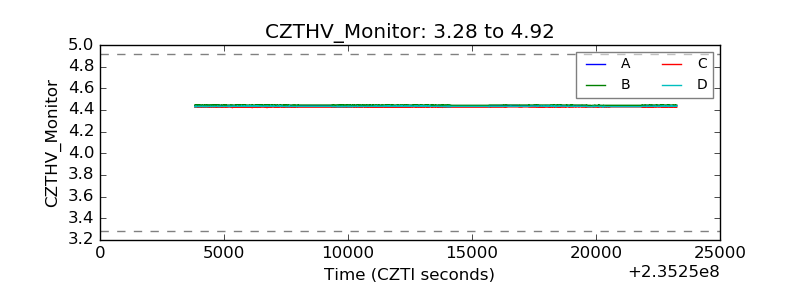 |
| D_VDD |  |
| Temperature 1 |  |
| Veto HV Monitor | 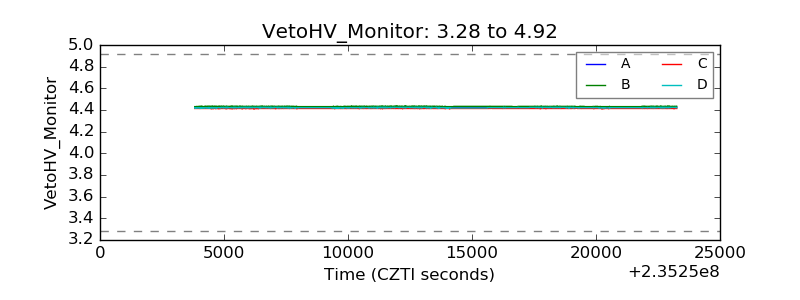 |
| Veto LLD |  |
| Alpha Counter | 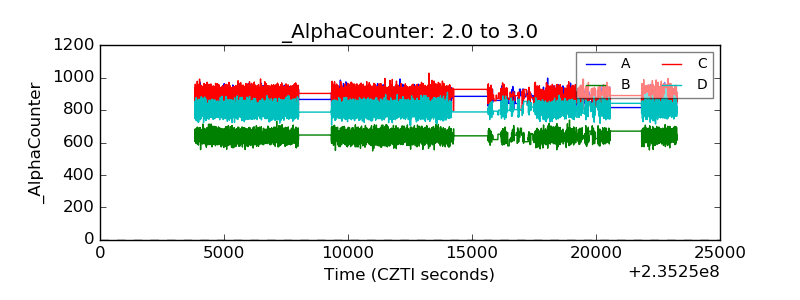 |
| _CPM_Rate | 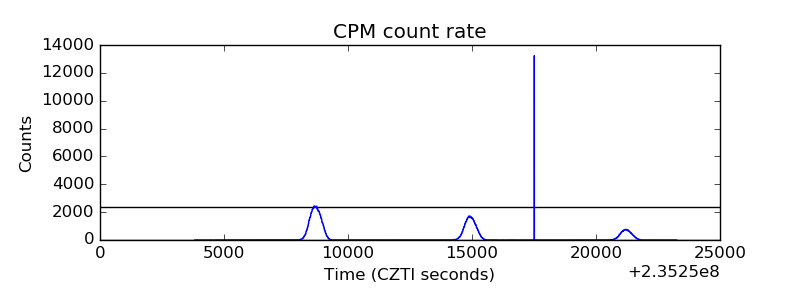 |
| CZT Counter | 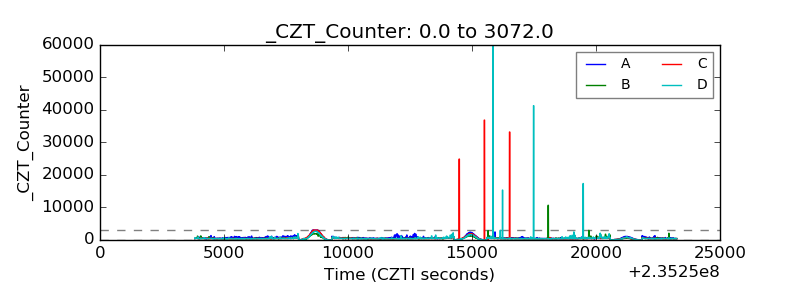 |
| +2.5 Volts monitor |  |
| +5 Volts monitor |  |
| _ROLL_ROT | 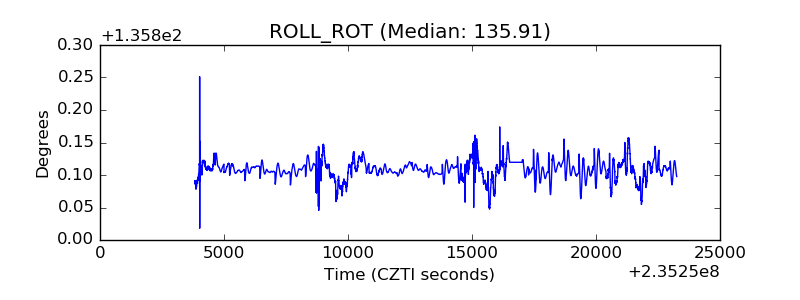 |
| _Roll_DEC | 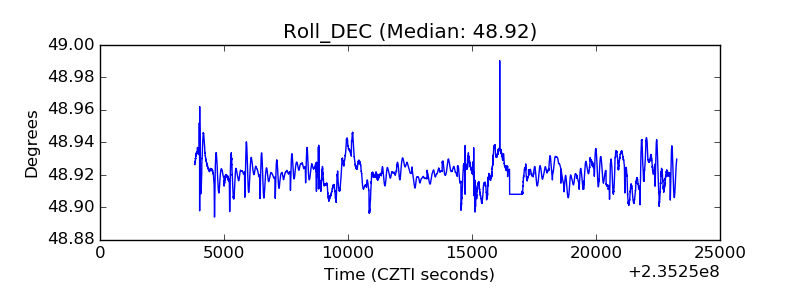 |
| _Roll_RA | 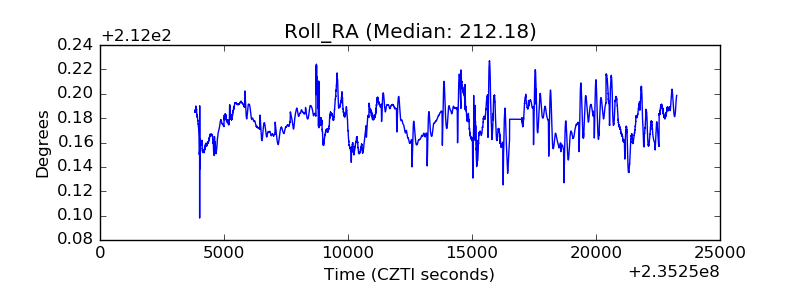 |
| Veto Counter | 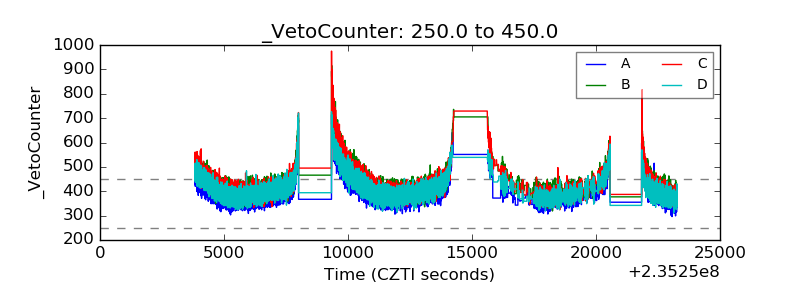 |