| Param | Original file | Final file |
|---|---|---|
| Filename | modeM0/AS1G07_077T01_9000001306_09281cztM0_level2.evt | modeM0/AS1G07_077T01_9000001306_09281cztM0_level2_quad_clean.evt |
| Size (bytes) | 530,628,480 | 89,190,720 |
| Size | 506.0 MB | 85.1 MB |
| Events in quadrant A | 4,810,867 | 544,172 |
| Events in quadrant B | 3,479,643 | 568,324 |
| Events in quadrant C | 3,233,273 | 569,765 |
| Events in quadrant D | 4,071,427 | 531,341 |
| Mode M0 | |||
|---|---|---|---|
| Quadrant | BADHDUFLAG | Total packets | Discarded packets |
| A | 0 | 20224 | 1218 |
| B | 0 | 15925 | 912 |
| C | 0 | 15403 | 839 |
| D | 0 | 18343 | 1378 |
| Mode SS | |||
|---|---|---|---|
| Quadrant | BADHDUFLAG | Total packets | Discarded packets |
| A | 0 | 154 | 10 |
| B | 0 | 154 | 12 |
| C | 0 | 154 | 2 |
| D | 0 | 154 | 12 |
| Mode M9 | |||
|---|---|---|---|
| Quadrant | BADHDUFLAG | Total packets | Discarded packets |
| A | 0 | 15 | 0 |
| B | 0 | 15 | 0 |
| C | 0 | 15 | 0 |
| D | 0 | 15 | 0 |
| Quadrant | Total seconds | Saturated seconds | Saturation percentage |
|---|---|---|---|
| A | 6957 | 238 | 3.421015% |
| B | 7010 | 179 | 2.553495% |
| C | 7029 | 80 | 1.138142% |
| D | 6956 | 266 | 3.824037% |
Noise dominated data is calculated using 1-second bins in cleaned event files. If a bin has >2000 counts, and if more than 50% of those come from <1% of pixels, then it is considered to be noise-dominated and hence unusable.
| Quadrant | # 1 sec bins | Bins with >0 counts | Bins with >2000 counts | High rate bins dominated by noise | Noise dominated (total time) | Noise dominated (detector-on time) | Marked lightcurve |
|---|---|---|---|---|---|---|---|
| A | 8943 | 7360 | 35 | 35 | 0.39% | 0.48% | 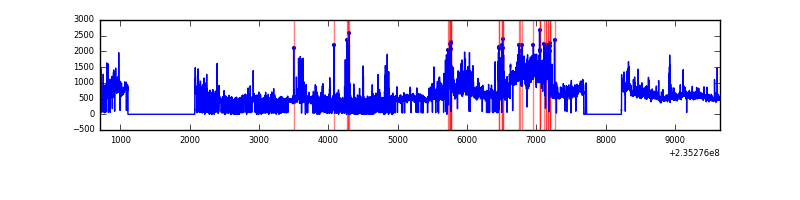 |
| B | 8943 | 7360 | 5 | 5 | 0.06% | 0.07% | 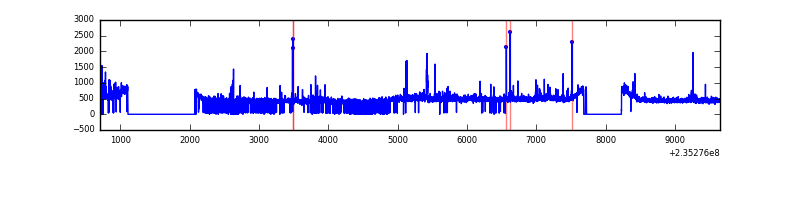 |
| C | 8943 | 7389 | 0 | 0 | 0.00% | 0.00% | 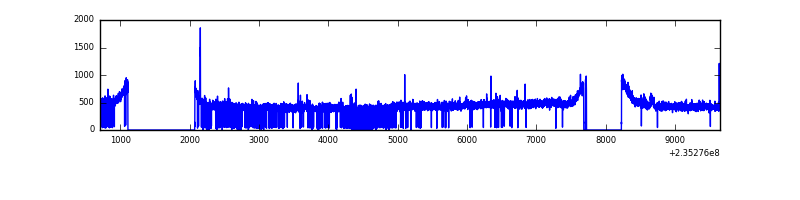 |
| D | 8943 | 7341 | 139 | 139 | 1.55% | 1.89% | 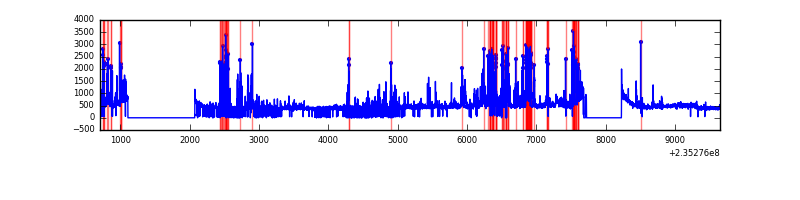 |
Top three noisy pixels from each quadrant. If the there are fewer than three noisy pixels in the level2.evt file, extra rows are filled as -1
| Pixel properties | Quadrant properties | ||||||
|---|---|---|---|---|---|---|---|
| Quadrant | DetID | PixID | Counts | Sigma | Mean | Median | Sigma |
| A | 8 | 5 | 1536786 | 9297.74 | 814 | 794 | 165.2 |
| A | 13 | 251 | 36538 | 216.37 | 814 | 794 | 165.2 |
| A | 4 | 2 | 35841 | 212.15 | 814 | 794 | 165.2 |
| B | 8 | 234 | 95163 | 597.55 | 834 | 813 | 157.9 |
| B | 0 | 214 | 57884 | 361.45 | 834 | 813 | 157.9 |
| B | 0 | 245 | 33383 | 206.28 | 834 | 813 | 157.9 |
| C | 10 | 22 | 23706 | 121.11 | 817 | 820 | 189.0 |
| C | 14 | 67 | 14264 | 71.14 | 817 | 820 | 189.0 |
| C | 13 | 61 | 6356 | 29.3 | 817 | 820 | 189.0 |
| D | 7 | 71 | 396072 | 1994.69 | 789 | 766 | 198.2 |
| D | 12 | 233 | 312654 | 1573.77 | 789 | 766 | 198.2 |
| D | 1 | 52 | 229630 | 1154.83 | 789 | 766 | 198.2 |
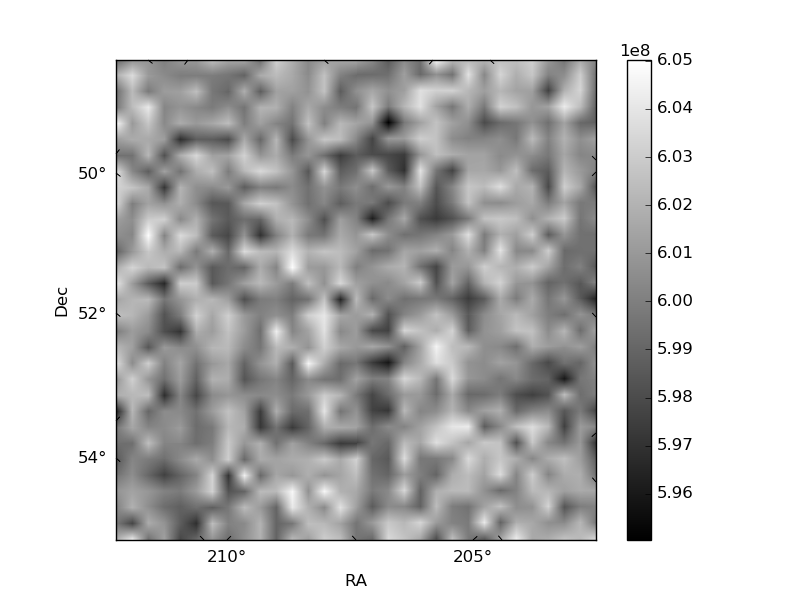
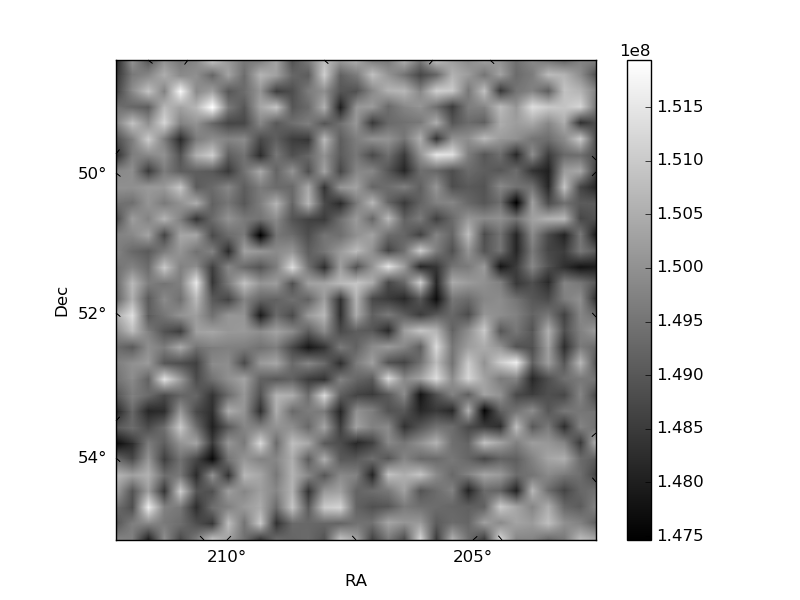
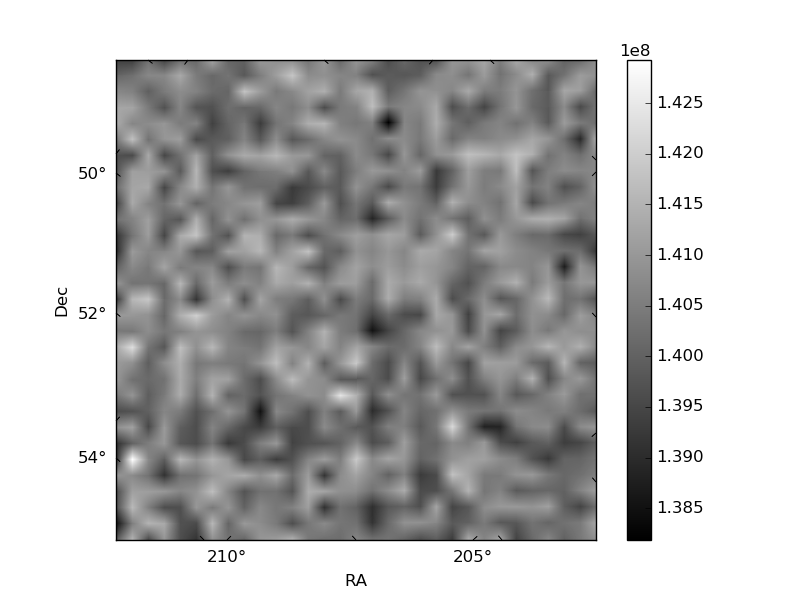
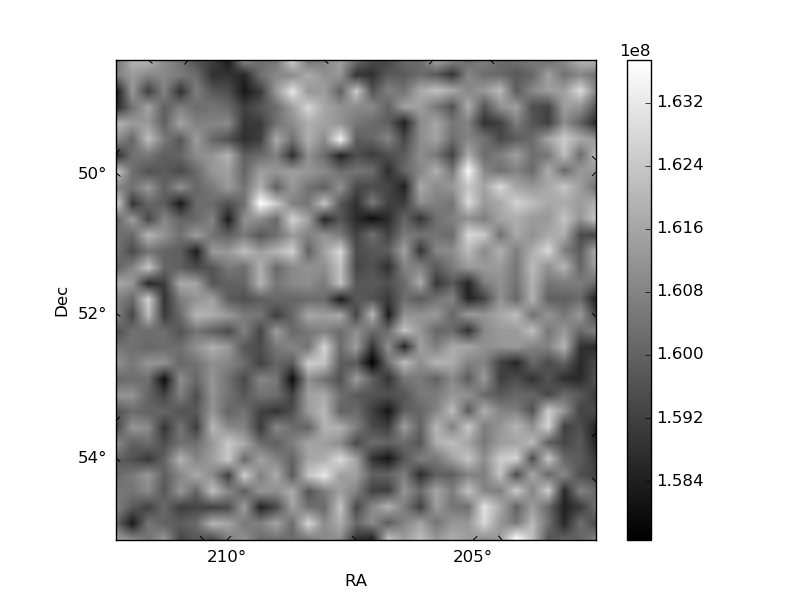
Histogram calculated using DETX and DETY for each event in the final _common_clean file
| Quadrant A | 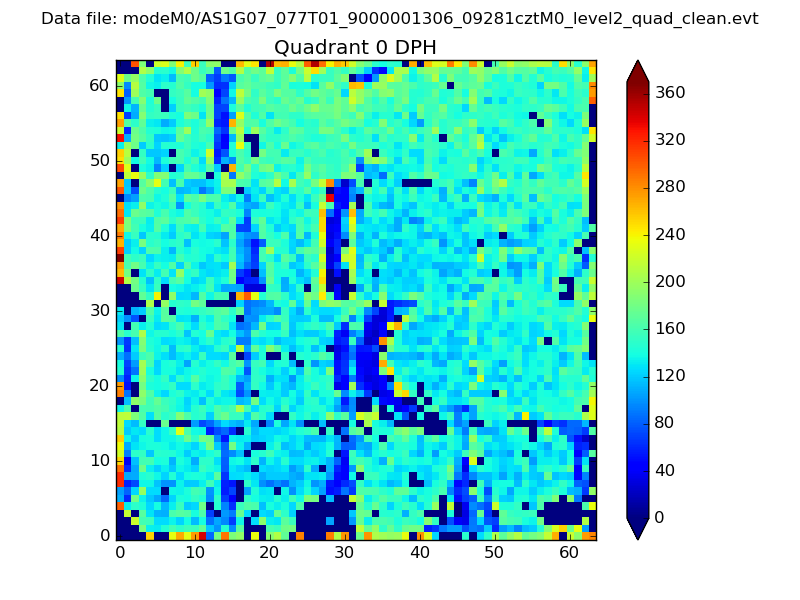 |
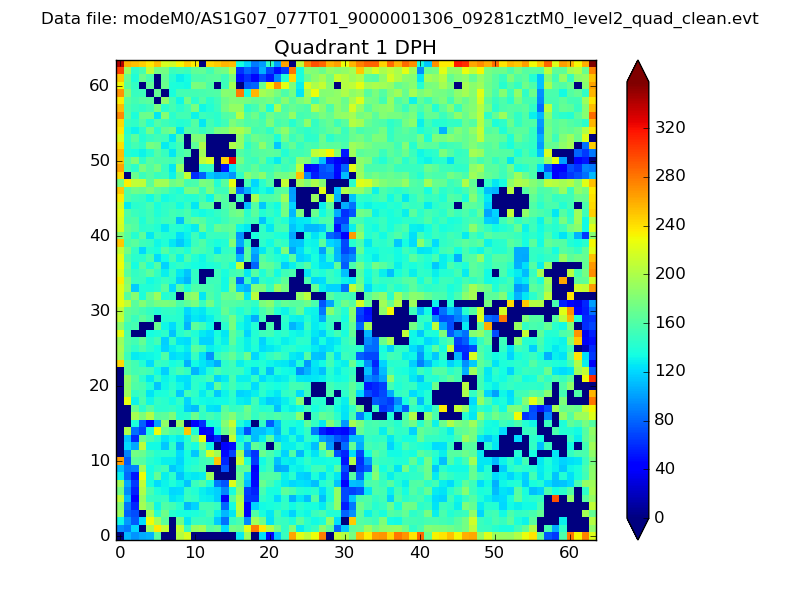 |
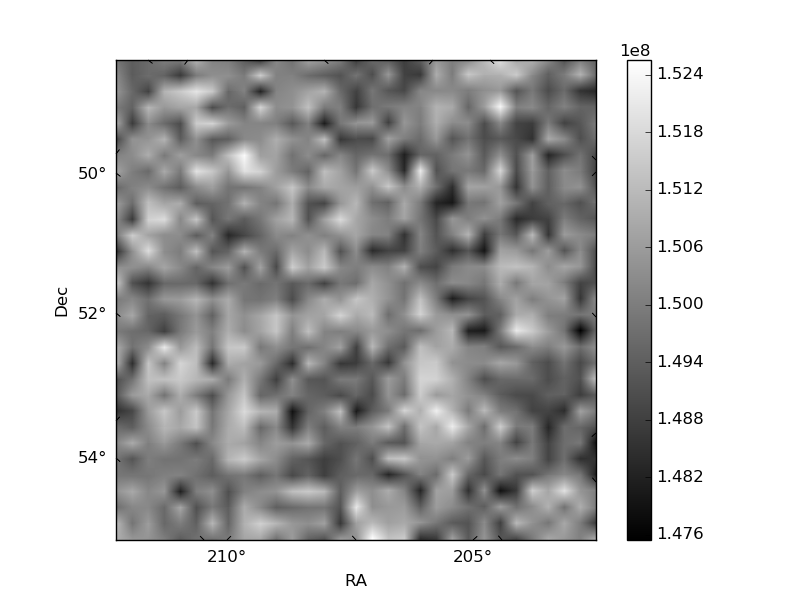
Quadrant B |
|---|---|---|---|
| Quadrant D | 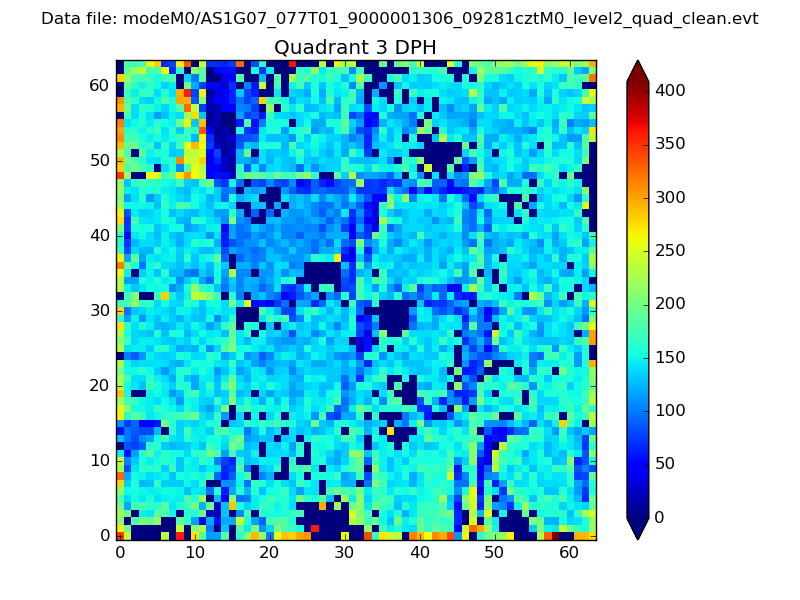 |
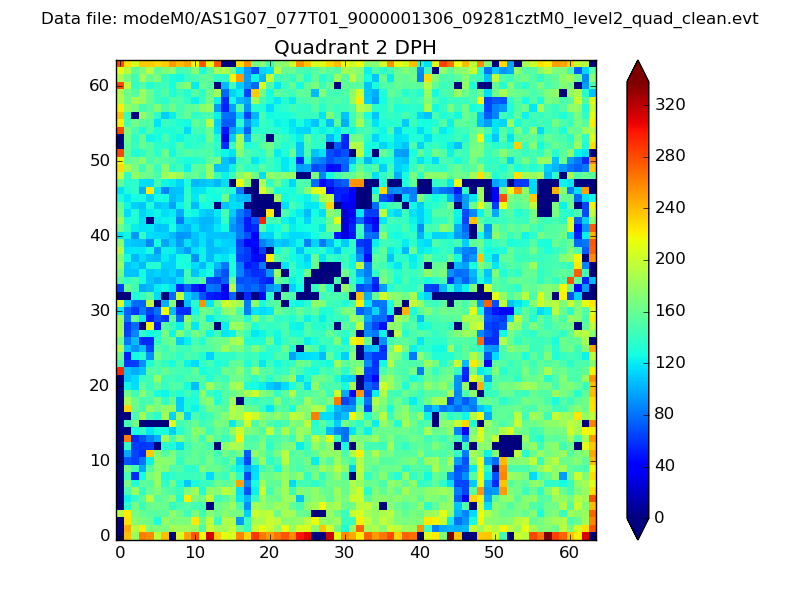 |
Quadrant C |
| Plot type | Count rate plots | Images |
|---|---|---|
| Comparison with Poisson distribution Blue bars denote a histogram of data divided into 1 sec bins. Red curve is a Poisson curve with rate = median count rate of data. |
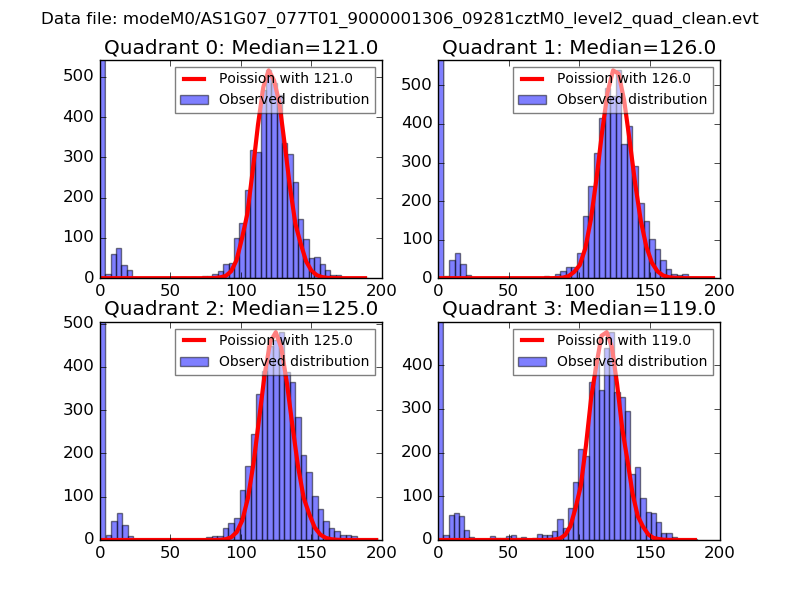 |
 |
| Quadrant-wise count rates Data is divided into 100 sec bins |
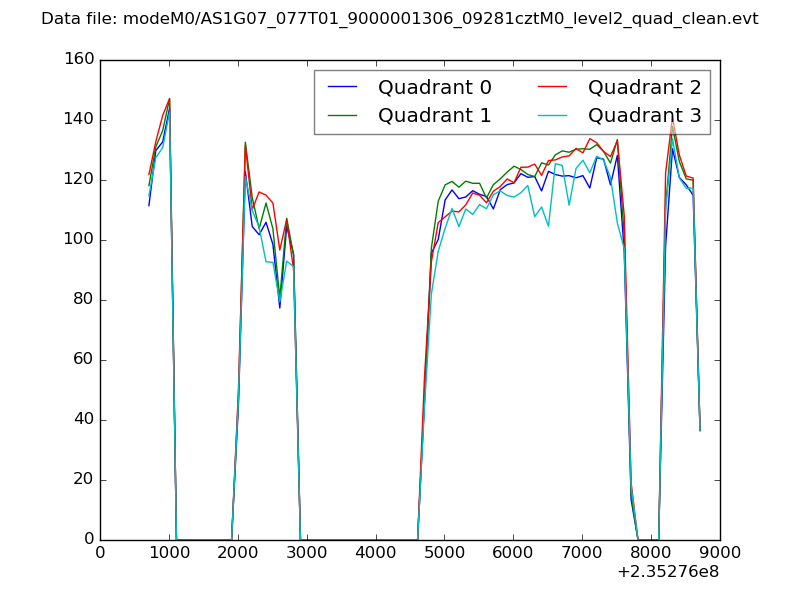 |
|
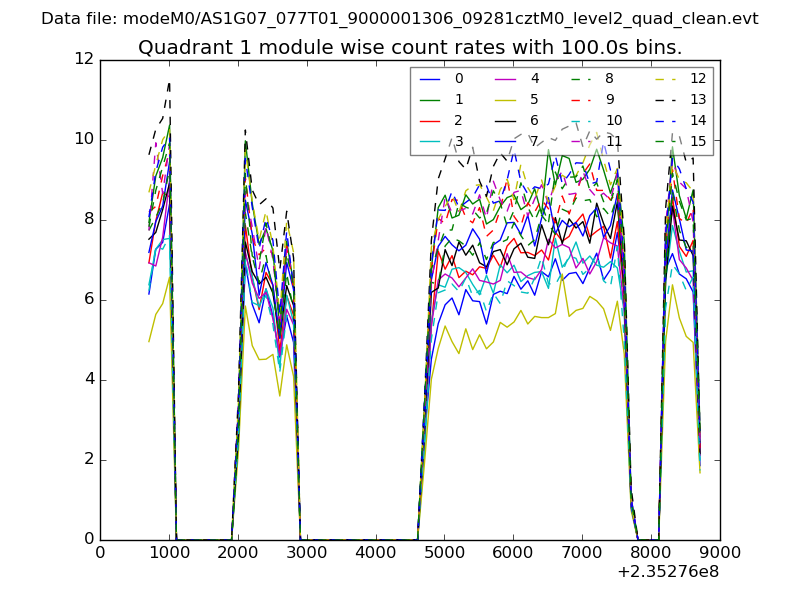
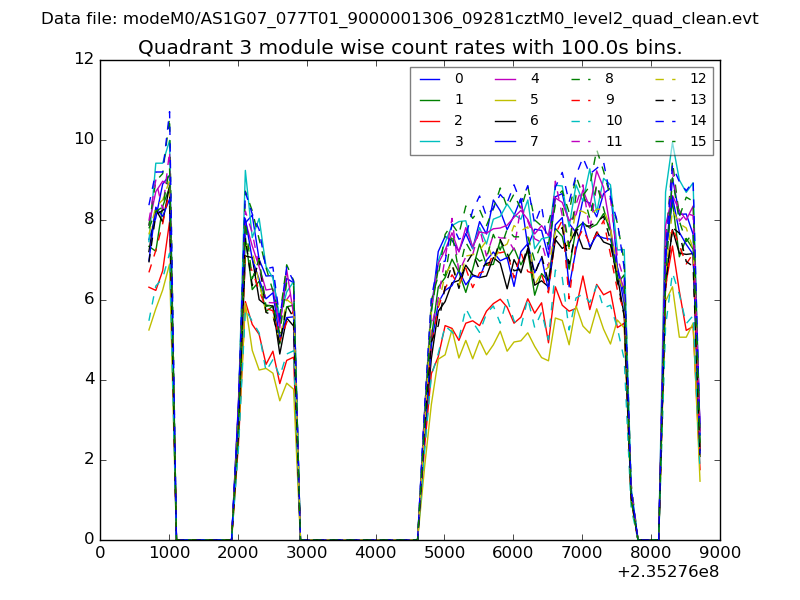
| Module-wise count rates for Quadrant A Data is divided into 100 sec bins |
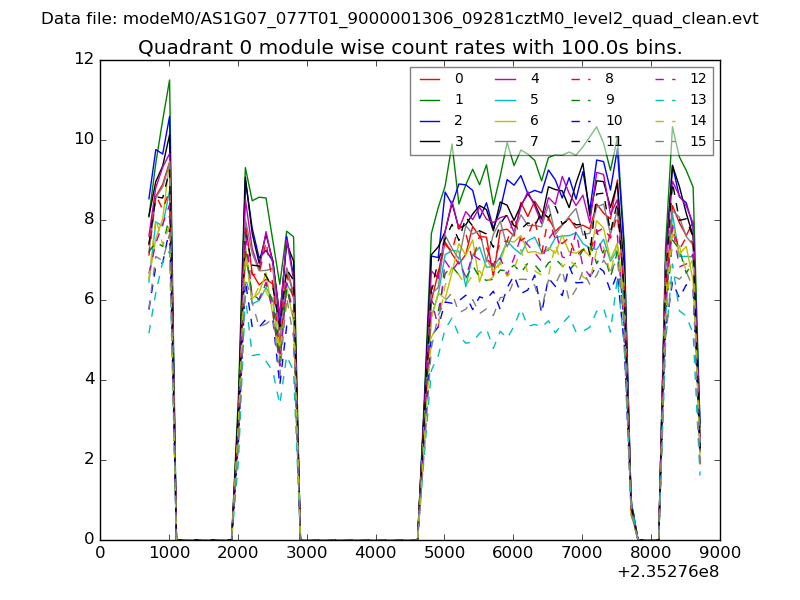 |
 |
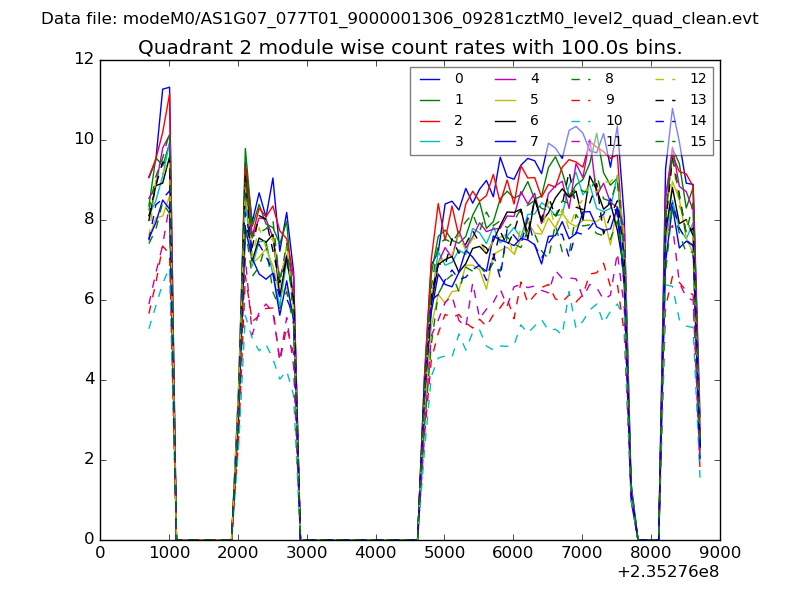
| Module-wise count rates for Quadrant B Data is divided into 100 sec bins |
 |
 |
| Module-wise count rates for Quadrant C Data is divided into 100 sec bins |
 |
 |
| Module-wise count rates for Quadrant D Data is divided into 100 sec bins |
 |
 |
| Parameter | Plot |
|---|---|
| CZT HV Monitor | 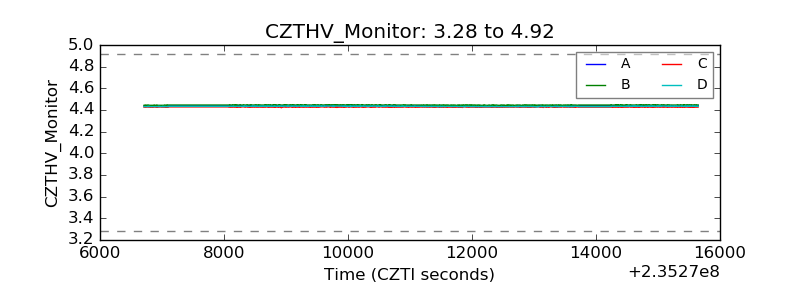 |
| D_VDD | 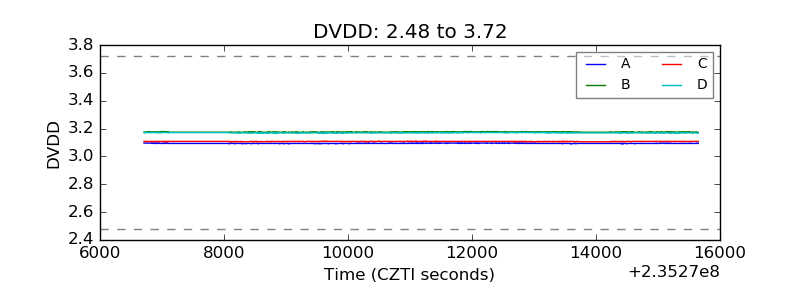 |
| Temperature 1 | 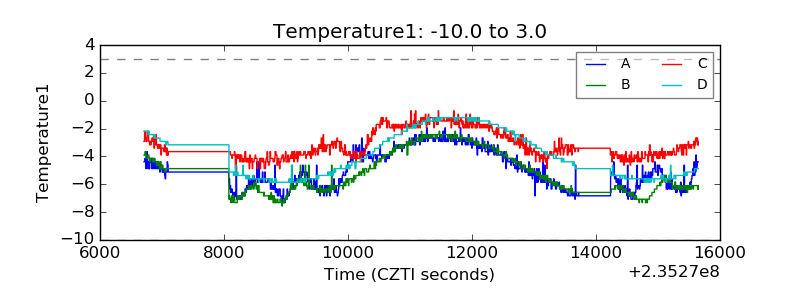 |
| Veto HV Monitor |  |
| Veto LLD | 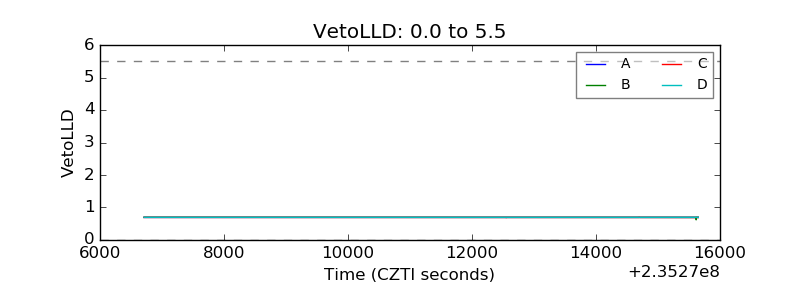 |
| Alpha Counter | 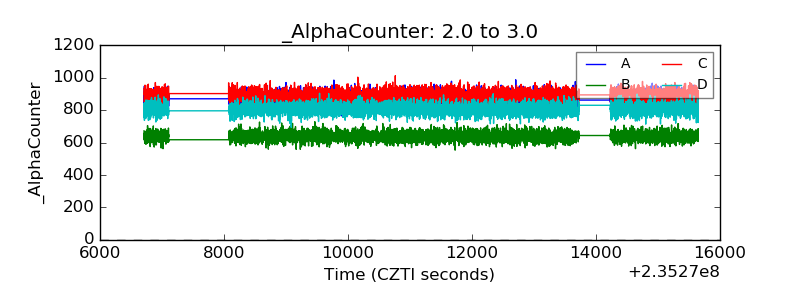 |
| _CPM_Rate | 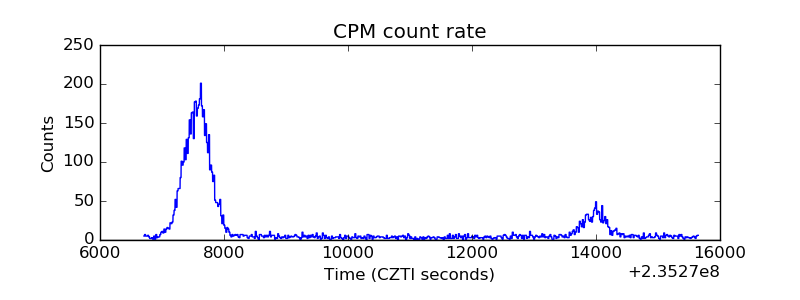 |
| CZT Counter | 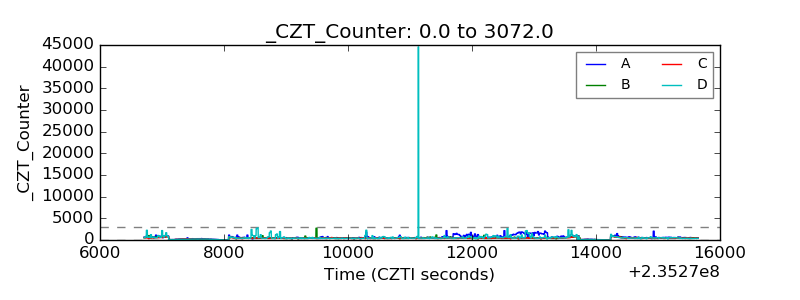 |
| +2.5 Volts monitor |  |
| +5 Volts monitor |  |
| _ROLL_ROT | 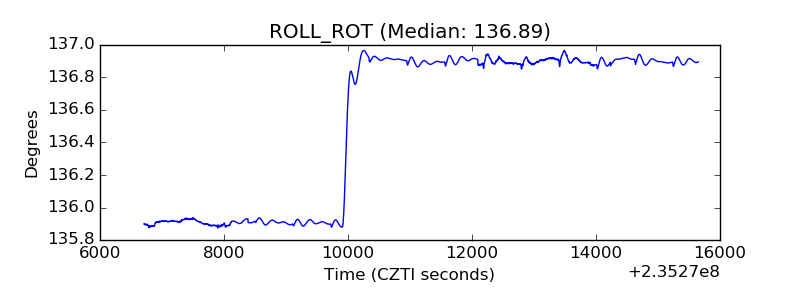 |
| _Roll_DEC | 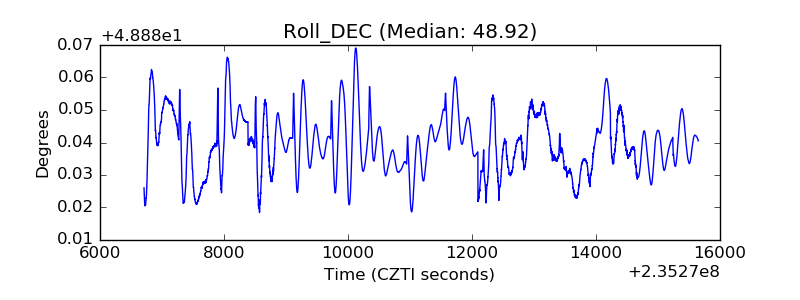 |
| _Roll_RA | 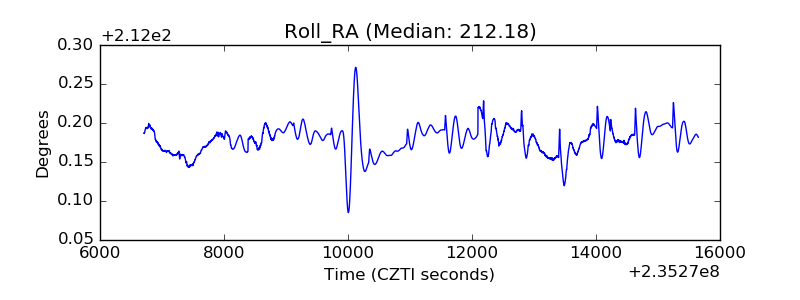 |
| Veto Counter | 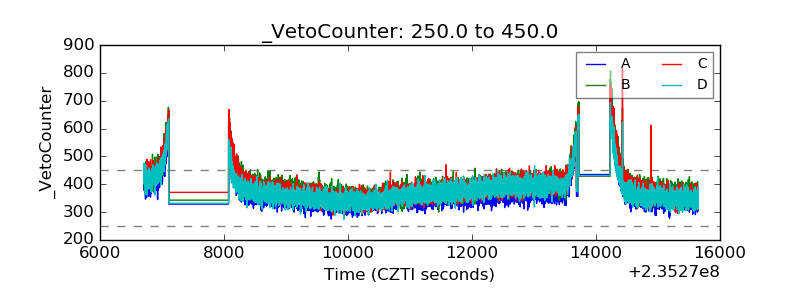 |