| Param | Original file | Final file |
|---|---|---|
| Filename | modeM0/AS1G07_077T01_9000001306_09282cztM0_level2.evt | modeM0/AS1G07_077T01_9000001306_09282cztM0_level2_quad_clean.evt |
| Size (bytes) | 547,447,680 | 88,608,960 |
| Size | 522.1 MB | 84.5 MB |
| Events in quadrant A | 4,730,835 | 529,472 |
| Events in quadrant B | 3,718,058 | 545,987 |
| Events in quadrant C | 3,543,211 | 547,416 |
| Events in quadrant D | 4,060,718 | 521,049 |
| Mode M0 | |||
|---|---|---|---|
| Quadrant | BADHDUFLAG | Total packets | Discarded packets |
| A | 0 | 20188 | 1018 |
| B | 0 | 17030 | 729 |
| C | 0 | 16768 | 674 |
| D | 0 | 18254 | 994 |
| Mode SS | |||
|---|---|---|---|
| Quadrant | BADHDUFLAG | Total packets | Discarded packets |
| A | 0 | 168 | 2 |
| B | 0 | 168 | 4 |
| C | 0 | 167 | 9 |
| D | 0 | 168 | 6 |
| Mode M9 | |||
|---|---|---|---|
| Quadrant | BADHDUFLAG | Total packets | Discarded packets |
| A | 0 | 7 | 0 |
| B | 0 | 7 | 1 |
| C | 0 | 7 | 1 |
| D | 0 | 7 | 0 |
| Quadrant | Total seconds | Saturated seconds | Saturation percentage |
|---|---|---|---|
| A | 7708 | 339 | 4.398028% |
| B | 7758 | 326 | 4.202114% |
| C | 7769 | 217 | 2.793152% |
| D | 7716 | 299 | 3.875065% |
Noise dominated data is calculated using 1-second bins in cleaned event files. If a bin has >2000 counts, and if more than 50% of those come from <1% of pixels, then it is considered to be noise-dominated and hence unusable.
| Quadrant | # 1 sec bins | Bins with >0 counts | Bins with >2000 counts | High rate bins dominated by noise | Noise dominated (total time) | Noise dominated (detector-on time) | Marked lightcurve |
|---|---|---|---|---|---|---|---|
| A | 8743 | 7958 | 1 | 1 | 0.01% | 0.01% | 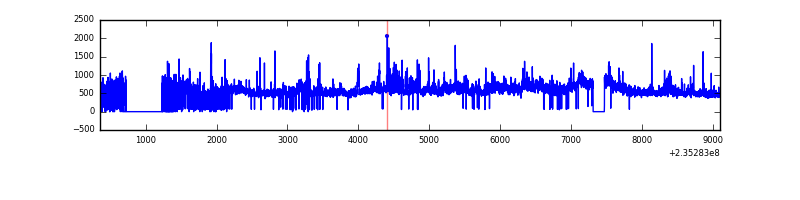 |
| B | 8744 | 7990 | 1 | 1 | 0.01% | 0.01% | 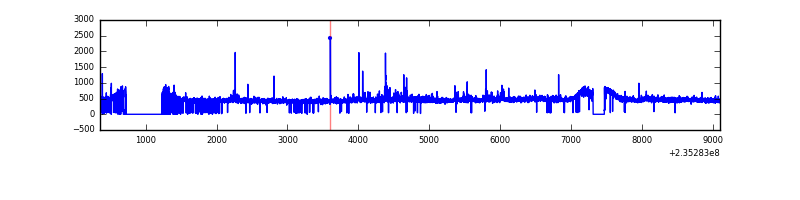 |
| C | 8744 | 7994 | 0 | 0 | 0.00% | 0.00% | 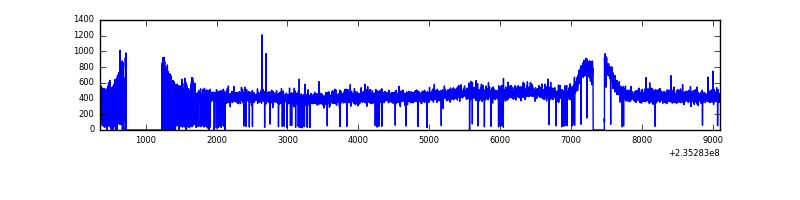 |
| D | 8744 | 7965 | 60 | 60 | 0.69% | 0.75% | 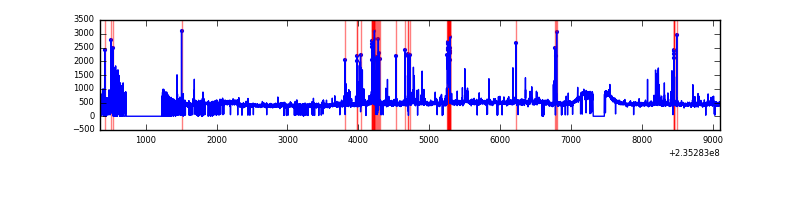 |
Top three noisy pixels from each quadrant. If the there are fewer than three noisy pixels in the level2.evt file, extra rows are filled as -1
| Pixel properties | Quadrant properties | ||||||
|---|---|---|---|---|---|---|---|
| Quadrant | DetID | PixID | Counts | Sigma | Mean | Median | Sigma |
| A | 8 | 5 | 1153515 | 6190.16 | 902 | 878 | 186.2 |
| A | 1 | 162 | 40050 | 210.37 | 902 | 878 | 186.2 |
| A | 13 | 251 | 32359 | 169.07 | 902 | 878 | 186.2 |
| B | 0 | 214 | 50659 | 280.05 | 919 | 894 | 177.7 |
| B | 0 | 219 | 36317 | 199.34 | 919 | 894 | 177.7 |
| B | 8 | 234 | 23510 | 127.27 | 919 | 894 | 177.7 |
| C | 14 | 67 | 11466 | 50.71 | 900 | 902 | 208.3 |
| C | 10 | 22 | 10958 | 48.28 | 900 | 902 | 208.3 |
| C | 13 | 61 | 7033 | 29.43 | 900 | 902 | 208.3 |
| D | 1 | 52 | 284396 | 1296.92 | 879 | 852 | 218.6 |
| D | 12 | 233 | 139597 | 634.61 | 879 | 852 | 218.6 |
| D | 7 | 71 | 128978 | 586.04 | 879 | 852 | 218.6 |
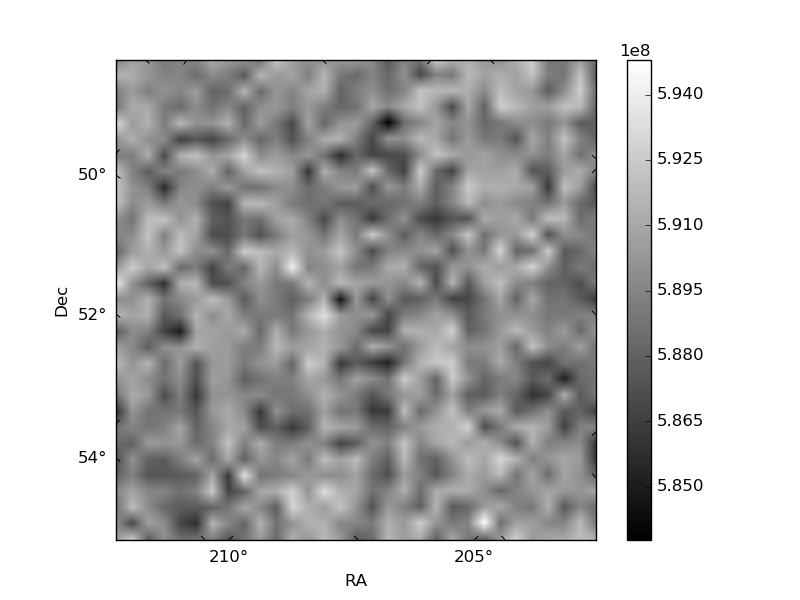
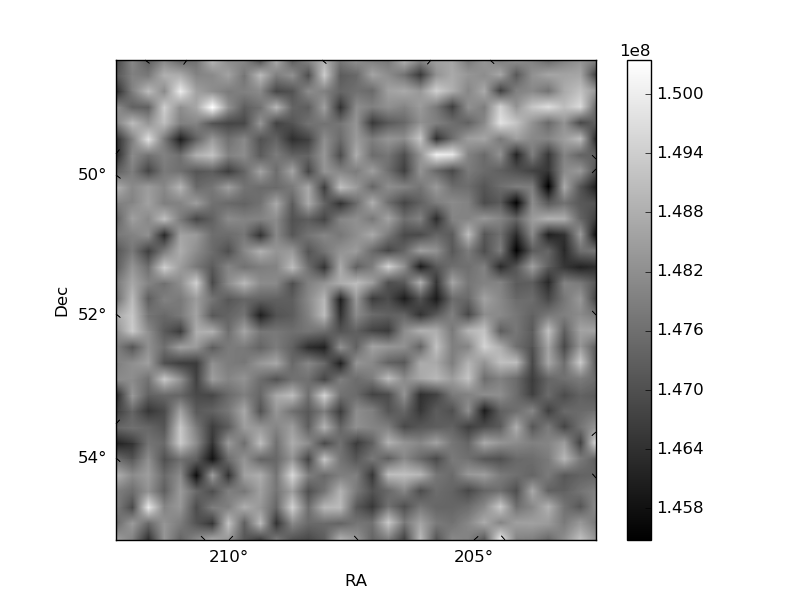
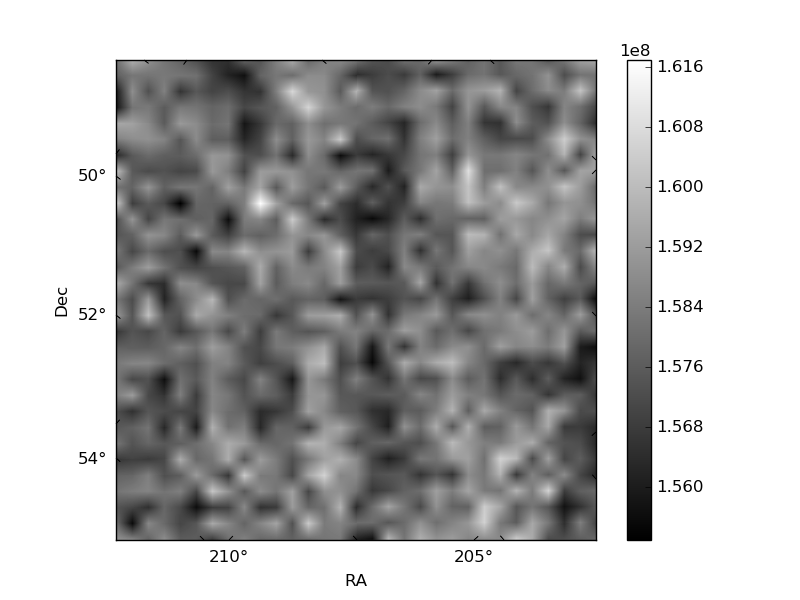
Histogram calculated using DETX and DETY for each event in the final _common_clean file
| Quadrant A | 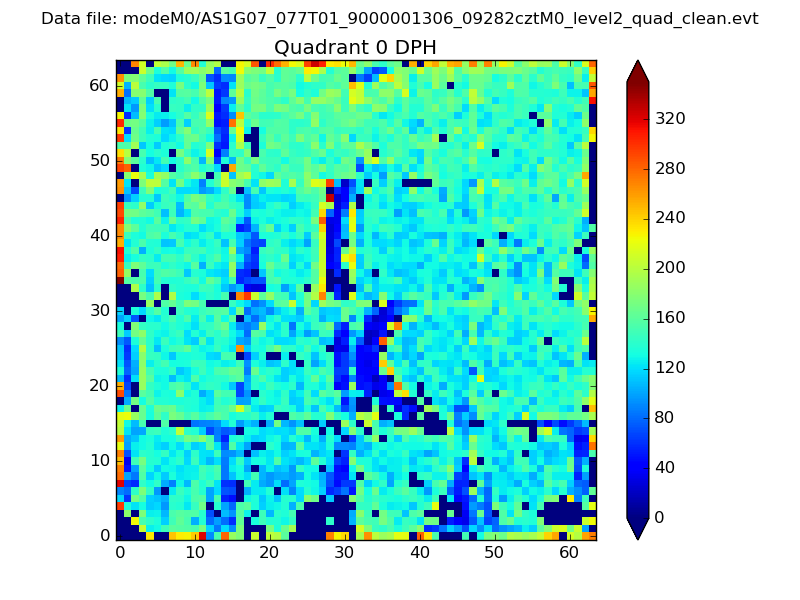 |
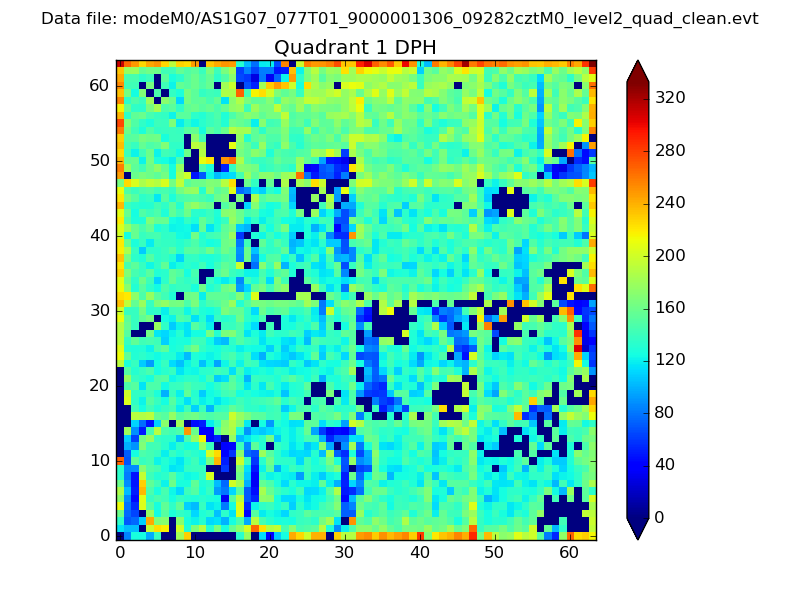 |
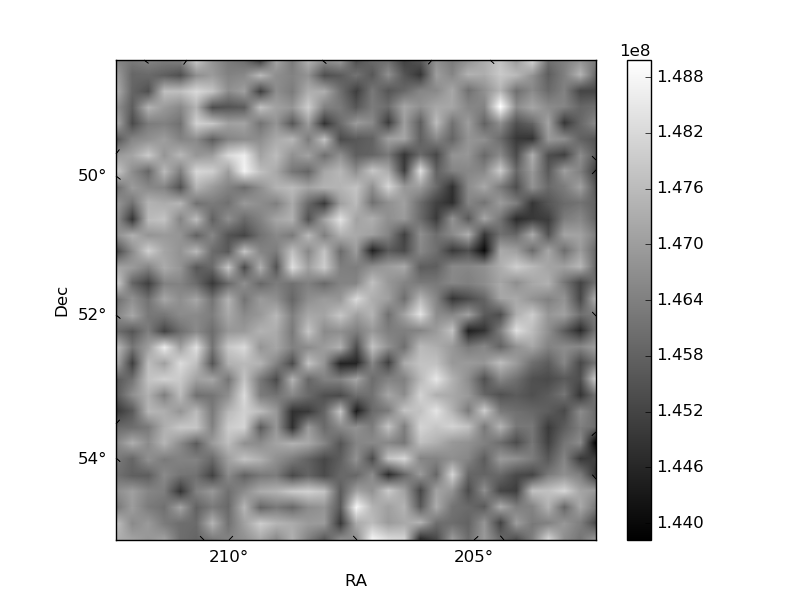
Quadrant B |
|---|---|---|---|
| Quadrant D | 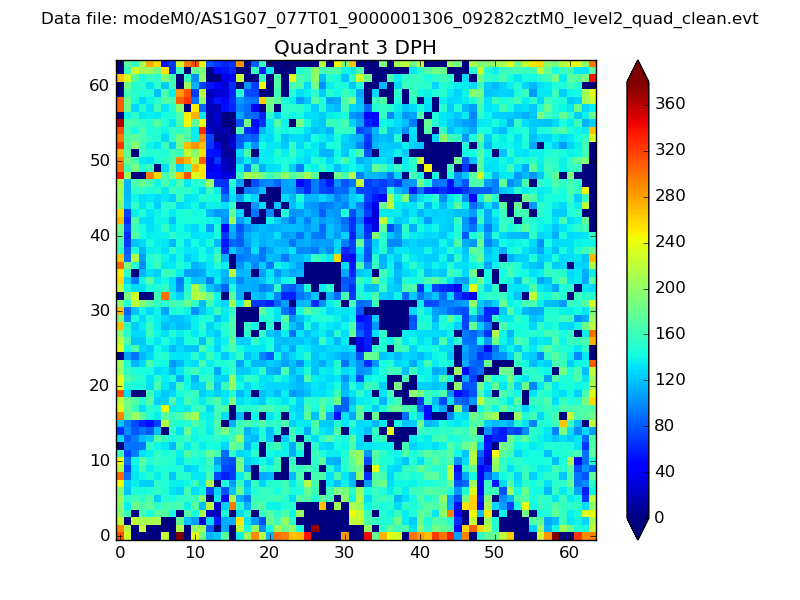 |
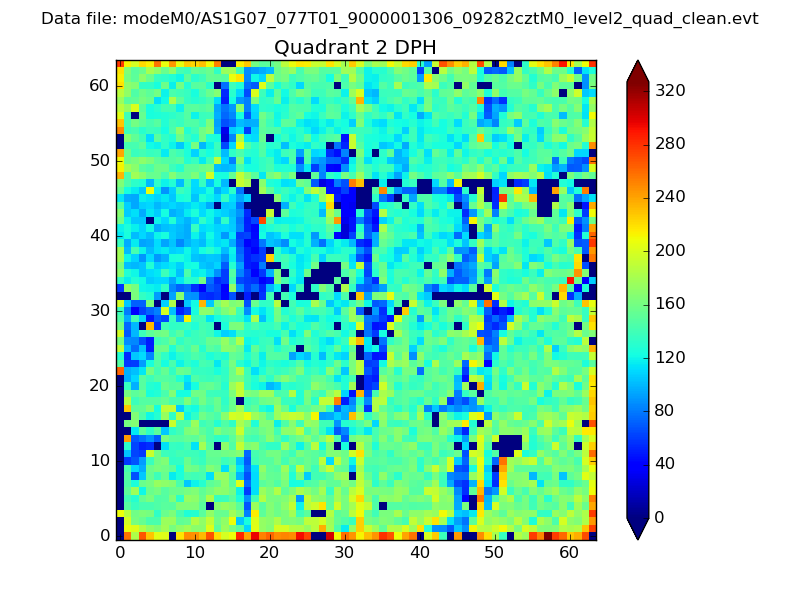 |
Quadrant C |
| Plot type | Count rate plots | Images |
|---|---|---|
| Comparison with Poisson distribution Blue bars denote a histogram of data divided into 1 sec bins. Red curve is a Poisson curve with rate = median count rate of data. |
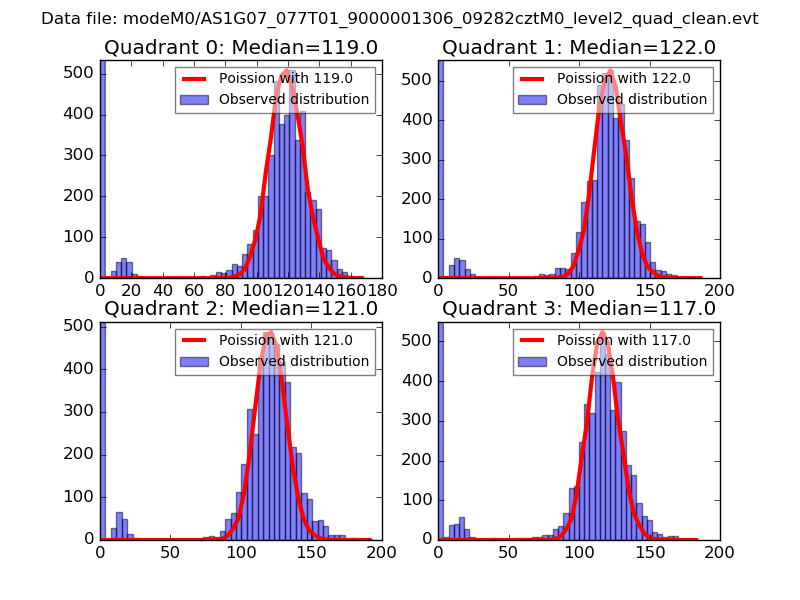 |
 |
| Quadrant-wise count rates Data is divided into 100 sec bins |
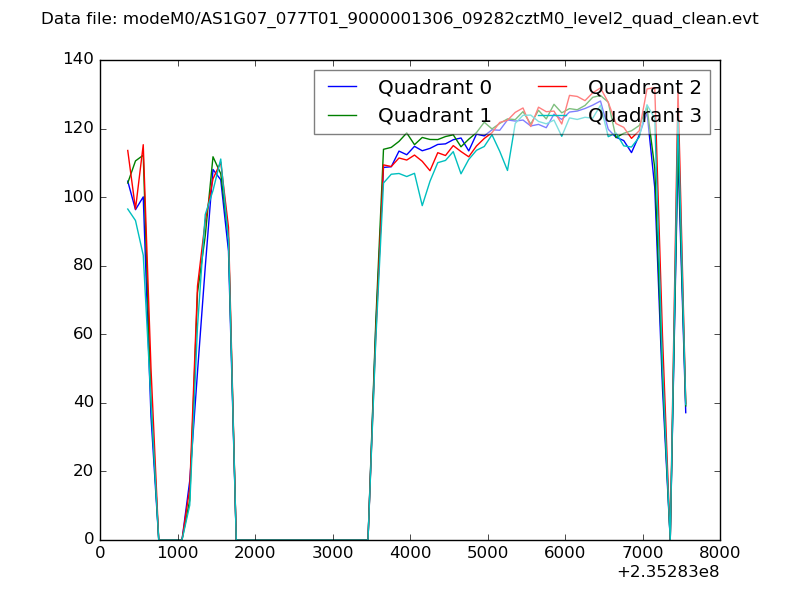 |
|
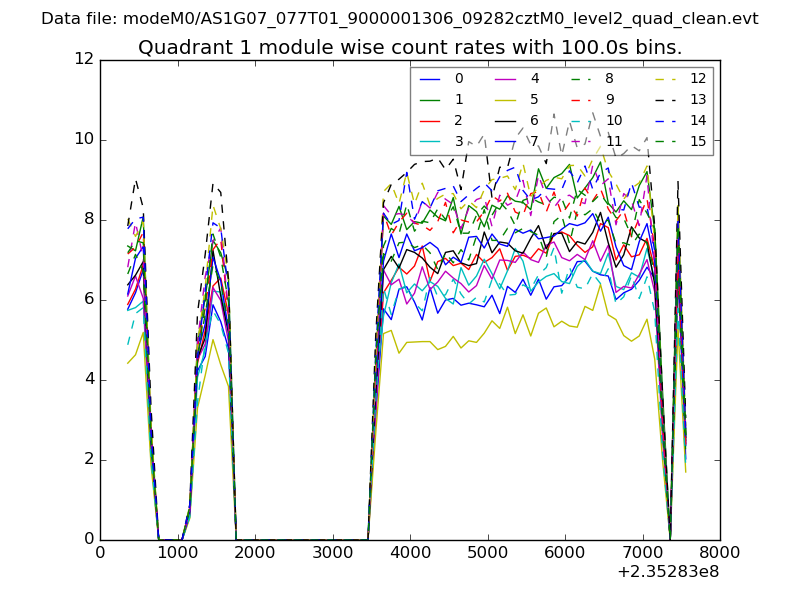
| Module-wise count rates for Quadrant A Data is divided into 100 sec bins |
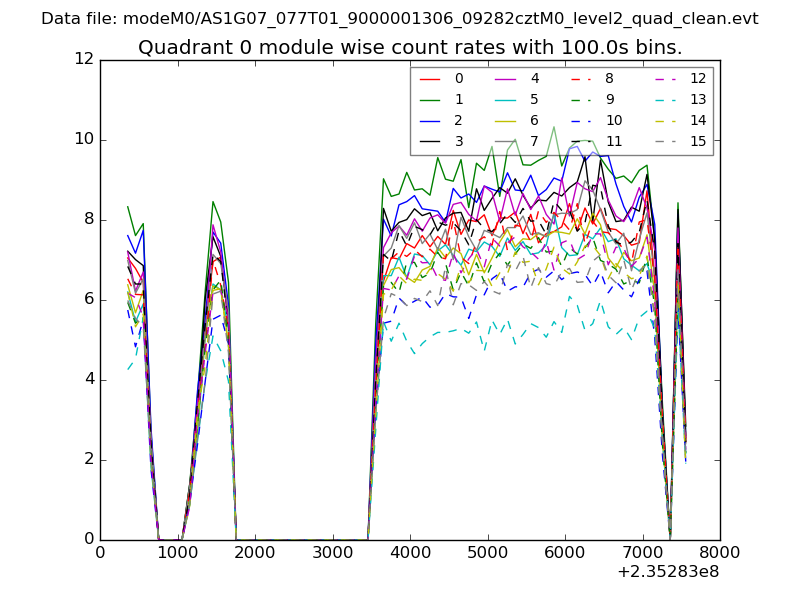 |
 |
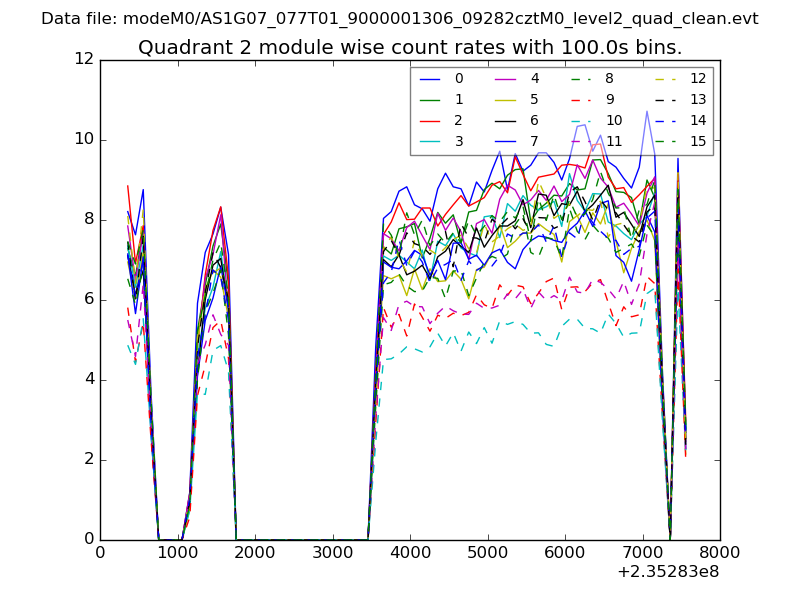
| Module-wise count rates for Quadrant B Data is divided into 100 sec bins |
 |
 |
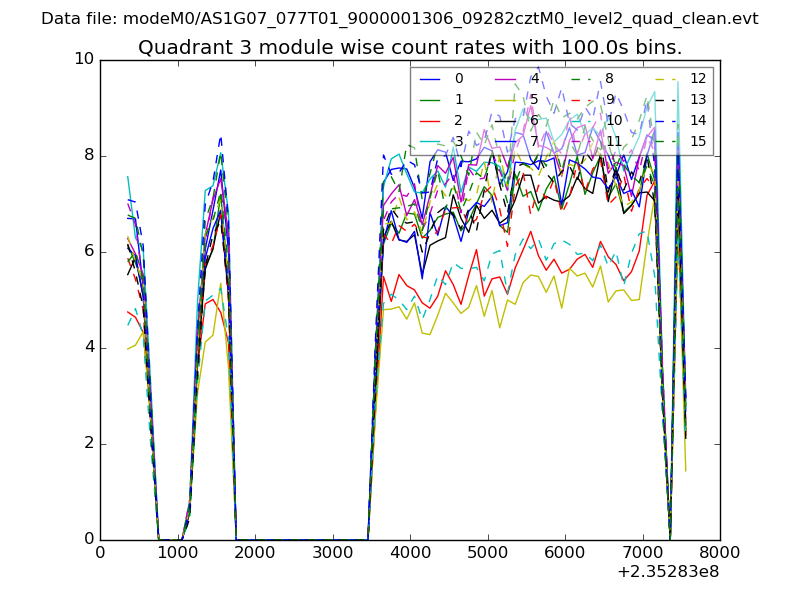
| Module-wise count rates for Quadrant C Data is divided into 100 sec bins |
 |
 |
| Module-wise count rates for Quadrant D Data is divided into 100 sec bins |
 |
 |
| Parameter | Plot |
|---|---|
| CZT HV Monitor | 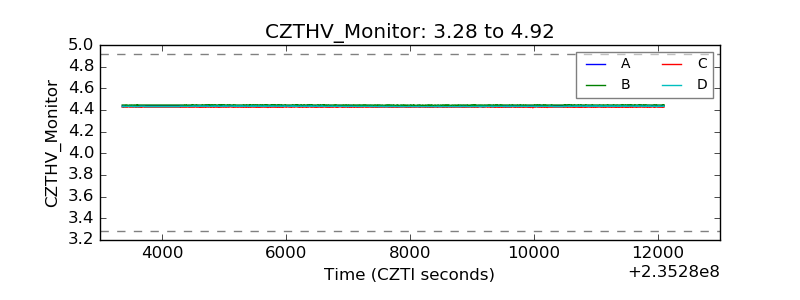 |
| D_VDD | 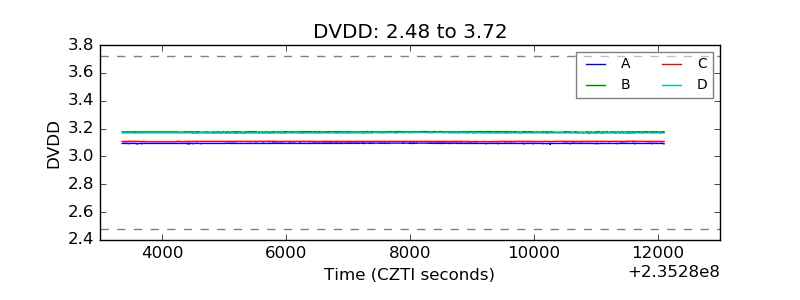 |
| Temperature 1 | 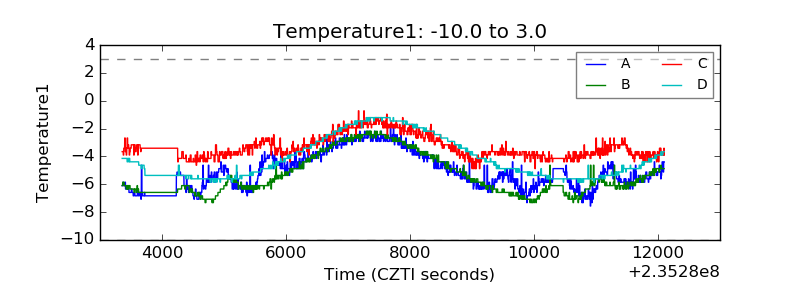 |
| Veto HV Monitor | 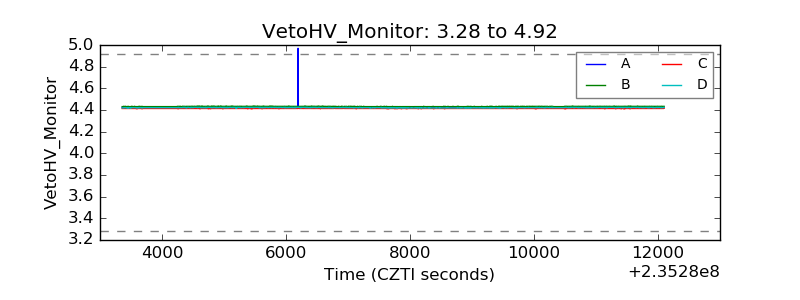 |
| Veto LLD | 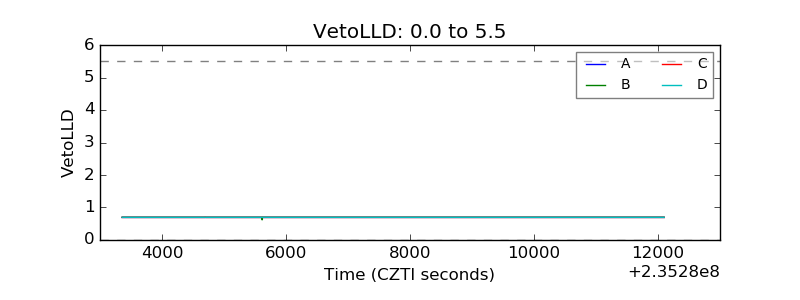 |
| Alpha Counter | 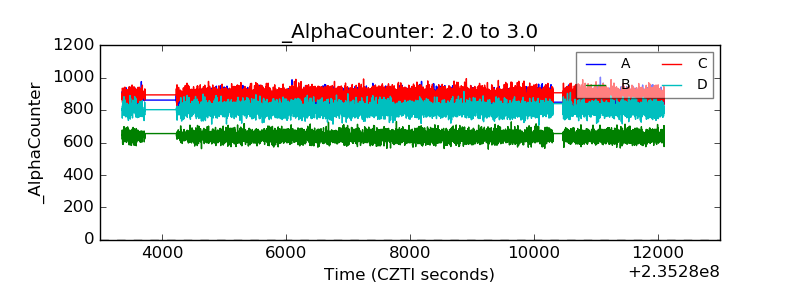 |
| _CPM_Rate | 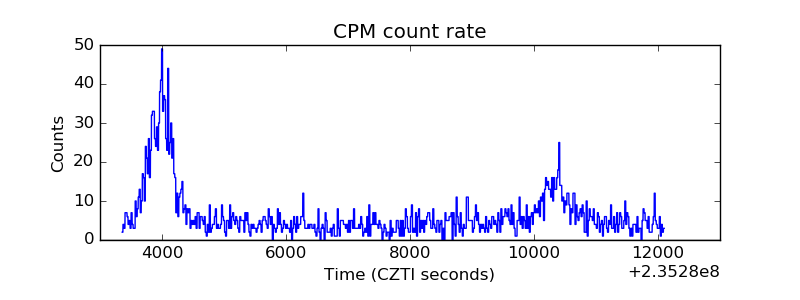 |
| CZT Counter | 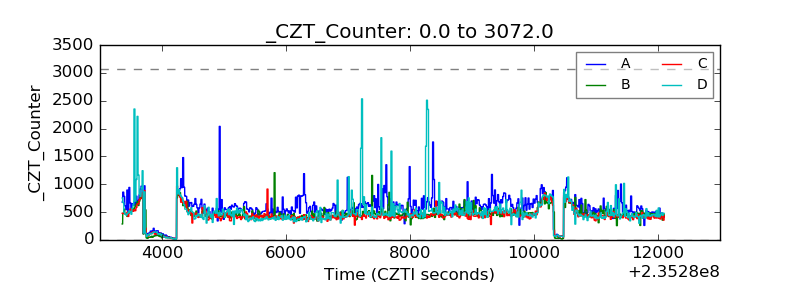 |
| +2.5 Volts monitor |  |
| +5 Volts monitor |  |
| _ROLL_ROT | 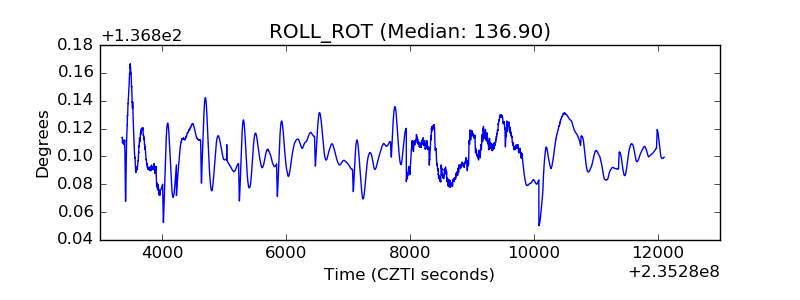 |
| _Roll_DEC |  |
| _Roll_RA | 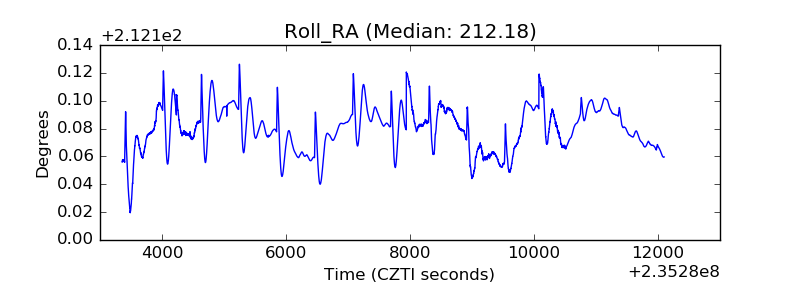 |
| Veto Counter |  |