| Param | Original file | Final file |
|---|---|---|
| Filename | modeM0/AS1G07_077T01_9000001306_09283cztM0_level2.evt | modeM0/AS1G07_077T01_9000001306_09283cztM0_level2_quad_clean.evt |
| Size (bytes) | 816,494,400 | 125,035,200 |
| Size | 778.7 MB | 119.2 MB |
| Events in quadrant A | 6,746,069 | 727,084 |
| Events in quadrant B | 5,335,565 | 774,958 |
| Events in quadrant C | 5,090,472 | 781,882 |
| Events in quadrant D | 6,791,599 | 723,114 |
| Mode M0 | |||
|---|---|---|---|
| Quadrant | BADHDUFLAG | Total packets | Discarded packets |
| A | 0 | 31854 | 4916 |
| B | 0 | 27083 | 3628 |
| C | 0 | 26694 | 3380 |
| D | 0 | 32553 | 4861 |
| Mode SS | |||
|---|---|---|---|
| Quadrant | BADHDUFLAG | Total packets | Discarded packets |
| A | 0 | 268 | 40 |
| B | 0 | 268 | 32 |
| C | 0 | 268 | 36 |
| D | 0 | 268 | 24 |
| Mode M9 | |||
|---|---|---|---|
| Quadrant | BADHDUFLAG | Total packets | Discarded packets |
| A | 0 | 3 | 0 |
| B | 0 | 3 | 0 |
| C | 0 | 3 | 0 |
| D | 0 | 3 | 0 |
| Quadrant | Total seconds | Saturated seconds | Saturation percentage |
|---|---|---|---|
| A | 11085 | 569 | 5.133063% |
| B | 11269 | 406 | 3.602804% |
| C | 11345 | 291 | 2.565007% |
| D | 11166 | 707 | 6.331721% |
Noise dominated data is calculated using 1-second bins in cleaned event files. If a bin has >2000 counts, and if more than 50% of those come from <1% of pixels, then it is considered to be noise-dominated and hence unusable.
| Quadrant | # 1 sec bins | Bins with >0 counts | Bins with >2000 counts | High rate bins dominated by noise | Noise dominated (total time) | Noise dominated (detector-on time) | Marked lightcurve |
|---|---|---|---|---|---|---|---|
| A | 13459 | 12056 | 136 | 136 | 1.01% | 1.13% | 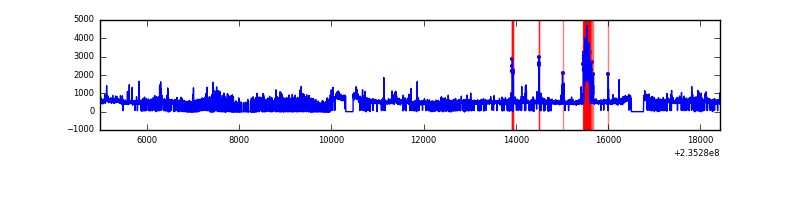 |
| B | 13459 | 12235 | 1 | 1 | 0.01% | 0.01% | 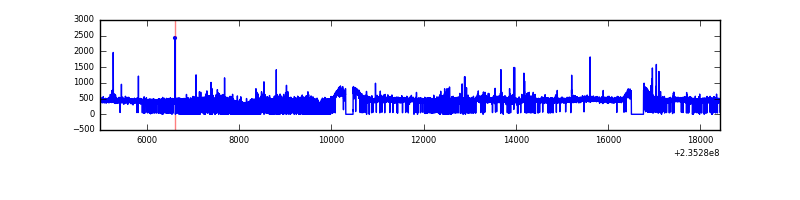 |
| C | 13459 | 12255 | 0 | 0 | 0.00% | 0.00% | 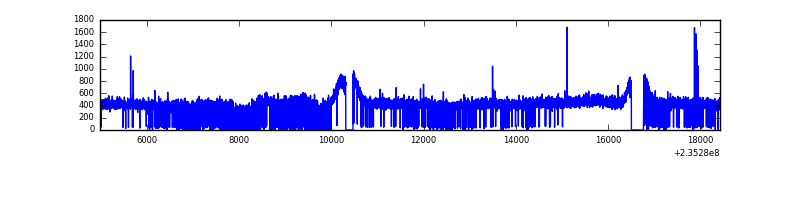 |
| D | 13459 | 12093 | 352 | 352 | 2.62% | 2.91% | 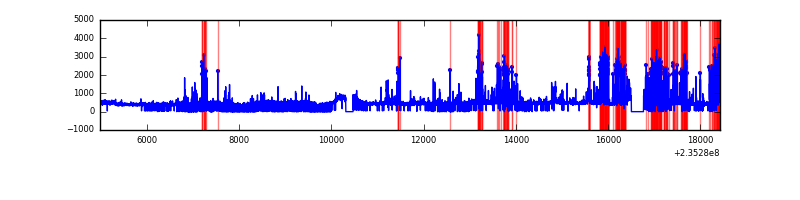 |
Top three noisy pixels from each quadrant. If the there are fewer than three noisy pixels in the level2.evt file, extra rows are filled as -1
| Pixel properties | Quadrant properties | ||||||
|---|---|---|---|---|---|---|---|
| Quadrant | DetID | PixID | Counts | Sigma | Mean | Median | Sigma |
| A | 8 | 5 | 1179802 | 4555.87 | 1274 | 1244 | 258.7 |
| A | 4 | 2 | 417073 | 1607.44 | 1274 | 1244 | 258.7 |
| A | 1 | 162 | 82574 | 314.39 | 1274 | 1244 | 258.7 |
| B | 0 | 219 | 68808 | 266.21 | 1317 | 1279 | 253.7 |
| B | 0 | 214 | 66122 | 255.62 | 1317 | 1279 | 253.7 |
| B | 8 | 234 | 40034 | 152.78 | 1317 | 1279 | 253.7 |
| C | 14 | 234 | 15253 | 46.57 | 1296 | 1297 | 299.7 |
| C | 14 | 67 | 11132 | 32.82 | 1296 | 1297 | 299.7 |
| C | 8 | 222 | 10739 | 31.51 | 1296 | 1297 | 299.7 |
| D | 1 | 52 | 1307211 | 4289.22 | 1243 | 1206 | 304.5 |
| D | 12 | 233 | 497607 | 1630.3 | 1243 | 1206 | 304.5 |
| D | 7 | 71 | 66121 | 213.2 | 1243 | 1206 | 304.5 |
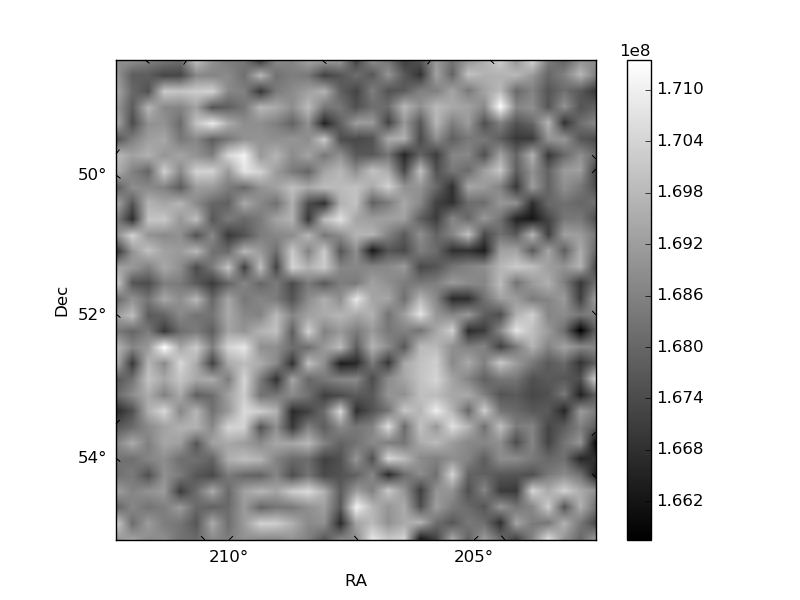
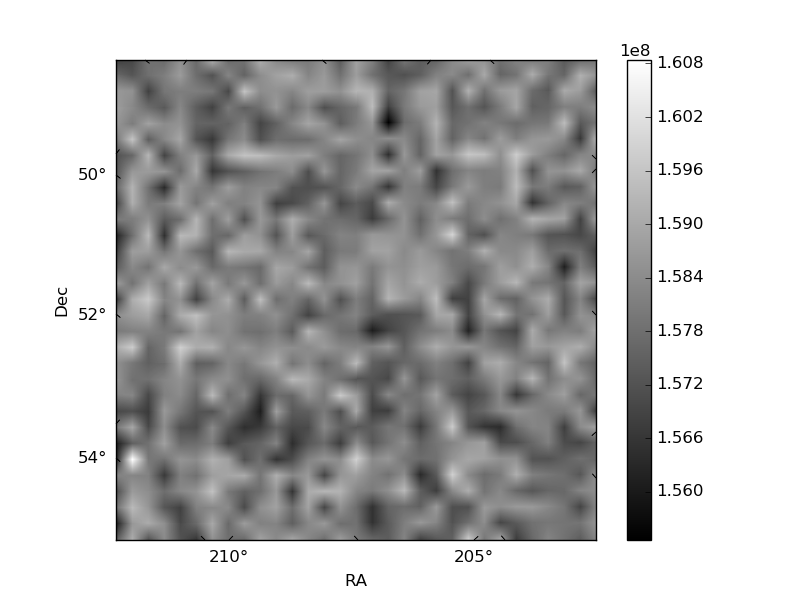
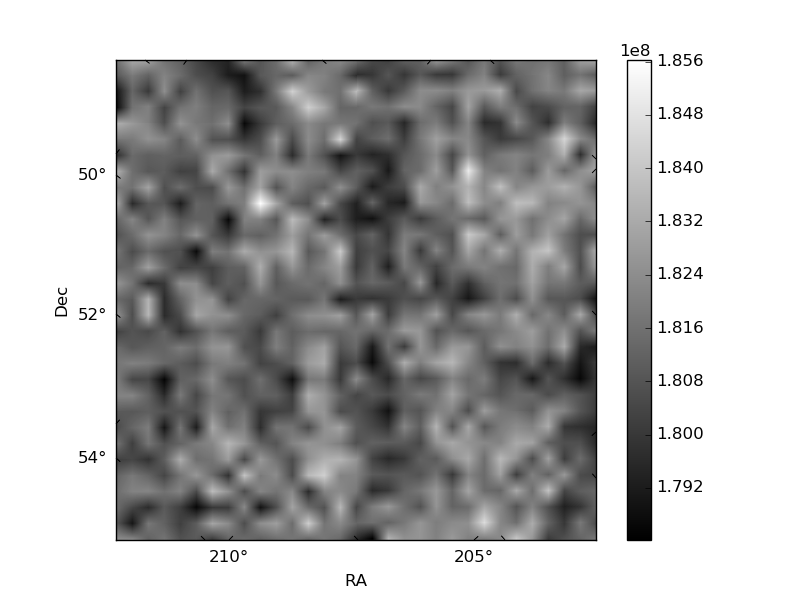
Histogram calculated using DETX and DETY for each event in the final _common_clean file
| Quadrant A | 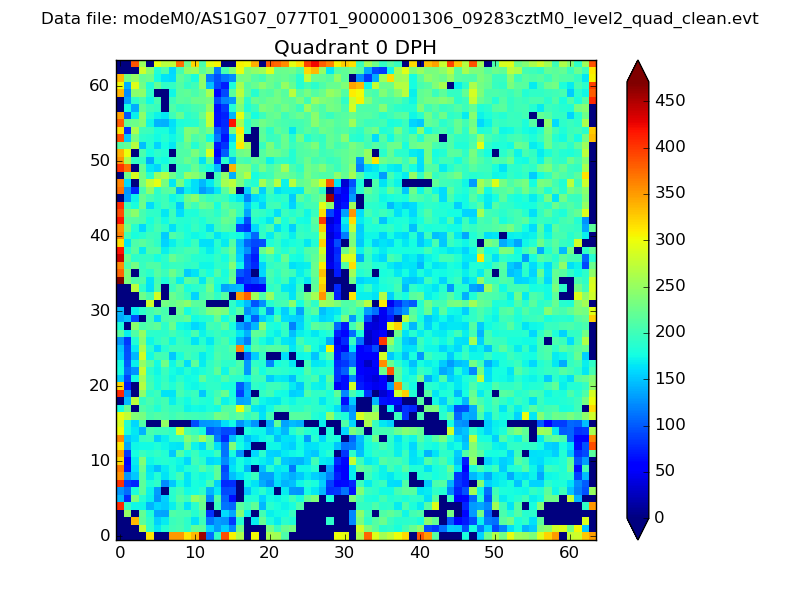 |
 |
Quadrant B |
|---|---|---|---|
| Quadrant D |  |
 |
Quadrant C |
| Plot type | Count rate plots | Images |
|---|---|---|
| Comparison with Poisson distribution Blue bars denote a histogram of data divided into 1 sec bins. Red curve is a Poisson curve with rate = median count rate of data. |
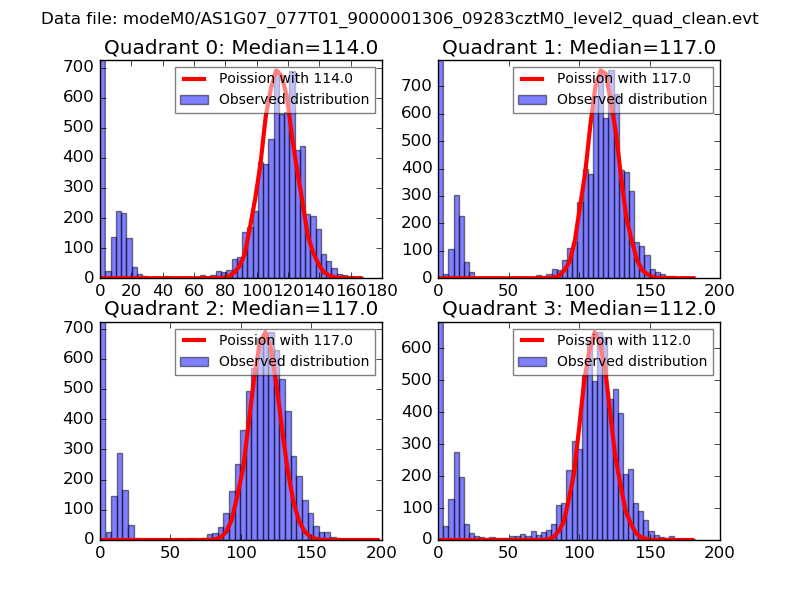 |
 |
| Quadrant-wise count rates Data is divided into 100 sec bins |
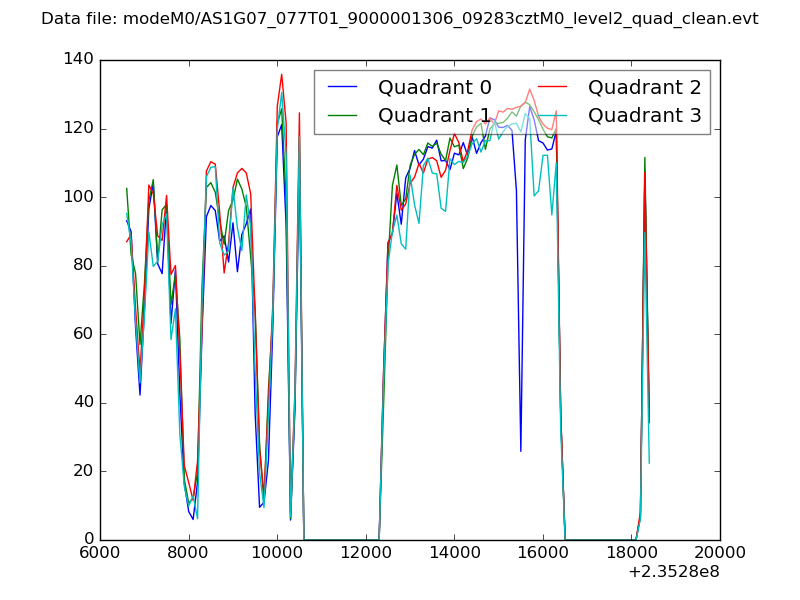 |
|
| Module-wise count rates for Quadrant A Data is divided into 100 sec bins |
 |
 |
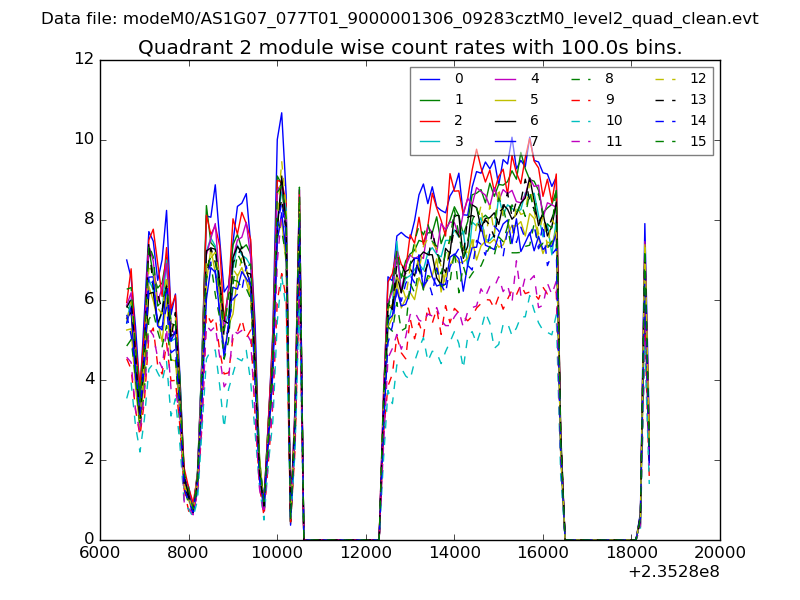
| Module-wise count rates for Quadrant B Data is divided into 100 sec bins |
 |
 |
| Module-wise count rates for Quadrant C Data is divided into 100 sec bins |
 |
 |
| Module-wise count rates for Quadrant D Data is divided into 100 sec bins |
 |
 |
| Parameter | Plot |
|---|---|
| CZT HV Monitor | 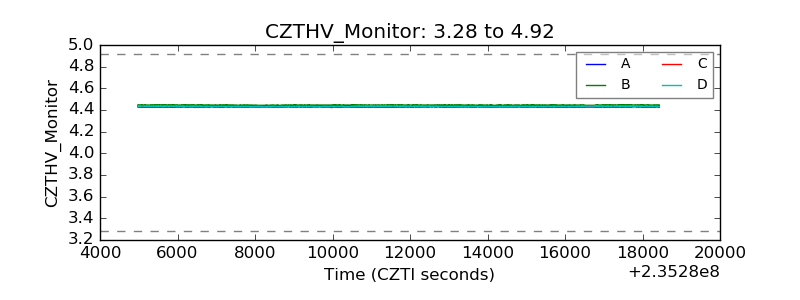 |
| D_VDD | 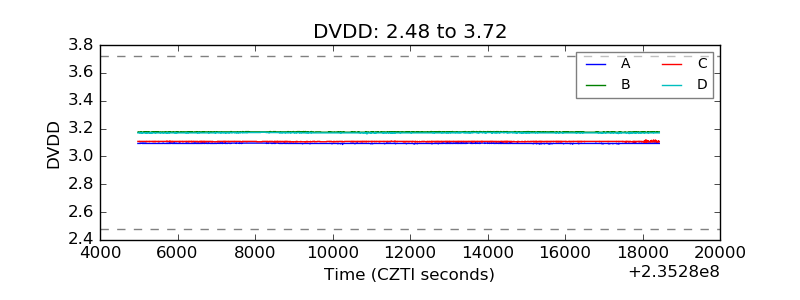 |
| Temperature 1 | 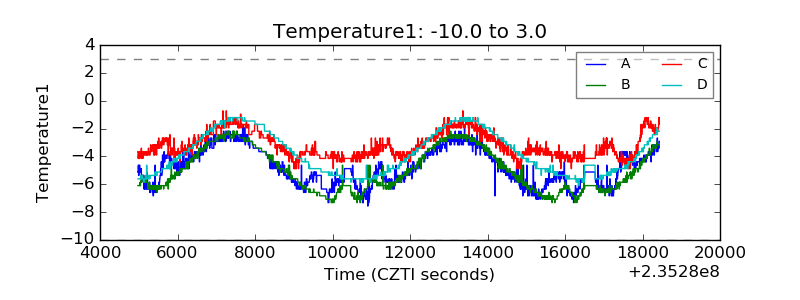 |
| Veto HV Monitor |  |
| Veto LLD | 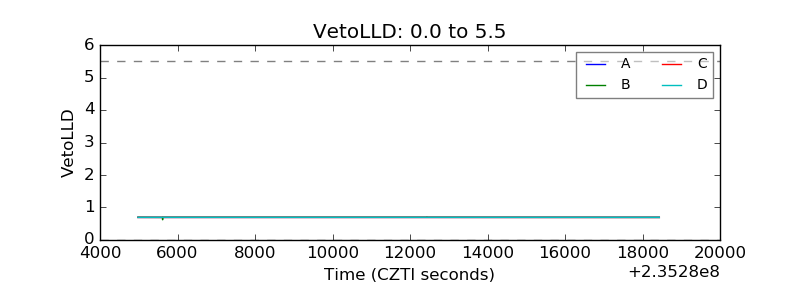 |
| Alpha Counter | 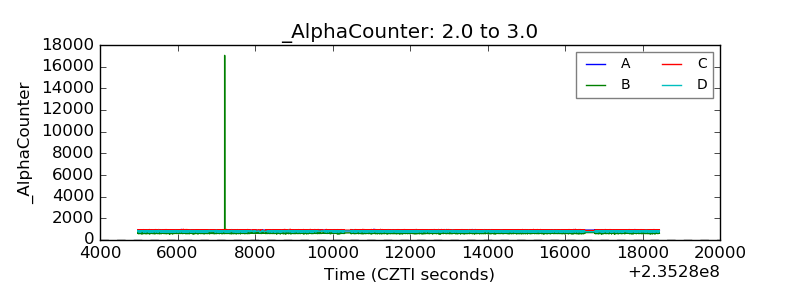 |
| _CPM_Rate | 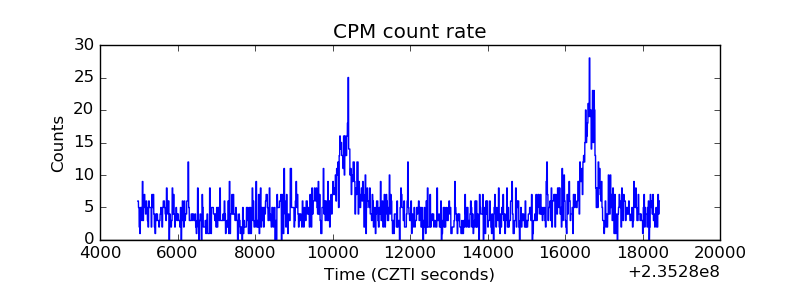 |
| CZT Counter |  |
| +2.5 Volts monitor |  |
| +5 Volts monitor |  |
| _ROLL_ROT |  |
| _Roll_DEC |  |
| _Roll_RA |  |
| Veto Counter |  |