| Param | Original file | Final file |
|---|---|---|
| Filename | modeM0/AS1G07_077T01_9000001306_09286cztM0_level2.evt | modeM0/AS1G07_077T01_9000001306_09286cztM0_level2_quad_clean.evt |
| Size (bytes) | 345,234,240 | 45,034,560 |
| Size | 329.2 MB | 42.9 MB |
| Events in quadrant A | 2,755,654 | 274,609 |
| Events in quadrant B | 1,930,209 | 280,766 |
| Events in quadrant C | 1,804,129 | 276,339 |
| Events in quadrant D | 3,690,777 | 247,349 |
| Mode M0 | |||
|---|---|---|---|
| Quadrant | BADHDUFLAG | Total packets | Discarded packets |
| A | 0 | 11012 | 18 |
| B | 0 | 8474 | 12 |
| C | 0 | 8317 | 7 |
| D | 0 | 13758 | 26 |
| Mode SS | |||
|---|---|---|---|
| Quadrant | BADHDUFLAG | Total packets | Discarded packets |
| A | 0 | 84 | 2 |
| B | 0 | 84 | 0 |
| C | 0 | 84 | 0 |
| D | 0 | 84 | 0 |
| Mode M9 | |||
|---|---|---|---|
| Quadrant | BADHDUFLAG | Total packets | Discarded packets |
| A | 0 | 2 | 0 |
| B | 0 | 2 | 0 |
| C | 0 | 2 | 0 |
| D | 0 | 2 | 0 |
| Quadrant | Total seconds | Saturated seconds | Saturation percentage |
|---|---|---|---|
| A | 4023 | 202 | 5.021129% |
| B | 4023 | 167 | 4.151131% |
| C | 4025 | 111 | 2.757764% |
| D | 4023 | 631 | 15.684812% |
Noise dominated data is calculated using 1-second bins in cleaned event files. If a bin has >2000 counts, and if more than 50% of those come from <1% of pixels, then it is considered to be noise-dominated and hence unusable.
| Quadrant | # 1 sec bins | Bins with >0 counts | Bins with >2000 counts | High rate bins dominated by noise | Noise dominated (total time) | Noise dominated (detector-on time) | Marked lightcurve |
|---|---|---|---|---|---|---|---|
| A | 4293 | 4029 | 18 | 18 | 0.42% | 0.45% | 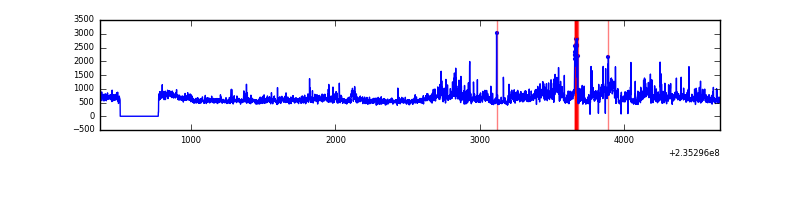 |
| B | 4293 | 4029 | 2 | 2 | 0.05% | 0.05% | 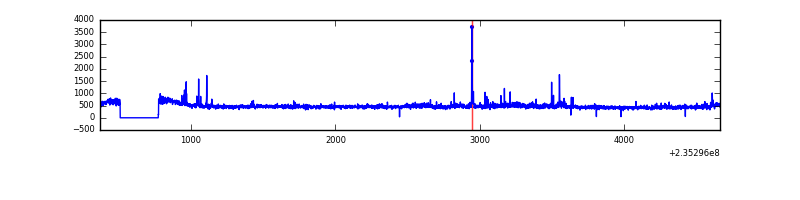 |
| C | 4293 | 4029 | 0 | 0 | 0.00% | 0.00% | 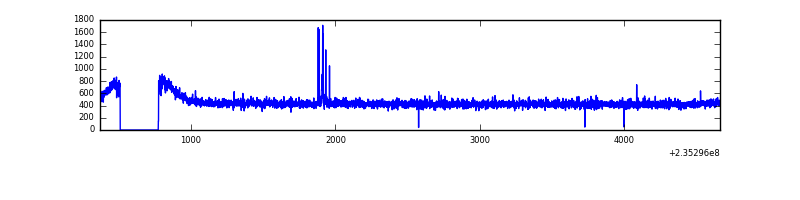 |
| D | 4293 | 4029 | 447 | 447 | 10.41% | 11.09% | 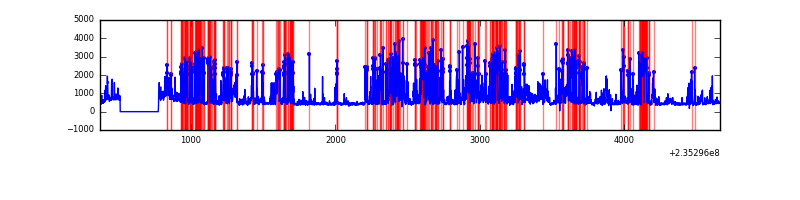 |
Top three noisy pixels from each quadrant. If the there are fewer than three noisy pixels in the level2.evt file, extra rows are filled as -1
| Pixel properties | Quadrant properties | ||||||
|---|---|---|---|---|---|---|---|
| Quadrant | DetID | PixID | Counts | Sigma | Mean | Median | Sigma |
| A | 8 | 5 | 866551 | 8985.02 | 464 | 452 | 96.4 |
| A | 1 | 162 | 37178 | 381.0 | 464 | 452 | 96.4 |
| A | 13 | 251 | 30870 | 315.56 | 464 | 452 | 96.4 |
| B | 0 | 214 | 52429 | 569.66 | 467 | 454 | 91.2 |
| B | 0 | 219 | 18542 | 198.25 | 467 | 454 | 91.2 |
| B | 8 | 234 | 18126 | 193.69 | 467 | 454 | 91.2 |
| C | 14 | 234 | 11164 | 100.91 | 455 | 455 | 106.1 |
| C | 8 | 128 | 5670 | 49.14 | 455 | 455 | 106.1 |
| C | 14 | 67 | 3835 | 31.85 | 455 | 455 | 106.1 |
| D | 1 | 52 | 1656453 | 15697.69 | 427 | 415 | 105.5 |
| D | 12 | 233 | 277825 | 2629.59 | 427 | 415 | 105.5 |
| D | 7 | 71 | 83923 | 791.58 | 427 | 415 | 105.5 |
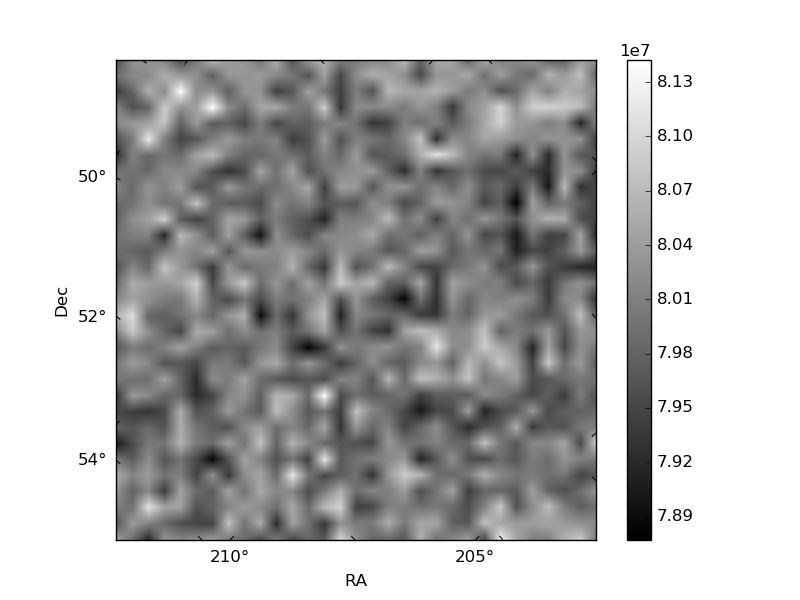
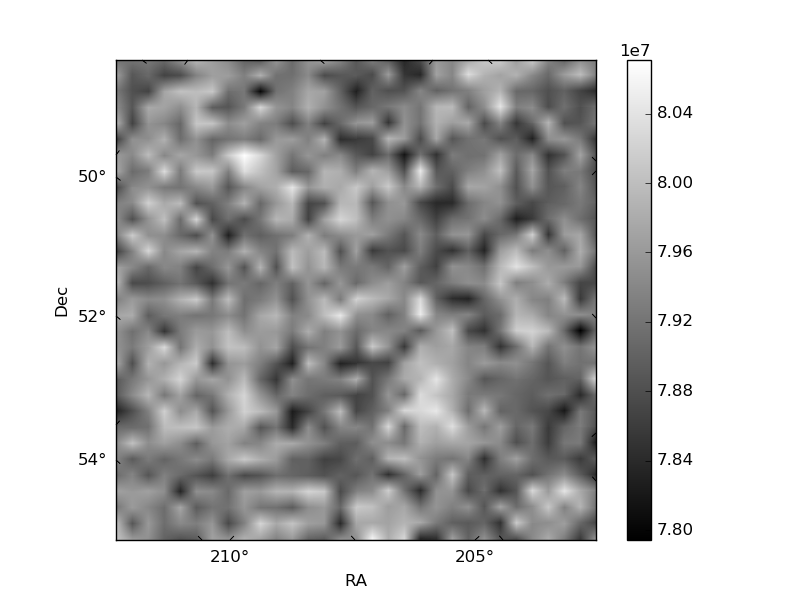
Histogram calculated using DETX and DETY for each event in the final _common_clean file
| Quadrant A | 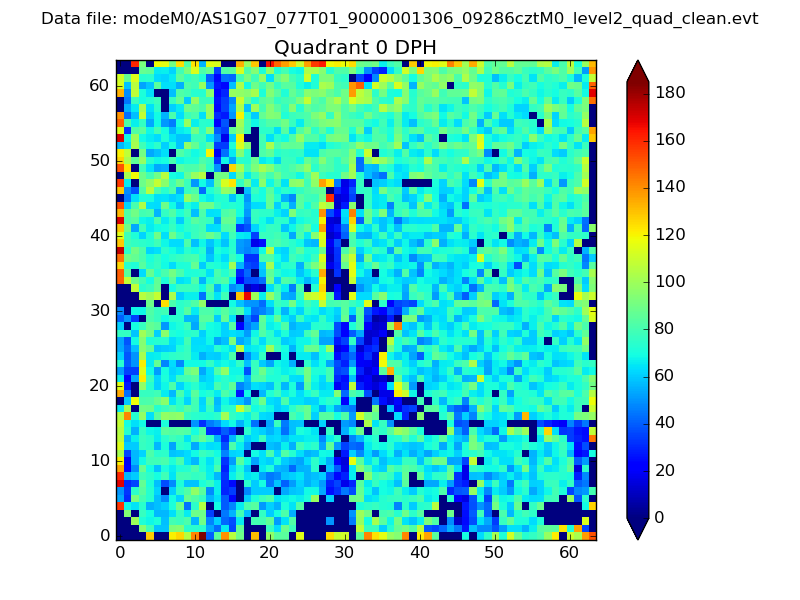 |
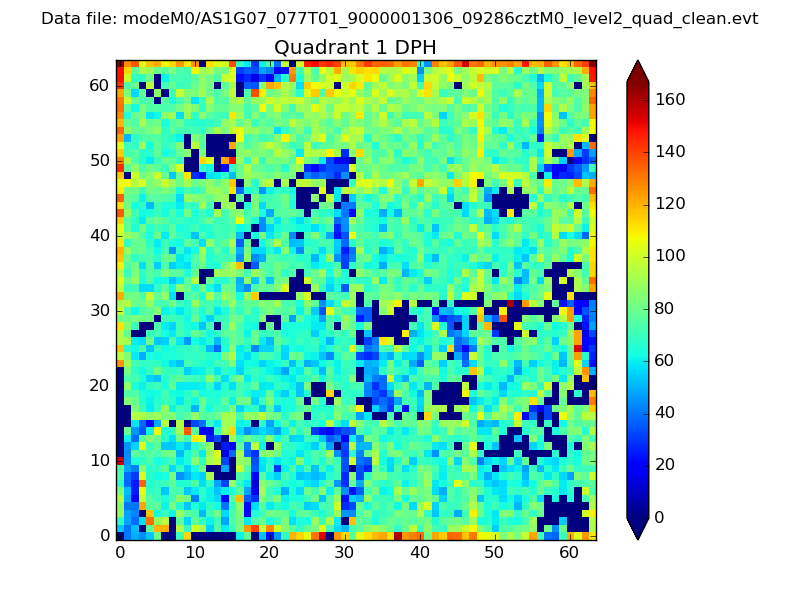 |
Quadrant B |
|---|---|---|---|
| Quadrant D | 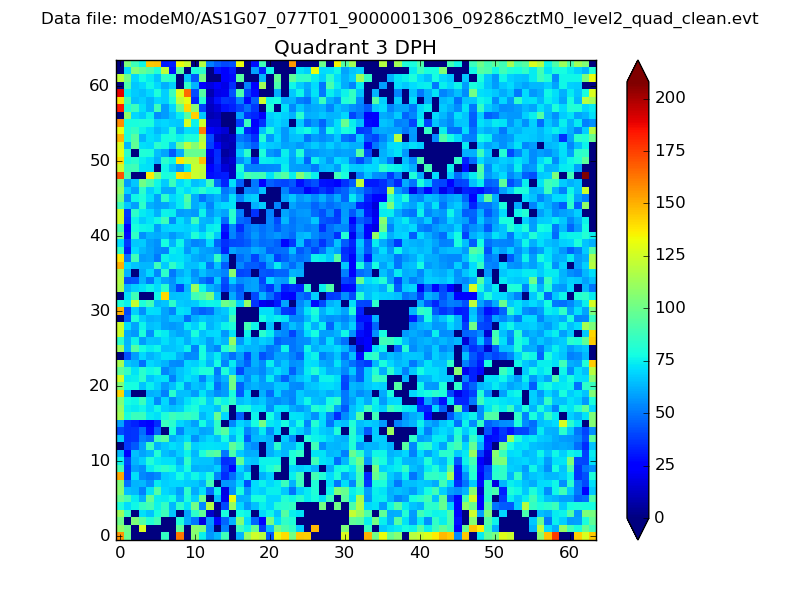 |
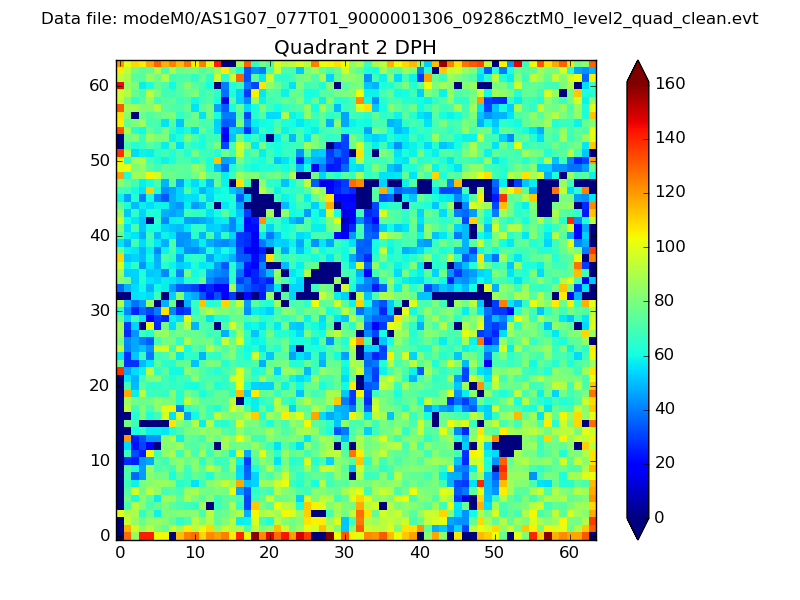 |
Quadrant C |
| Plot type | Count rate plots | Images |
|---|---|---|
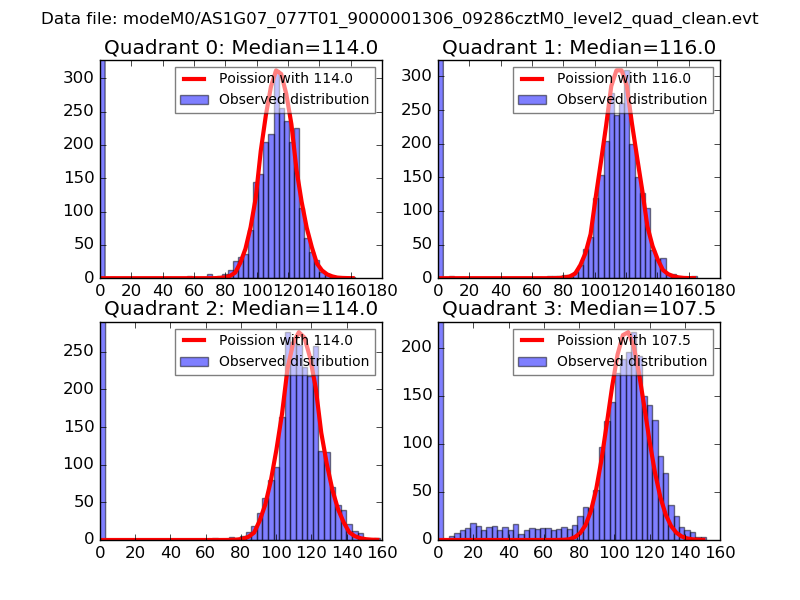
| Comparison with Poisson distribution Blue bars denote a histogram of data divided into 1 sec bins. Red curve is a Poisson curve with rate = median count rate of data. |
 |
 |
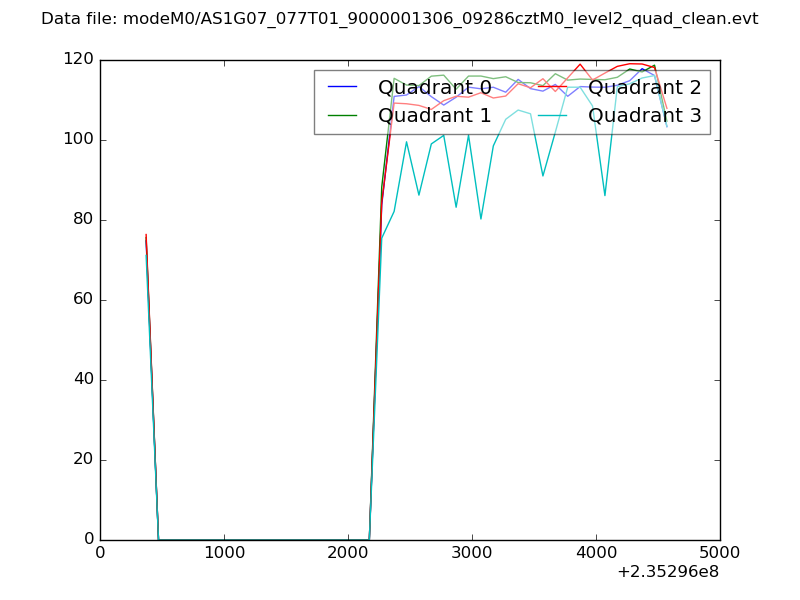
| Quadrant-wise count rates Data is divided into 100 sec bins |
 |
|
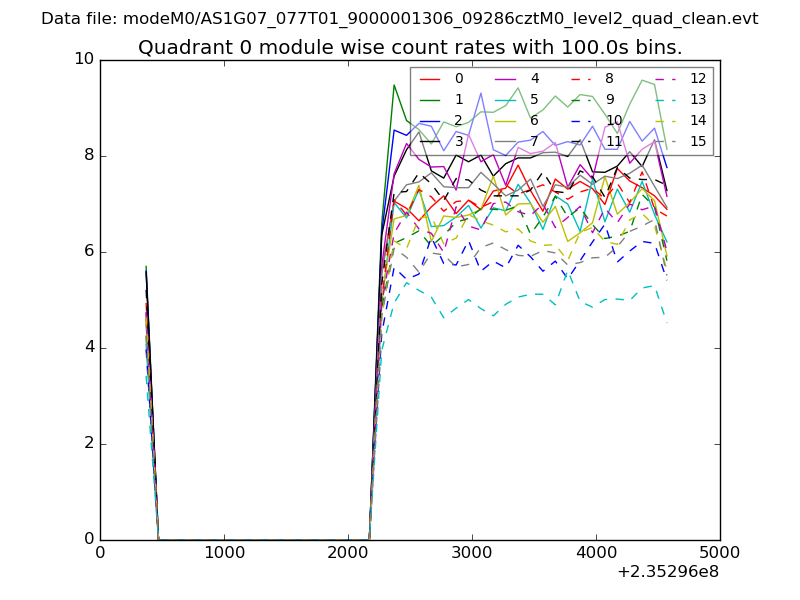
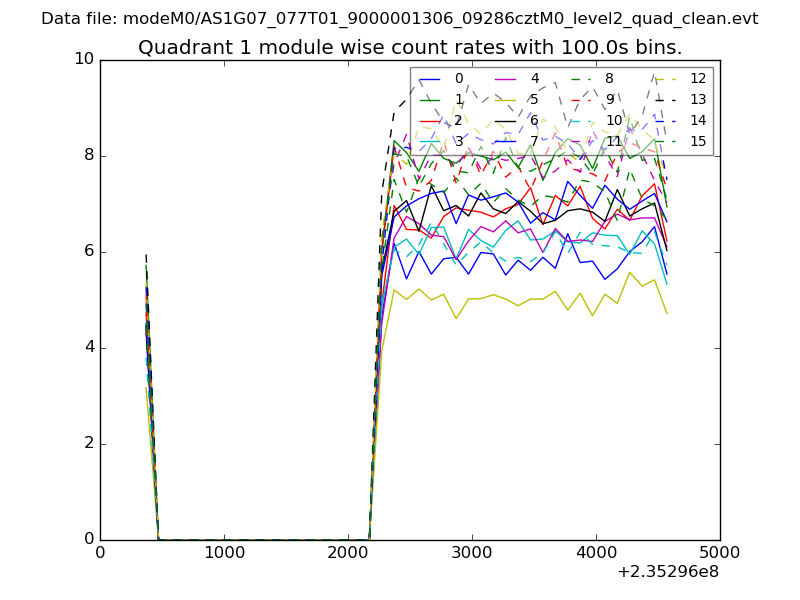
| Module-wise count rates for Quadrant A Data is divided into 100 sec bins |
 |
 |
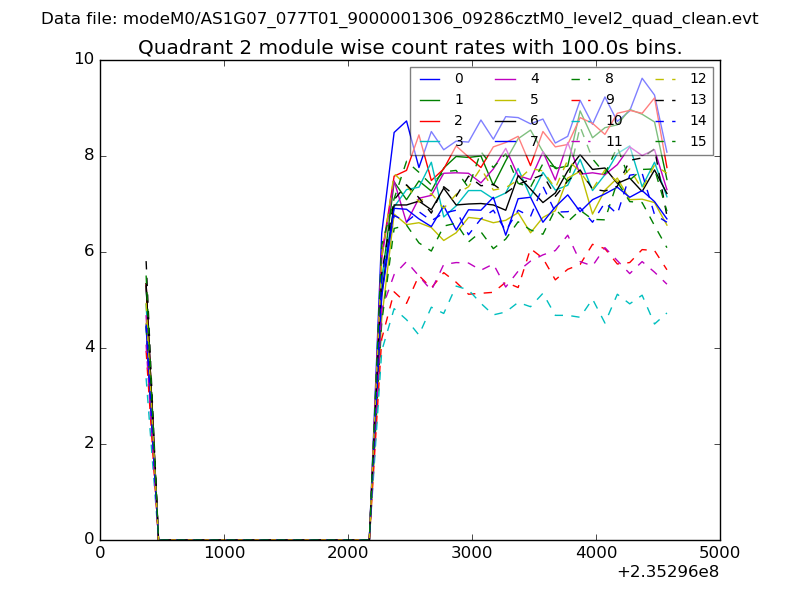
| Module-wise count rates for Quadrant B Data is divided into 100 sec bins |
 |
 |
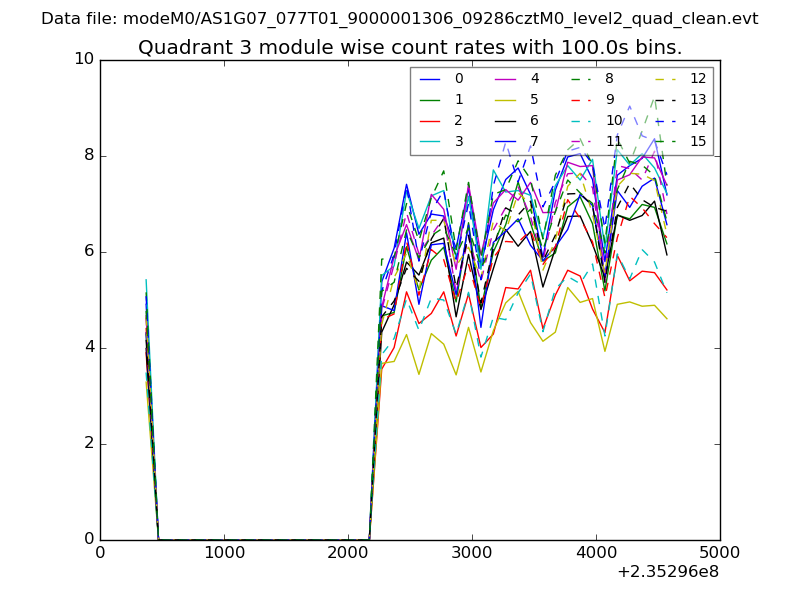
| Module-wise count rates for Quadrant C Data is divided into 100 sec bins |
 |
 |
| Module-wise count rates for Quadrant D Data is divided into 100 sec bins |
 |
 |
| Parameter | Plot |
|---|---|
| CZT HV Monitor | 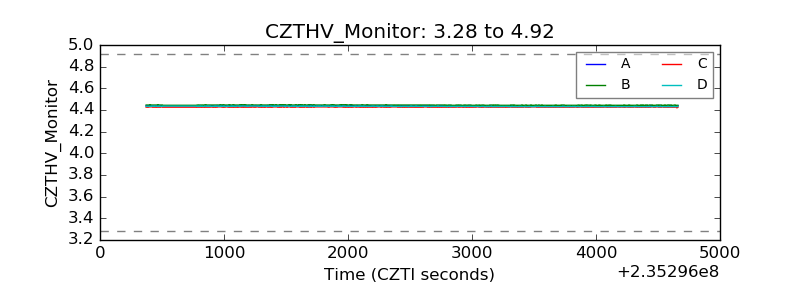 |
| D_VDD | 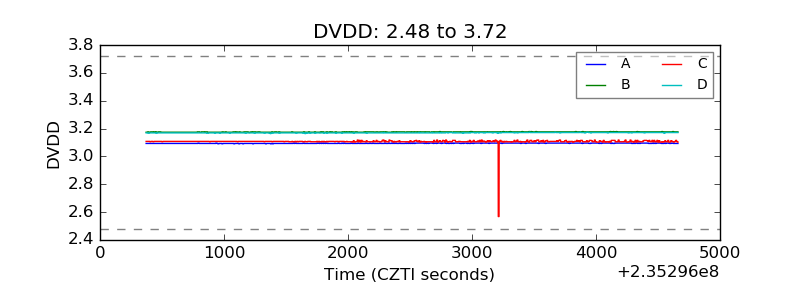 |
| Temperature 1 | 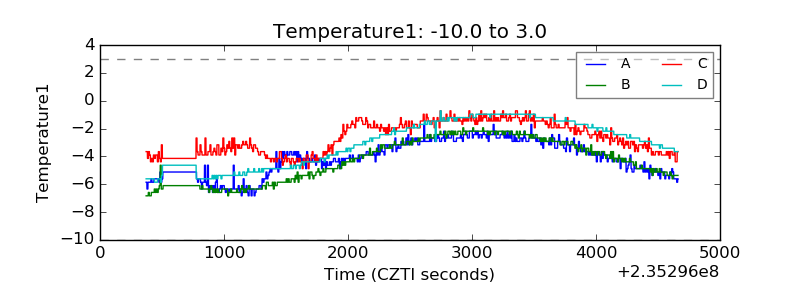 |
| Veto HV Monitor | 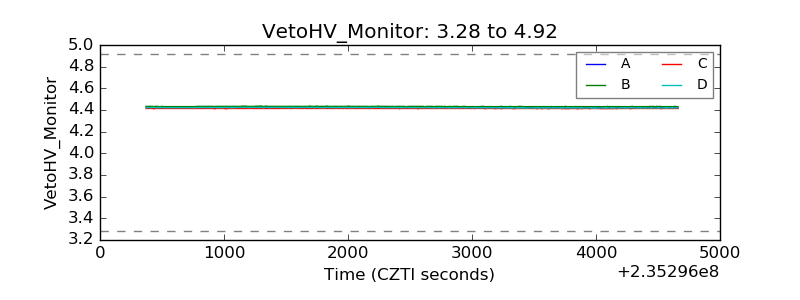 |
| Veto LLD | 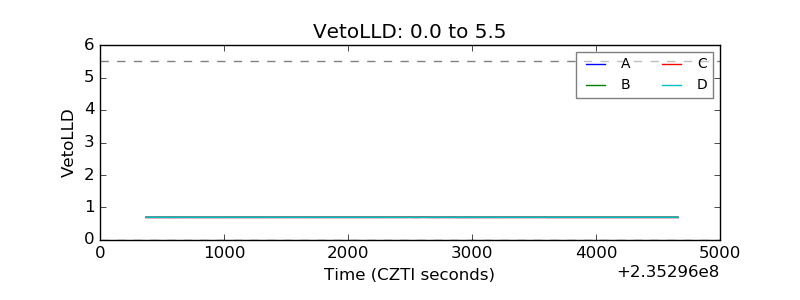 |
| Alpha Counter | 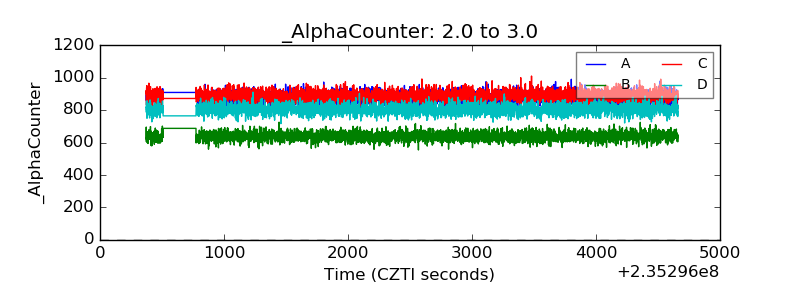 |
| _CPM_Rate | 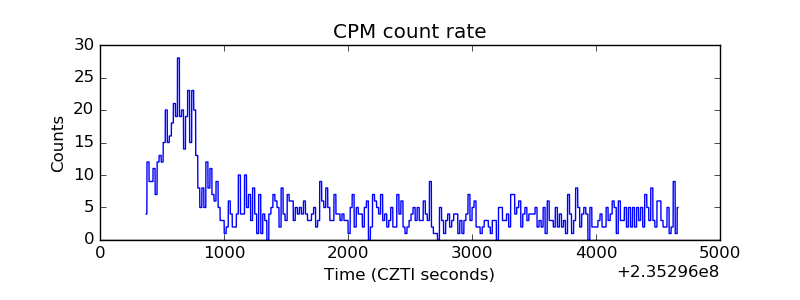 |
| CZT Counter | 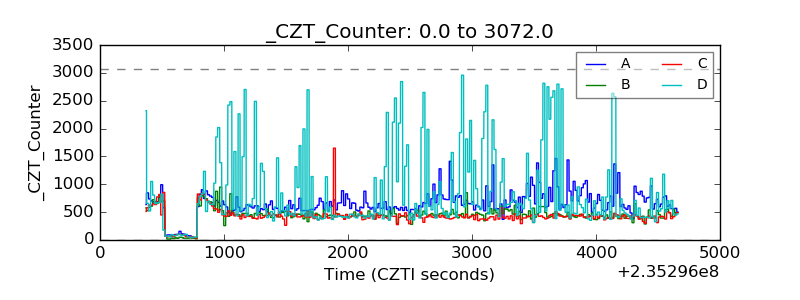 |
| +2.5 Volts monitor |  |
| +5 Volts monitor |  |
| _ROLL_ROT | 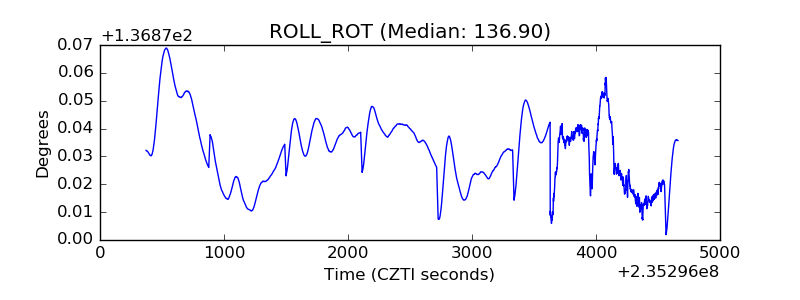 |
| _Roll_DEC | 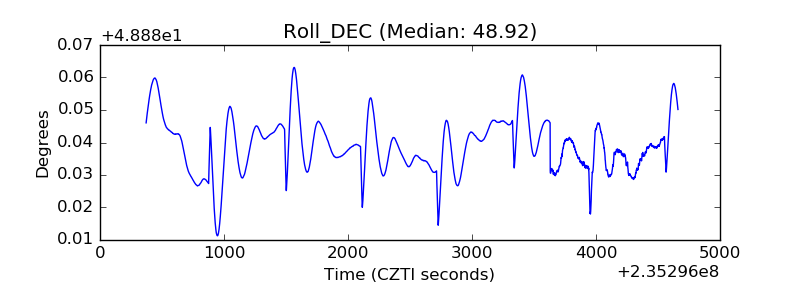 |
| _Roll_RA | 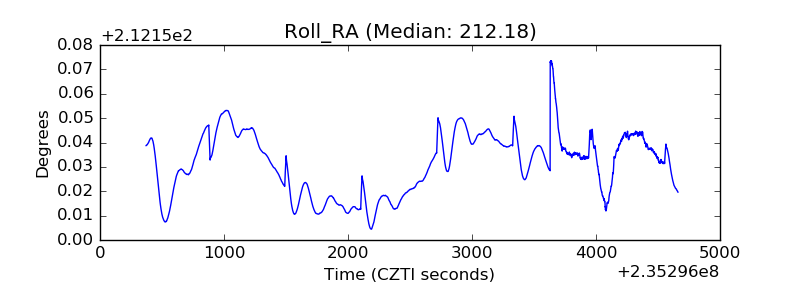 |
| Veto Counter | 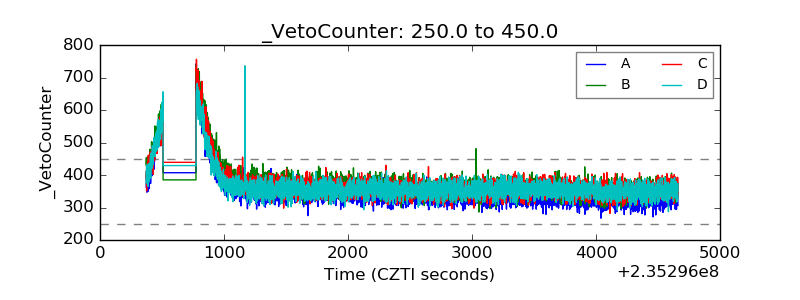 |