| Param | Original file | Final file |
|---|---|---|
| Filename | modeM0/AS1G07_077T02_9000001308cztM0_level2.fits | modeM0/AS1G07_077T02_9000001308cztM0_level2_quad_clean.evt |
| Size (bytes) | 223,430,400 | 247,501,440 |
| Size | 213.1 MB | 236.0 MB |
| Events in quadrant A | 1,302,840 | 1,493,739 |
| Events in quadrant B | 1,301,002 | 1,507,843 |
| Events in quadrant C | 1,332,156 | 1,466,044 |
| Events in quadrant D | 1,139,192 | 1,337,275 |
| Mode M0 | |||
|---|---|---|---|
| Quadrant | BADHDUFLAG | Total packets | Discarded packets |
| A | 0 | 65032 | 0 |
| B | 0 | 52528 | 0 |
| C | 0 | 50279 | 0 |
| D | 0 | 58742 | 0 |
| Mode SS | |||
|---|---|---|---|
| Quadrant | BADHDUFLAG | Total packets | Discarded packets |
| A | 0 | 502 | 0 |
| B | 0 | 502 | 0 |
| C | 0 | 502 | 0 |
| D | 0 | 502 | 0 |
| Mode M9 | |||
|---|---|---|---|
| Quadrant | BADHDUFLAG | Total packets | Discarded packets |
| A | 0 | 39 | 0 |
| B | 0 | 39 | 0 |
| C | 0 | 39 | 0 |
| D | 0 | 39 | 0 |
| Quadrant | Total seconds | Saturated seconds | Saturation percentage |
|---|---|---|---|
| A | 24514 | 955 | 3.895733% |
| B | 24577 | 298 | 1.212516% |
| C | 24621 | 185 | 0.751391% |
| D | 24566 | 591 | 2.405764% |
Noise dominated data is calculated using 1-second bins in cleaned event files. If a bin has >2000 counts, and if more than 50% of those come from <1% of pixels, then it is considered to be noise-dominated and hence unusable.
| Quadrant | # 1 sec bins | Bins with >0 counts | Bins with >2000 counts | High rate bins dominated by noise | Noise dominated (total time) | Noise dominated (detector-on time) | Marked lightcurve |
|---|---|---|---|---|---|---|---|
| A | 34479 | 24809 | 0 | 0 | 0.00% | 0.00% |  |
| B | 34479 | 24828 | 0 | 0 | 0.00% | 0.00% |  |
| C | 34479 | 24831 | 0 | 0 | 0.00% | 0.00% |  |
| D | 34479 | 24813 | 0 | 0 | 0.00% | 0.00% |  |
Top three noisy pixels from each quadrant. If the there are fewer than three noisy pixels in the level2.evt file, extra rows are filled as -1
| Pixel properties | Quadrant properties | ||||||
|---|---|---|---|---|---|---|---|
| Quadrant | DetID | PixID | Counts | Sigma | Mean | Median | Sigma |
| A | 0 | 29 | 1270 | 10.98 | 338 | 316 | 86.9 |
| A | 7 | 110 | 1157 | 9.68 | 338 | 316 | 86.9 |
| A | 0 | 30 | 942 | 7.21 | 338 | 316 | 86.9 |
| B | 2 | 9 | 1121 | 11.13 | 342 | 324 | 71.6 |
| B | 12 | 226 | 867 | 7.58 | 342 | 324 | 71.6 |
| B | 2 | 8 | 854 | 7.4 | 342 | 324 | 71.6 |
| C | 1 | 80 | 968 | 6.82 | 351 | 325 | 94.3 |
| C | 12 | 241 | 939 | 6.51 | 351 | 325 | 94.3 |
| C | 1 | 81 | 934 | 6.46 | 351 | 325 | 94.3 |
| D | 6 | 231 | 870 | 6.55 | 324 | 295 | 87.8 |
| D | 7 | 3 | 828 | 6.07 | 324 | 295 | 87.8 |
| D | 1 | 19 | 818 | 5.96 | 324 | 295 | 87.8 |
Histogram calculated using DETX and DETY for each event in the final _common_clean file
| Quadrant A | 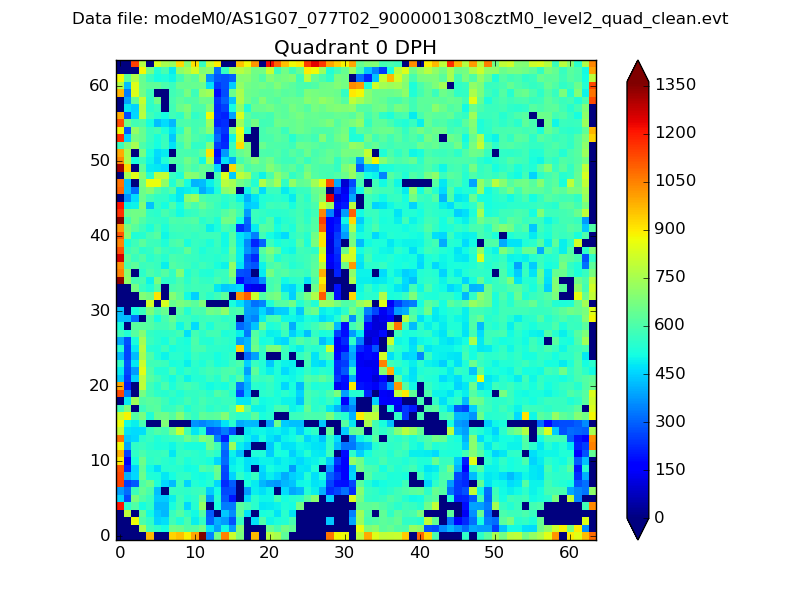 |
 |
Quadrant B |
|---|---|---|---|
| Quadrant D | 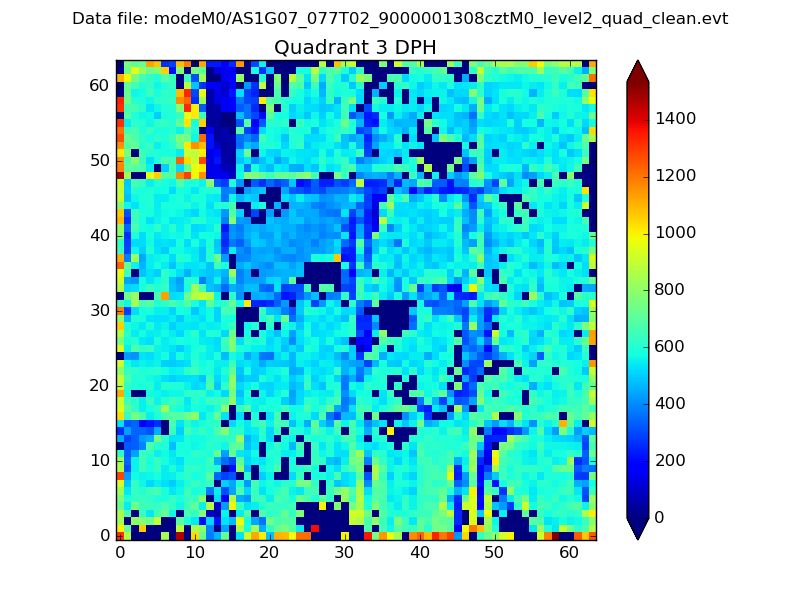 |
 |
Quadrant C |
| Plot type | Count rate plots | Images |
|---|---|---|
| Comparison with Poisson distribution Blue bars denote a histogram of data divided into 1 sec bins. Red curve is a Poisson curve with rate = median count rate of data. |
 |
 |
| Quadrant-wise count rates Data is divided into 100 sec bins |
 |
|
| Module-wise count rates for Quadrant A Data is divided into 100 sec bins |
 |
 |
| Module-wise count rates for Quadrant B Data is divided into 100 sec bins |
 |
 |
| Module-wise count rates for Quadrant C Data is divided into 100 sec bins |
 |
 |
| Module-wise count rates for Quadrant D Data is divided into 100 sec bins |
 |
 |
| Parameter | Plot |
|---|---|
| CZT HV Monitor | 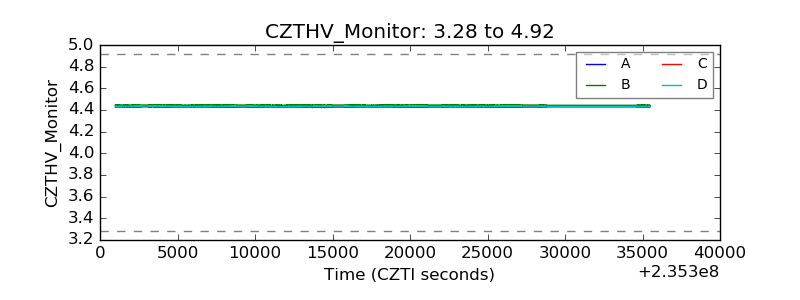 |
| D_VDD | 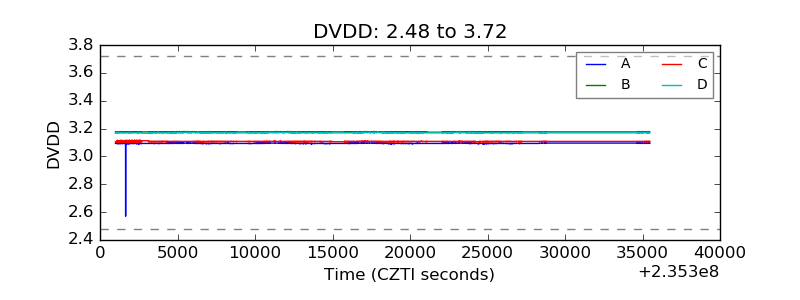 |
| Temperature 1 |  |
| Veto HV Monitor | 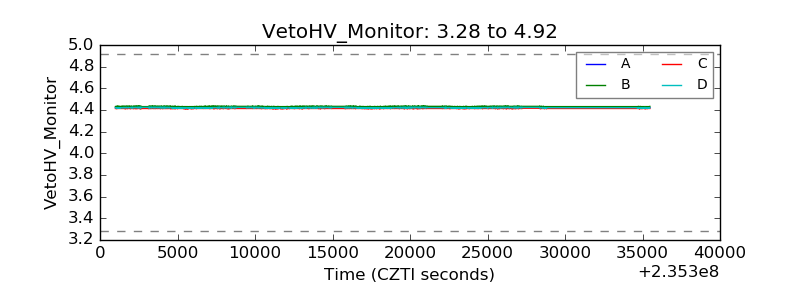 |
| Veto LLD |  |
| Alpha Counter |  |
| _CPM_Rate |  |
| CZT Counter | 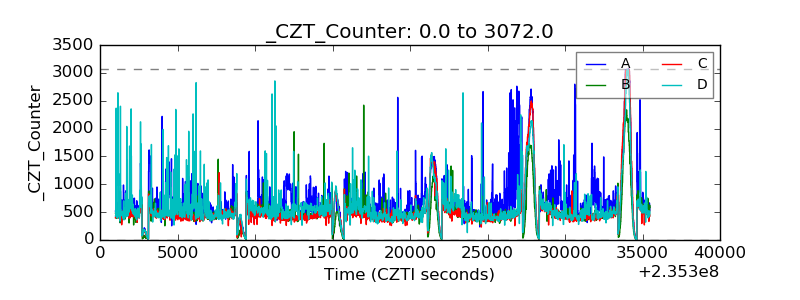 |
| +2.5 Volts monitor |  |
| +5 Volts monitor |  |
| _ROLL_ROT | 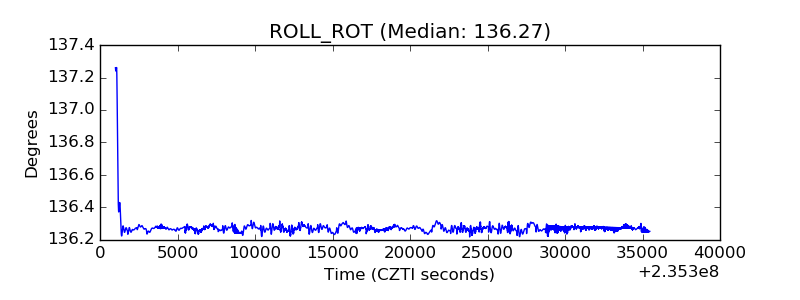 |
| _Roll_DEC | 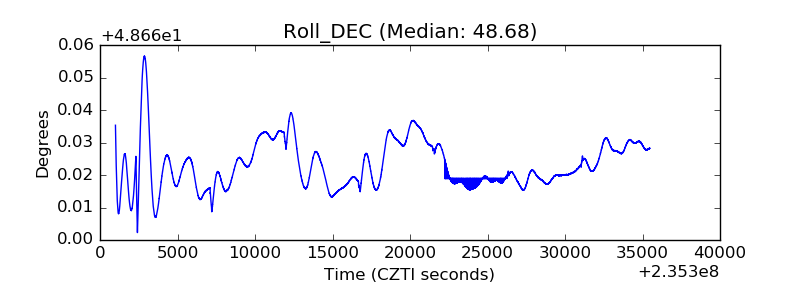 |
| _Roll_RA | 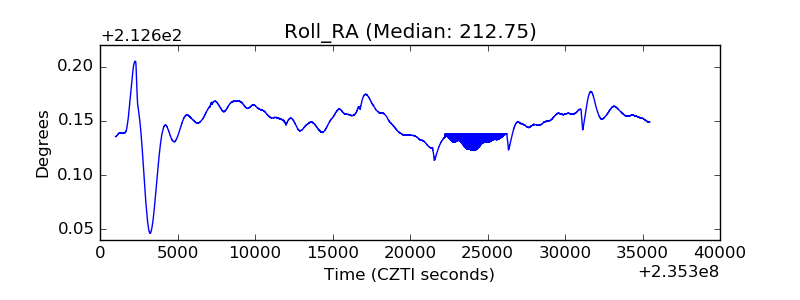 |
| Veto Counter |  |