| Param | Original file | Final file |
|---|---|---|
| Filename | modeM0/AS1G07_077T02_9000001308_09286cztM0_level2.evt | modeM0/AS1G07_077T02_9000001308_09286cztM0_level2_quad_clean.evt |
| Size (bytes) | 1,062,999,360 | 194,374,080 |
| Size | 1013.8 MB | 185.4 MB |
| Events in quadrant A | 9,175,526 | 1,221,495 |
| Events in quadrant B | 7,022,765 | 1,249,620 |
| Events in quadrant C | 6,375,051 | 1,244,377 |
| Events in quadrant D | 8,656,203 | 1,187,902 |
| Mode M0 | |||
|---|---|---|---|
| Quadrant | BADHDUFLAG | Total packets | Discarded packets |
| A | 0 | 37334 | 627 |
| B | 0 | 30666 | 394 |
| C | 0 | 29288 | 327 |
| D | 0 | 35632 | 521 |
| Mode SS | |||
|---|---|---|---|
| Quadrant | BADHDUFLAG | Total packets | Discarded packets |
| A | 0 | 294 | 2 |
| B | 0 | 294 | 2 |
| C | 0 | 294 | 2 |
| D | 0 | 294 | 4 |
| Mode M9 | |||
|---|---|---|---|
| Quadrant | BADHDUFLAG | Total packets | Discarded packets |
| A | 0 | 18 | 0 |
| B | 0 | 18 | 0 |
| C | 0 | 18 | 0 |
| D | 0 | 18 | 0 |
| Quadrant | Total seconds | Saturated seconds | Saturation percentage |
|---|---|---|---|
| A | 14208 | 380 | 2.674550% |
| B | 14250 | 206 | 1.445614% |
| C | 14275 | 126 | 0.882662% |
| D | 14236 | 417 | 2.929194% |
Noise dominated data is calculated using 1-second bins in cleaned event files. If a bin has >2000 counts, and if more than 50% of those come from <1% of pixels, then it is considered to be noise-dominated and hence unusable.
| Quadrant | # 1 sec bins | Bins with >0 counts | Bins with >2000 counts | High rate bins dominated by noise | Noise dominated (total time) | Noise dominated (detector-on time) | Marked lightcurve |
|---|---|---|---|---|---|---|---|
| A | 16255 | 14416 | 21 | 21 | 0.13% | 0.15% | 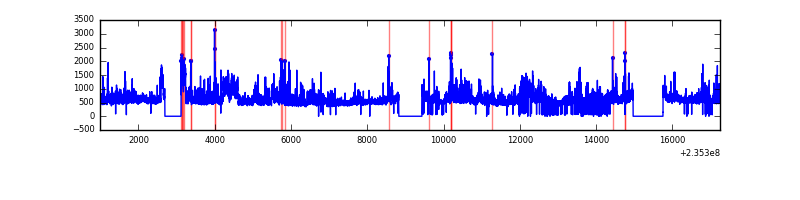 |
| B | 16255 | 14421 | 12 | 12 | 0.07% | 0.08% | 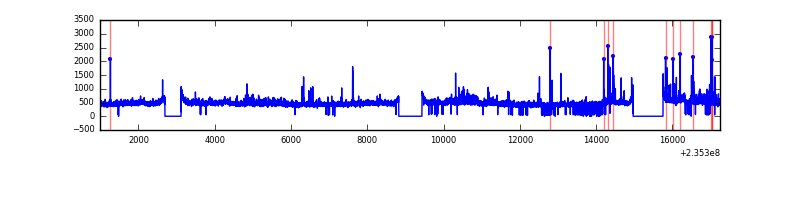 |
| C | 16255 | 14424 | 0 | 0 | 0.00% | 0.00% | 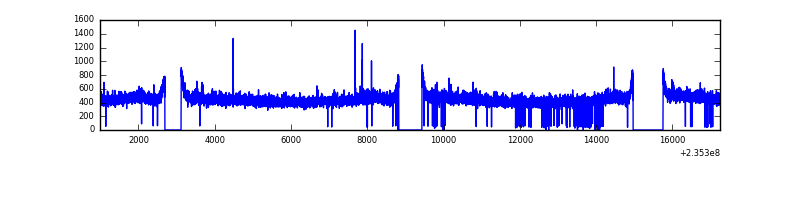 |
| D | 16255 | 14420 | 212 | 212 | 1.30% | 1.47% | 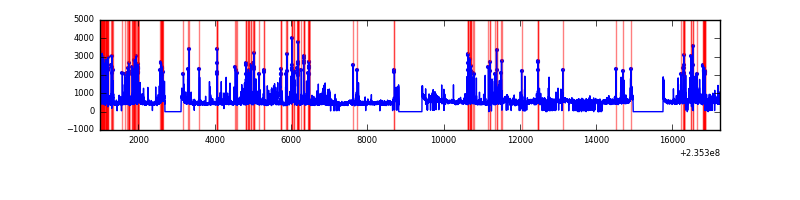 |
Top three noisy pixels from each quadrant. If the there are fewer than three noisy pixels in the level2.evt file, extra rows are filled as -1
| Pixel properties | Quadrant properties | ||||||
|---|---|---|---|---|---|---|---|
| Quadrant | DetID | PixID | Counts | Sigma | Mean | Median | Sigma |
| A | 8 | 5 | 2488213 | 7487.85 | 1639 | 1601 | 332.1 |
| A | 15 | 223 | 116016 | 344.53 | 1639 | 1601 | 332.1 |
| A | 1 | 162 | 108912 | 323.14 | 1639 | 1601 | 332.1 |
| B | 0 | 214 | 163625 | 513.41 | 1664 | 1622 | 315.5 |
| B | 8 | 234 | 156839 | 491.9 | 1664 | 1622 | 315.5 |
| B | 4 | 80 | 87562 | 272.36 | 1664 | 1622 | 315.5 |
| C | 14 | 67 | 18916 | 45.7 | 1624 | 1629 | 378.3 |
| C | 12 | 4 | 12928 | 29.87 | 1624 | 1629 | 378.3 |
| C | 13 | 61 | 12425 | 28.54 | 1624 | 1629 | 378.3 |
| D | 1 | 52 | 1603106 | 4053.26 | 1592 | 1546 | 395.1 |
| D | 12 | 233 | 534395 | 1348.54 | 1592 | 1546 | 395.1 |
| D | 2 | 152 | 167695 | 420.49 | 1592 | 1546 | 395.1 |
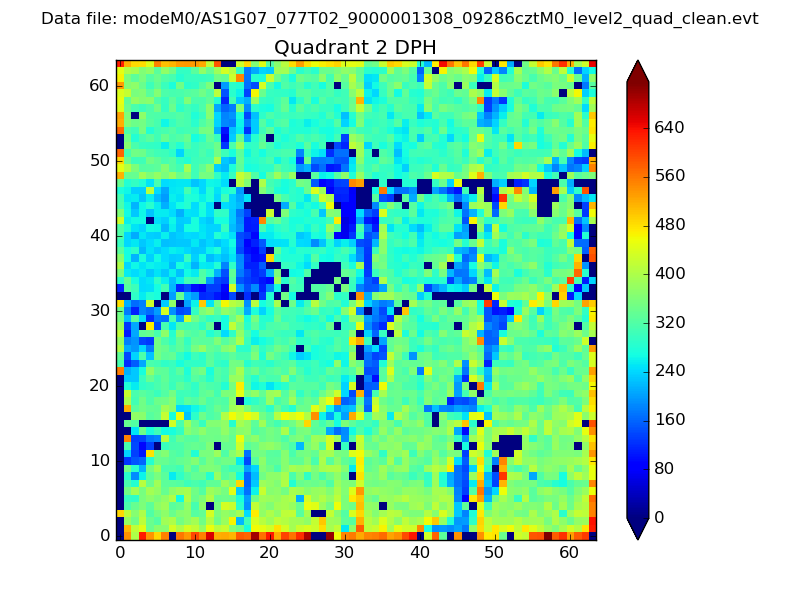
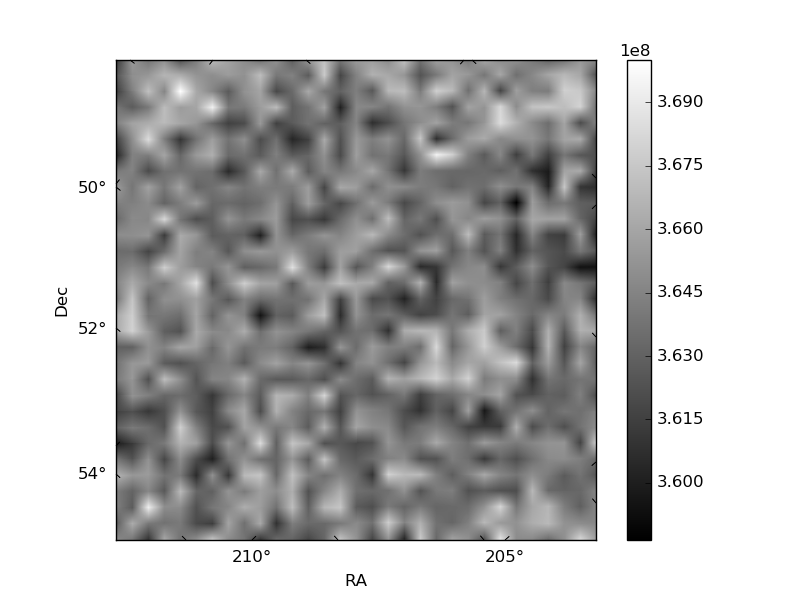
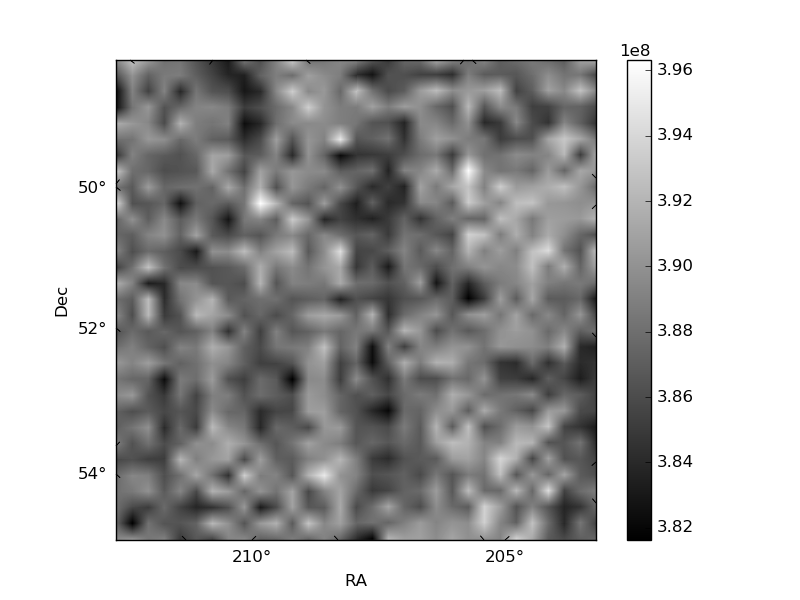
Histogram calculated using DETX and DETY for each event in the final _common_clean file
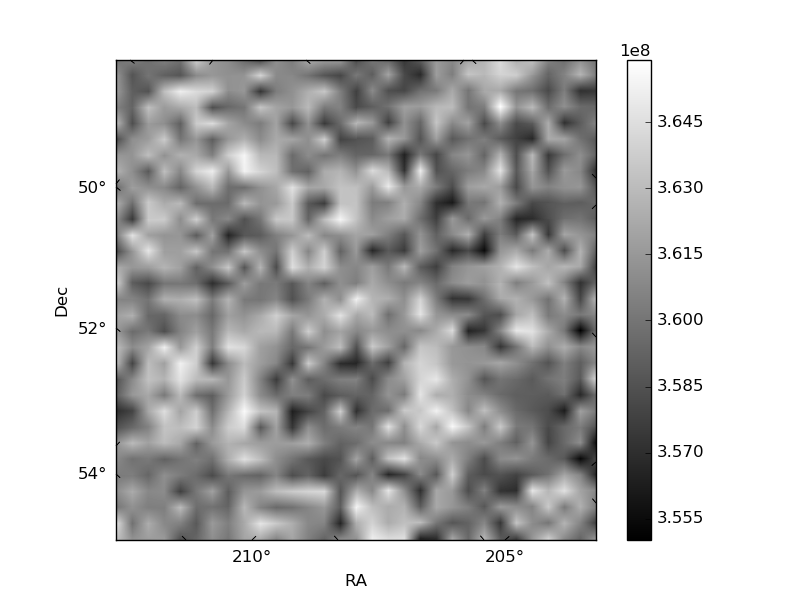
| Quadrant A | 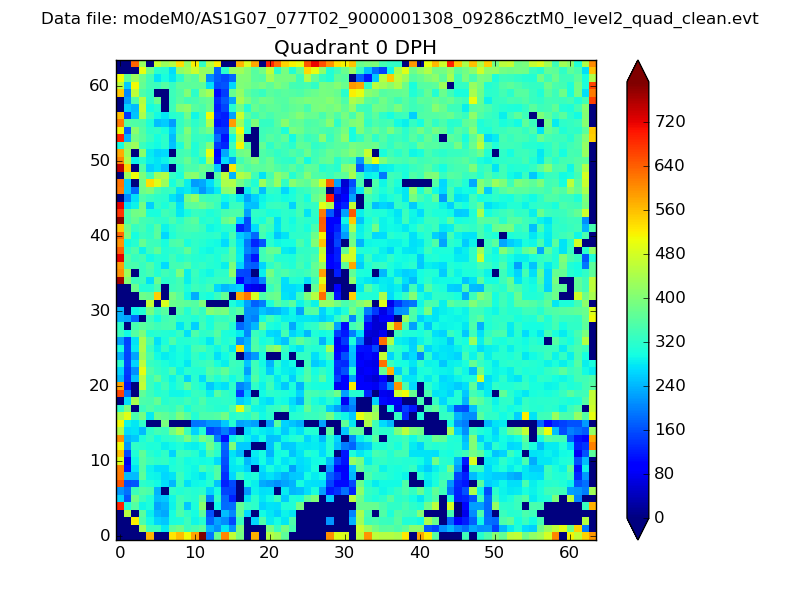 |
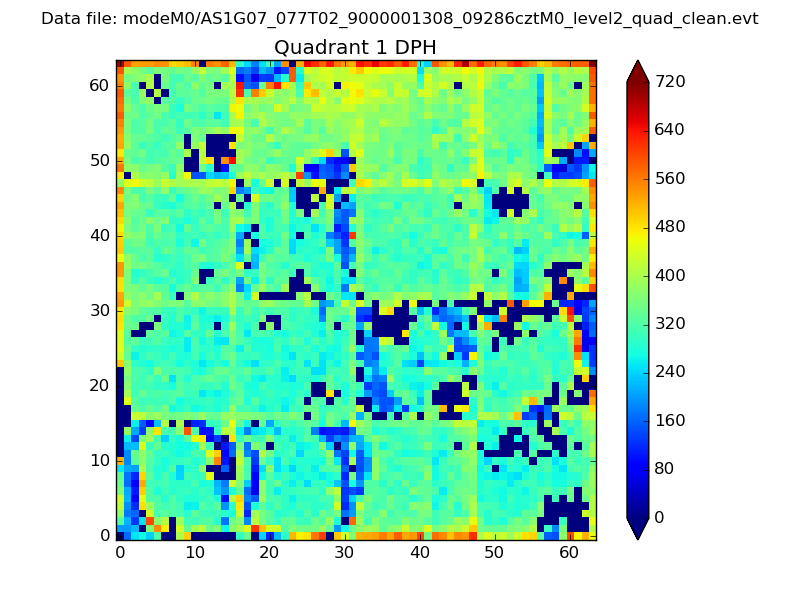 |
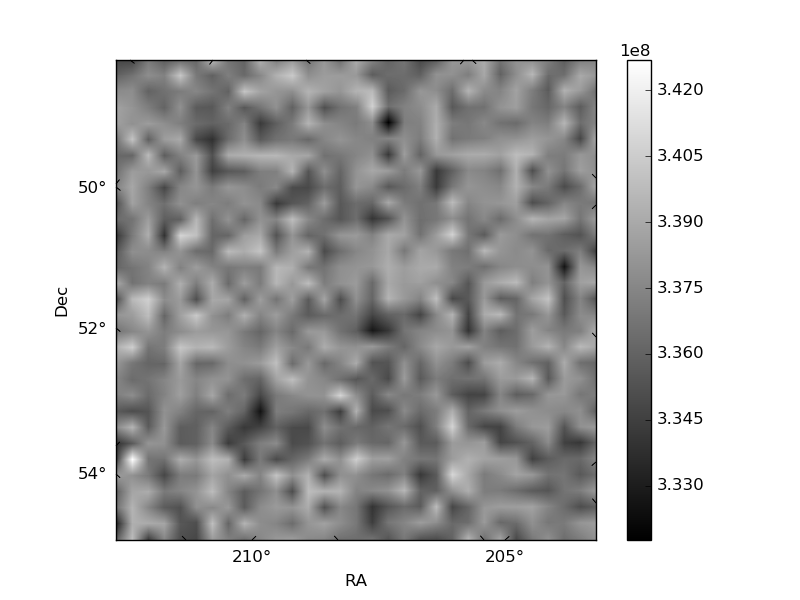
Quadrant B |
|---|---|---|---|
| Quadrant D | 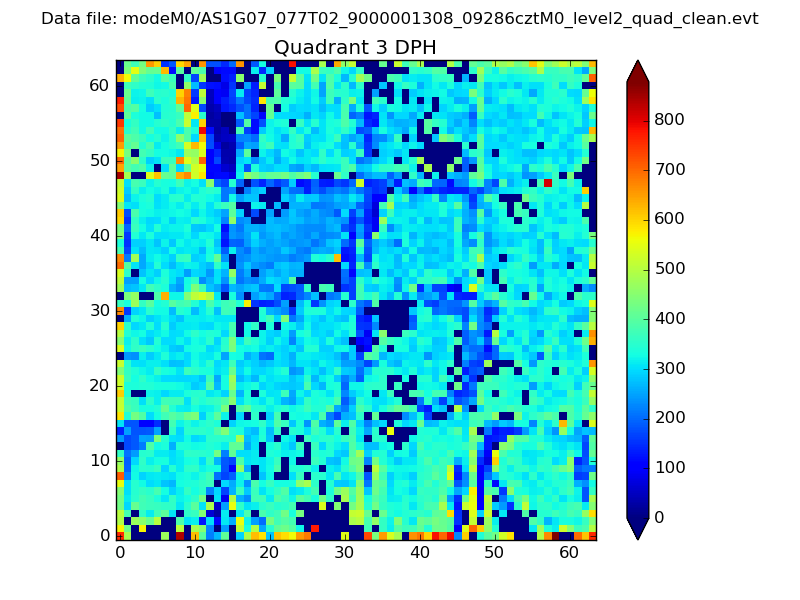 |
 |
Quadrant C |
| Plot type | Count rate plots | Images |
|---|---|---|
| Comparison with Poisson distribution Blue bars denote a histogram of data divided into 1 sec bins. Red curve is a Poisson curve with rate = median count rate of data. |
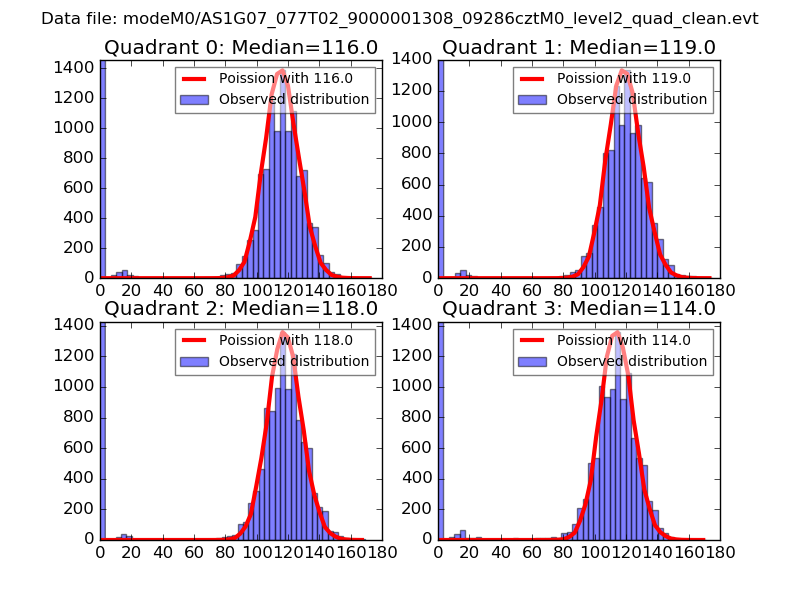 |
 |
| Quadrant-wise count rates Data is divided into 100 sec bins |
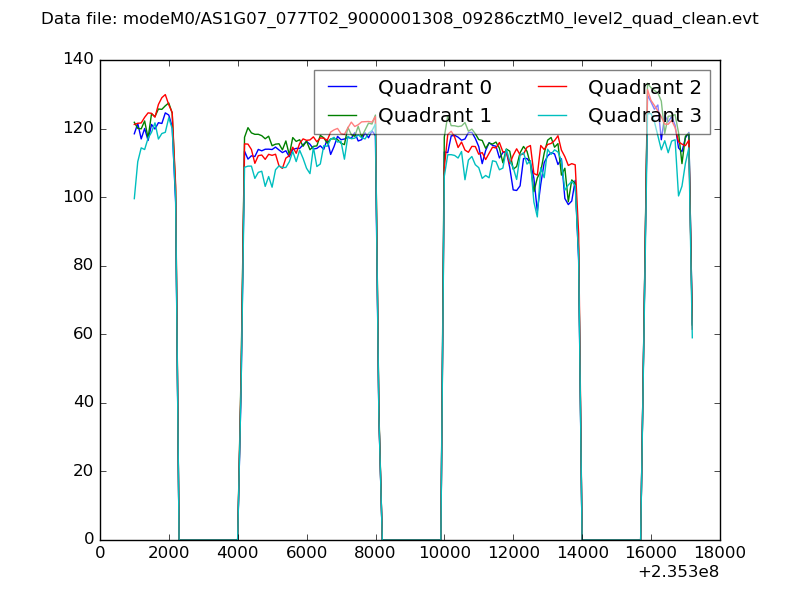 |
|
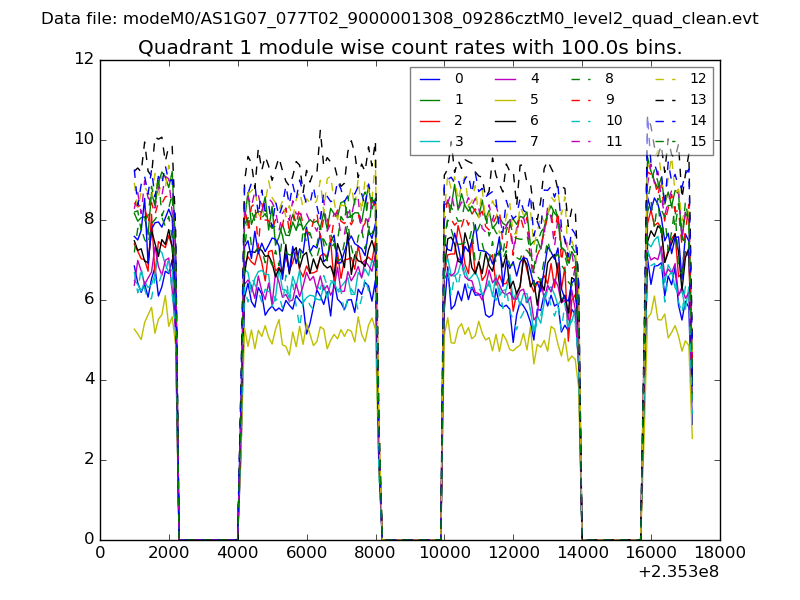
| Module-wise count rates for Quadrant A Data is divided into 100 sec bins |
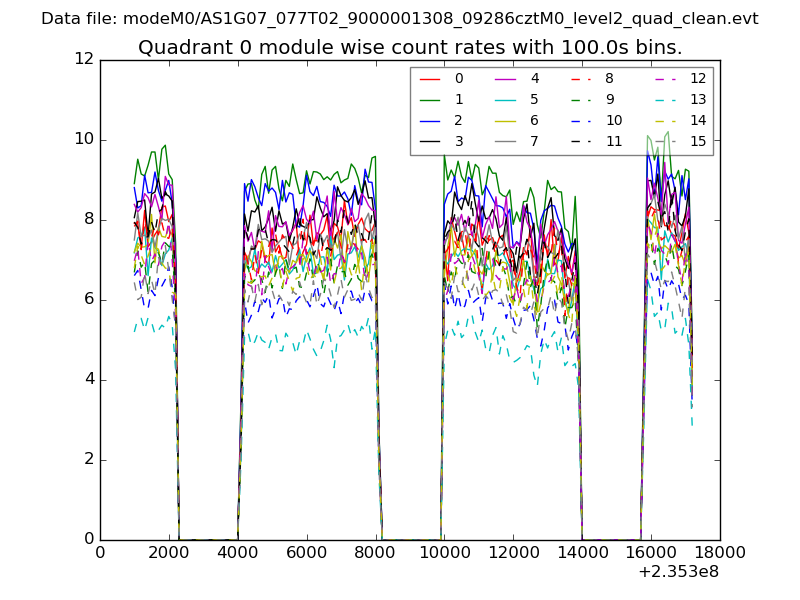 |
 |
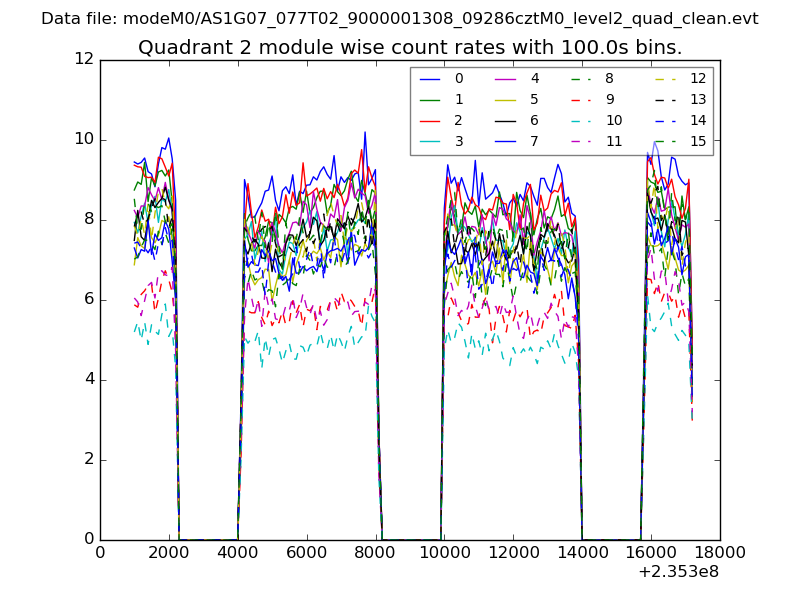
| Module-wise count rates for Quadrant B Data is divided into 100 sec bins |
 |
 |
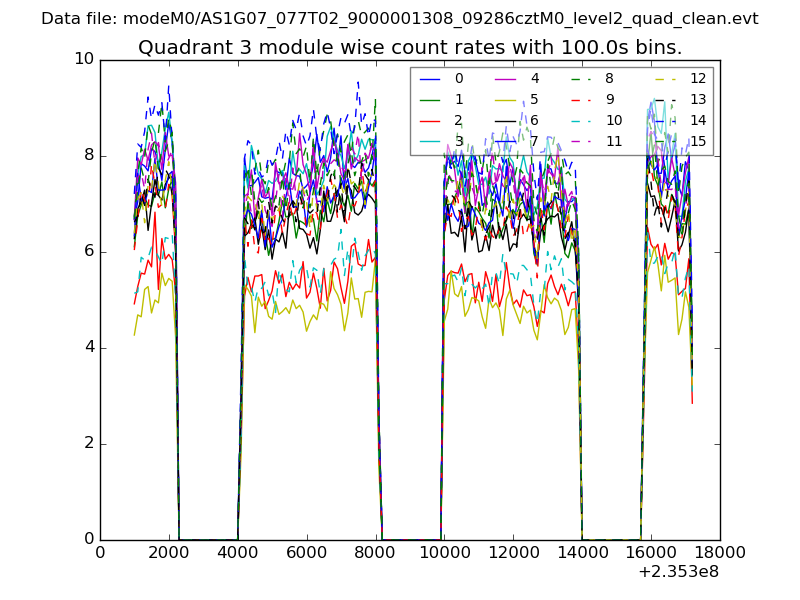
| Module-wise count rates for Quadrant C Data is divided into 100 sec bins |
 |
 |
| Module-wise count rates for Quadrant D Data is divided into 100 sec bins |
 |
 |
| Parameter | Plot |
|---|---|
| CZT HV Monitor | 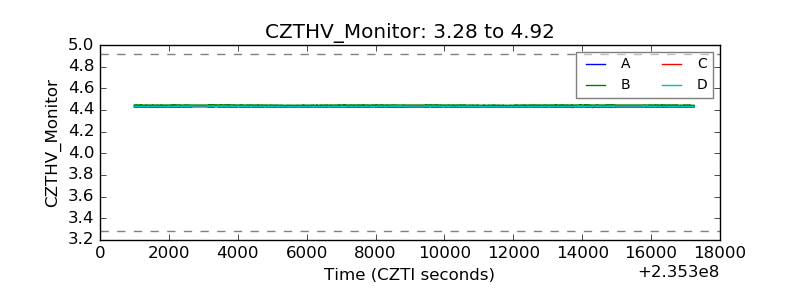 |
| D_VDD |  |
| Temperature 1 | 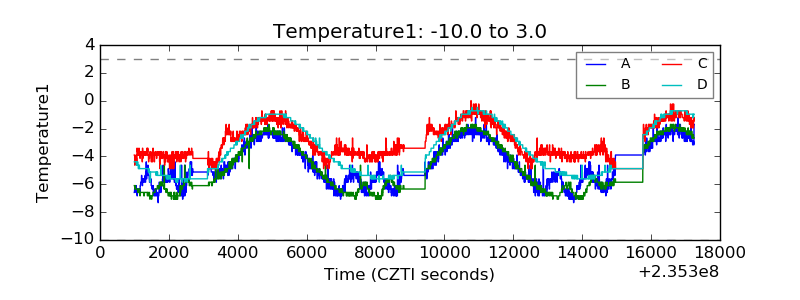 |
| Veto HV Monitor | 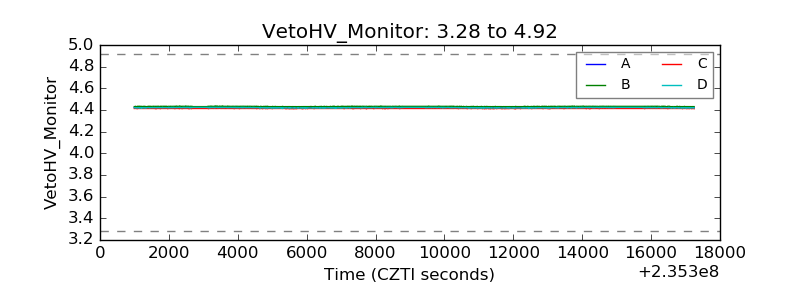 |
| Veto LLD | 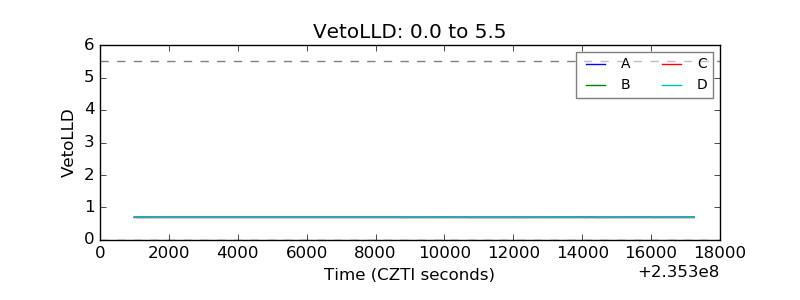 |
| Alpha Counter | 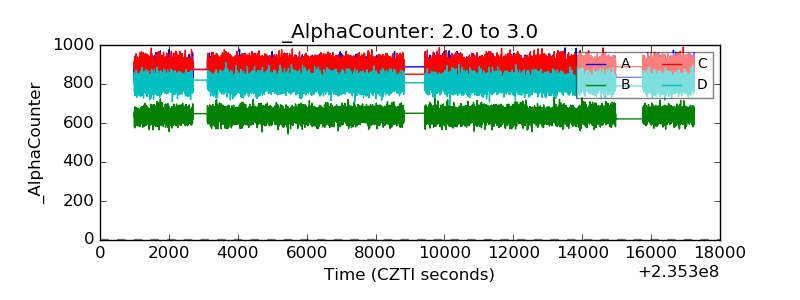 |
| _CPM_Rate | 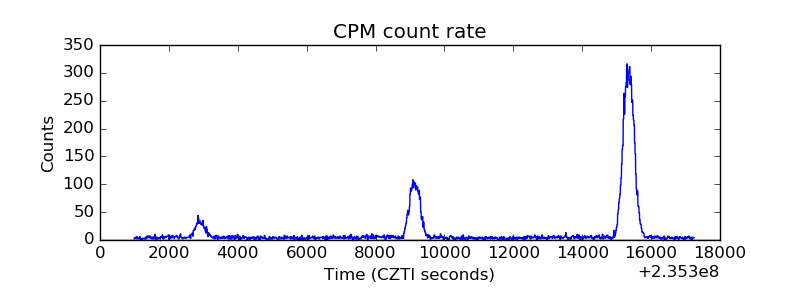 |
| CZT Counter | 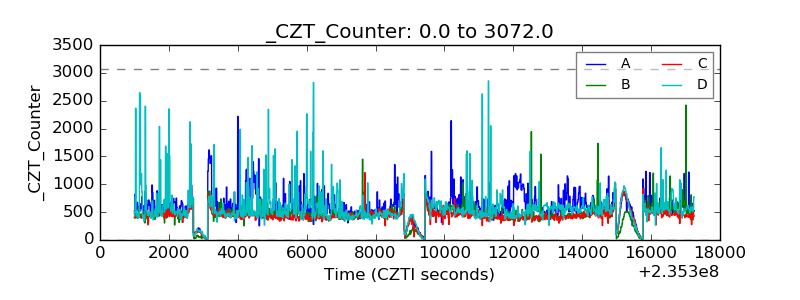 |
| +2.5 Volts monitor |  |
| +5 Volts monitor |  |
| _ROLL_ROT | 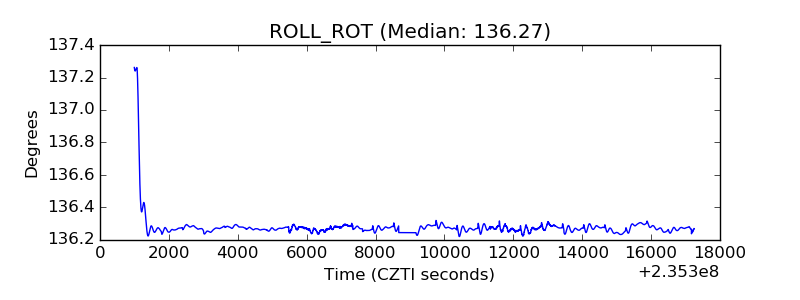 |
| _Roll_DEC | 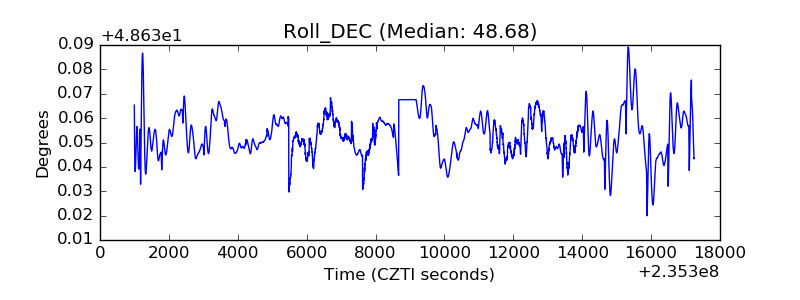 |
| _Roll_RA |  |
| Veto Counter | 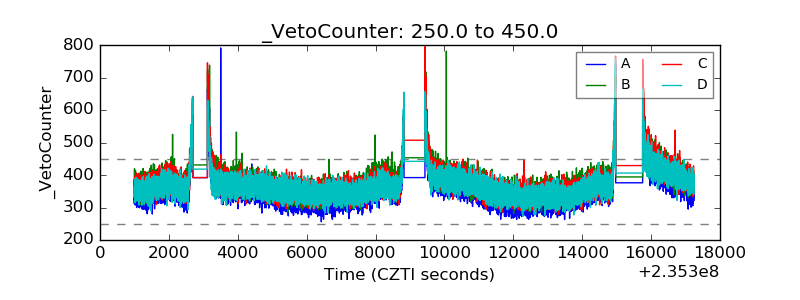 |