| Param | Original file | Final file |
|---|---|---|
| Filename | modeM0/AS1G07_077T02_9000001308_09287cztM0_level2.evt | modeM0/AS1G07_077T02_9000001308_09287cztM0_level2_quad_clean.evt |
| Size (bytes) | 477,815,040 | 99,095,040 |
| Size | 455.7 MB | 94.5 MB |
| Events in quadrant A | 4,033,455 | 633,653 |
| Events in quadrant B | 3,379,997 | 647,915 |
| Events in quadrant C | 2,994,854 | 646,777 |
| Events in quadrant D | 3,616,034 | 614,588 |
| Mode M0 | |||
|---|---|---|---|
| Quadrant | BADHDUFLAG | Total packets | Discarded packets |
| A | 0 | 16669 | 288 |
| B | 0 | 14802 | 203 |
| C | 0 | 13528 | 127 |
| D | 0 | 15662 | 327 |
| Mode SS | |||
|---|---|---|---|
| Quadrant | BADHDUFLAG | Total packets | Discarded packets |
| A | 0 | 136 | 0 |
| B | 0 | 136 | 4 |
| C | 0 | 136 | 0 |
| D | 0 | 136 | 2 |
| Mode M9 | |||
|---|---|---|---|
| Quadrant | BADHDUFLAG | Total packets | Discarded packets |
| A | 0 | 9 | 0 |
| B | 0 | 9 | 0 |
| C | 0 | 9 | 0 |
| D | 0 | 9 | 0 |
| Quadrant | Total seconds | Saturated seconds | Saturation percentage |
|---|---|---|---|
| A | 6546 | 102 | 1.558203% |
| B | 6574 | 76 | 1.156069% |
| C | 6592 | 38 | 0.576456% |
| D | 6550 | 108 | 1.648855% |
Noise dominated data is calculated using 1-second bins in cleaned event files. If a bin has >2000 counts, and if more than 50% of those come from <1% of pixels, then it is considered to be noise-dominated and hence unusable.
| Quadrant | # 1 sec bins | Bins with >0 counts | Bins with >2000 counts | High rate bins dominated by noise | Noise dominated (total time) | Noise dominated (detector-on time) | Marked lightcurve |
|---|---|---|---|---|---|---|---|
| A | 7585 | 6644 | 11 | 11 | 0.15% | 0.17% | 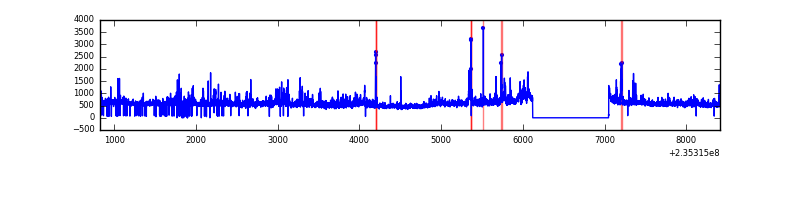 |
| B | 7585 | 6650 | 13 | 13 | 0.17% | 0.20% |  |
| C | 7585 | 6653 | 0 | 0 | 0.00% | 0.00% | 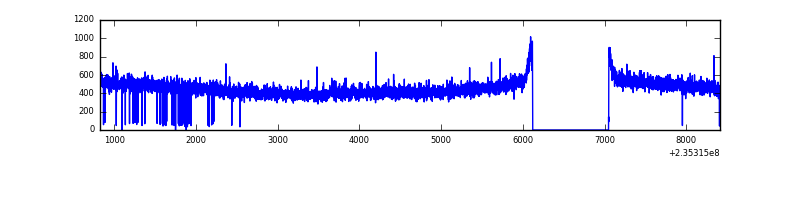 |
| D | 7585 | 6639 | 37 | 37 | 0.49% | 0.56% | 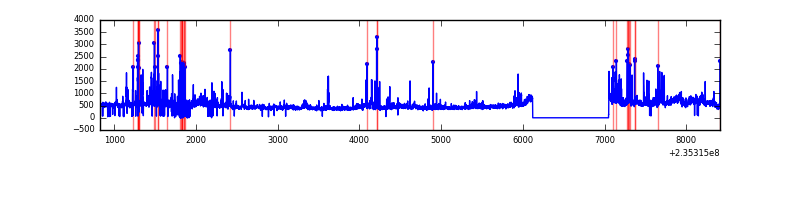 |
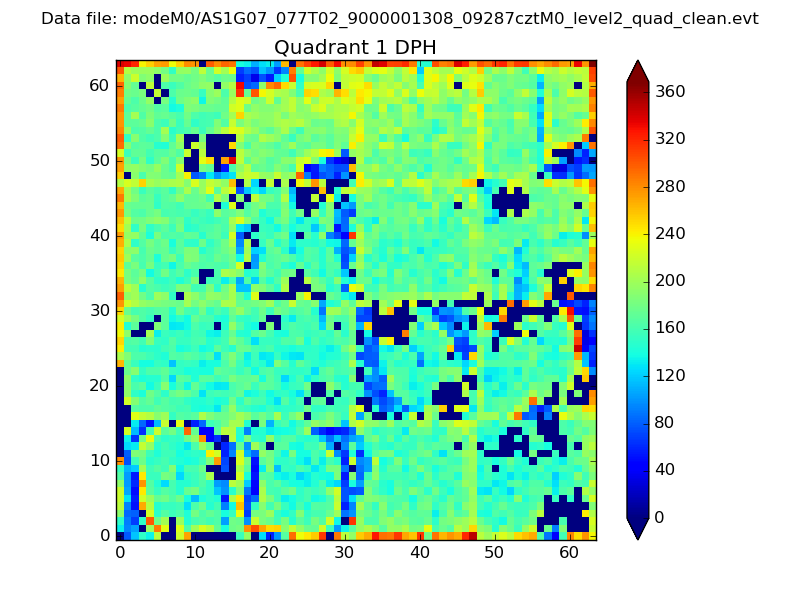
Top three noisy pixels from each quadrant. If the there are fewer than three noisy pixels in the level2.evt file, extra rows are filled as -1
| Pixel properties | Quadrant properties | ||||||
|---|---|---|---|---|---|---|---|
| Quadrant | DetID | PixID | Counts | Sigma | Mean | Median | Sigma |
| A | 8 | 5 | 792373 | 5037.23 | 772 | 757 | 157.2 |
| A | 15 | 239 | 107551 | 679.55 | 772 | 757 | 157.2 |
| A | 1 | 162 | 81242 | 512.14 | 772 | 757 | 157.2 |
| B | 0 | 214 | 140335 | 942.87 | 775 | 756 | 148.0 |
| B | 8 | 234 | 77016 | 515.14 | 775 | 756 | 148.0 |
| B | 0 | 219 | 58311 | 388.79 | 775 | 756 | 148.0 |
| C | 14 | 67 | 7667 | 38.77 | 763 | 767 | 178.0 |
| C | 13 | 61 | 5846 | 28.54 | 763 | 767 | 178.0 |
| C | 5 | 238 | 5320 | 25.58 | 763 | 767 | 178.0 |
| D | 1 | 52 | 288827 | 1509.44 | 755 | 736 | 190.9 |
| D | 12 | 233 | 249960 | 1305.8 | 755 | 736 | 190.9 |
| D | 7 | 71 | 106788 | 555.65 | 755 | 736 | 190.9 |
Histogram calculated using DETX and DETY for each event in the final _common_clean file
| Quadrant A |  |
 |
Quadrant B |
|---|---|---|---|
| Quadrant D | 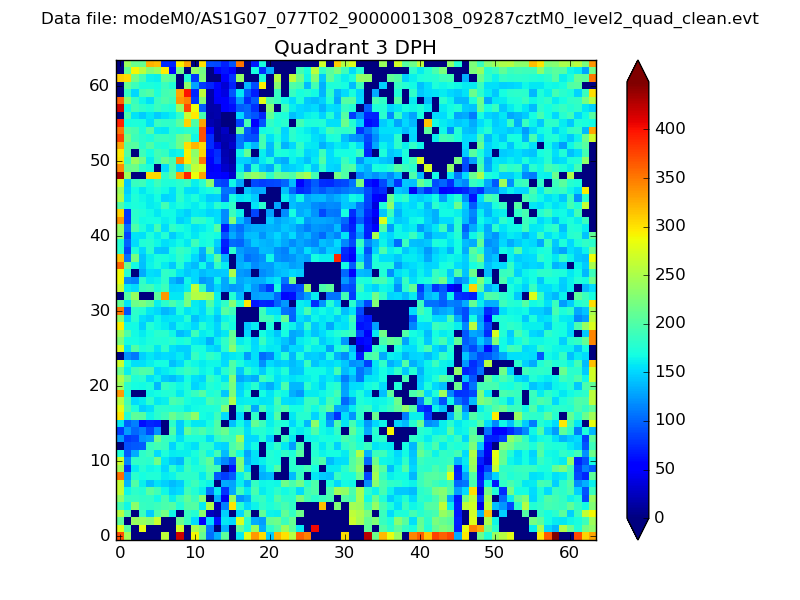 |
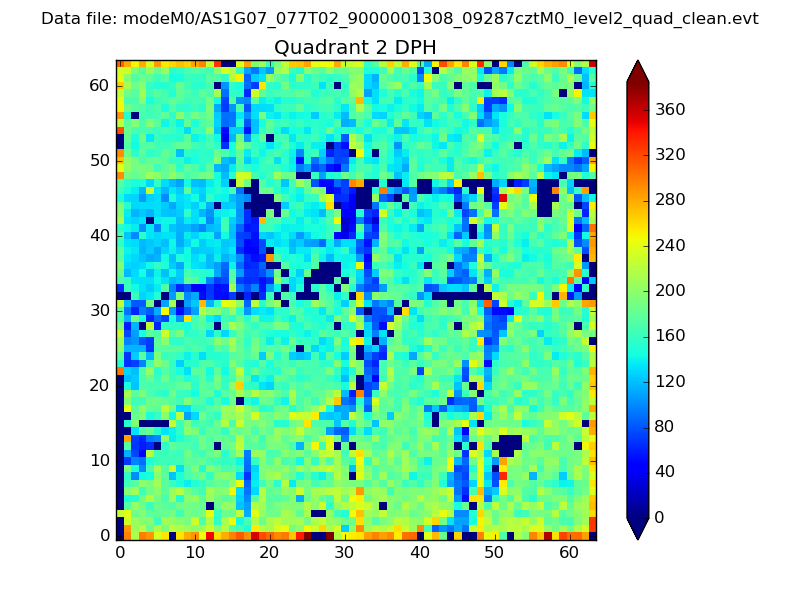 |
Quadrant C |
| Plot type | Count rate plots | Images |
|---|---|---|
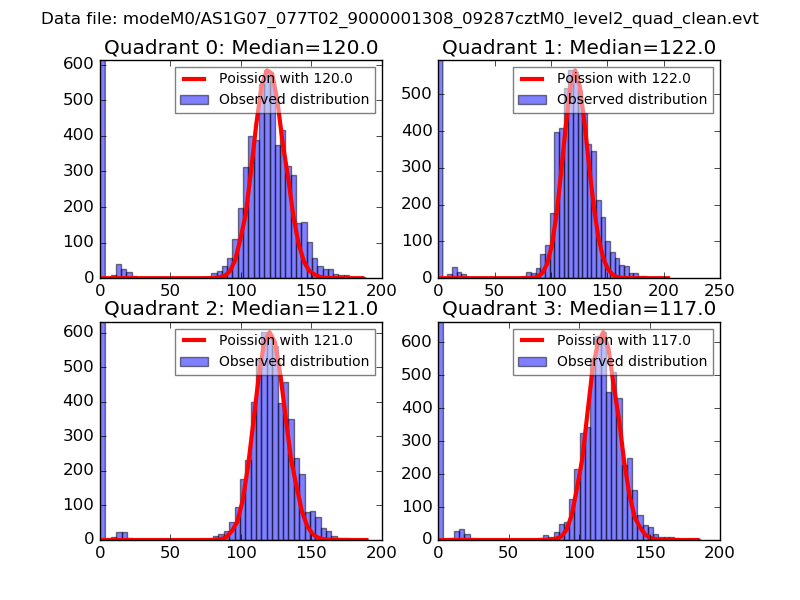
| Comparison with Poisson distribution Blue bars denote a histogram of data divided into 1 sec bins. Red curve is a Poisson curve with rate = median count rate of data. |
 |
 |
| Quadrant-wise count rates Data is divided into 100 sec bins |
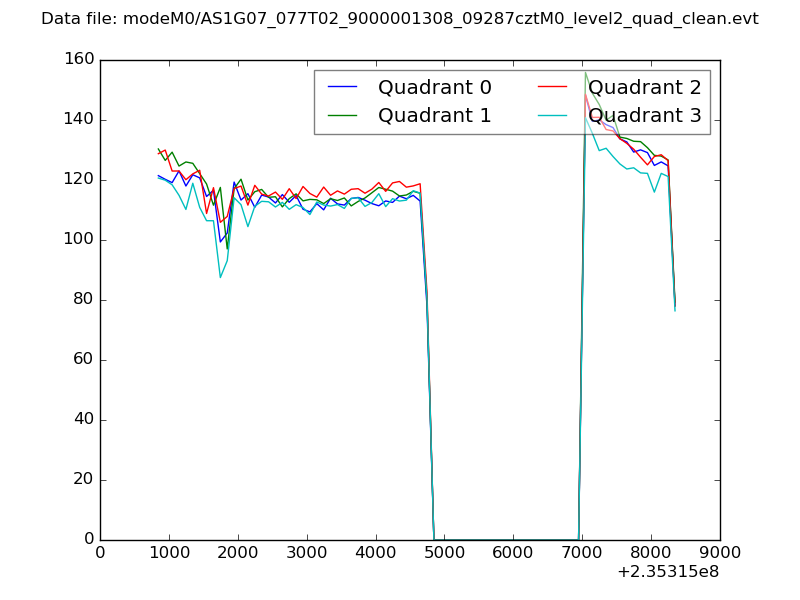 |
|
| Module-wise count rates for Quadrant A Data is divided into 100 sec bins |
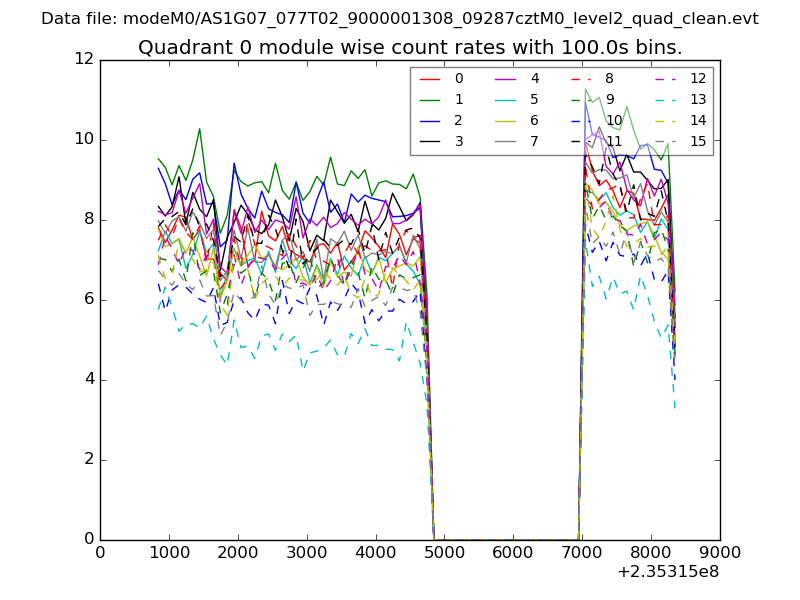 |
 |
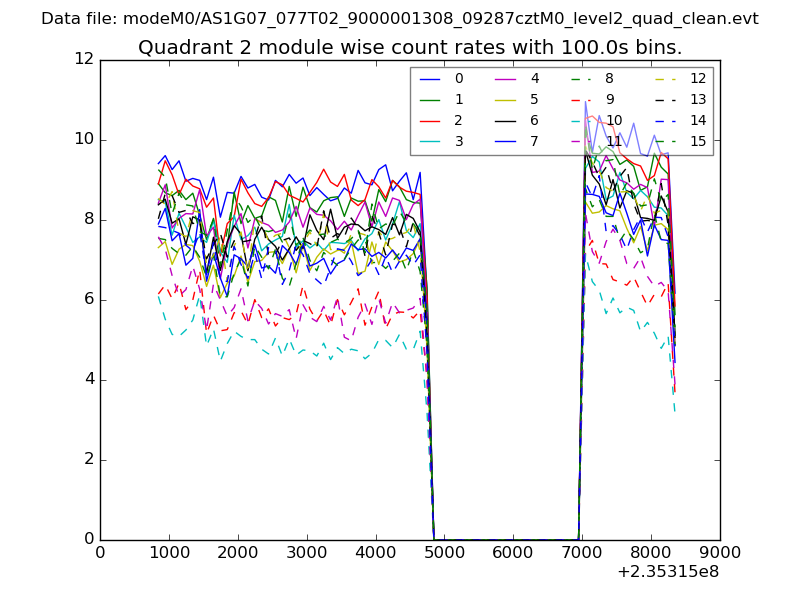
| Module-wise count rates for Quadrant B Data is divided into 100 sec bins |
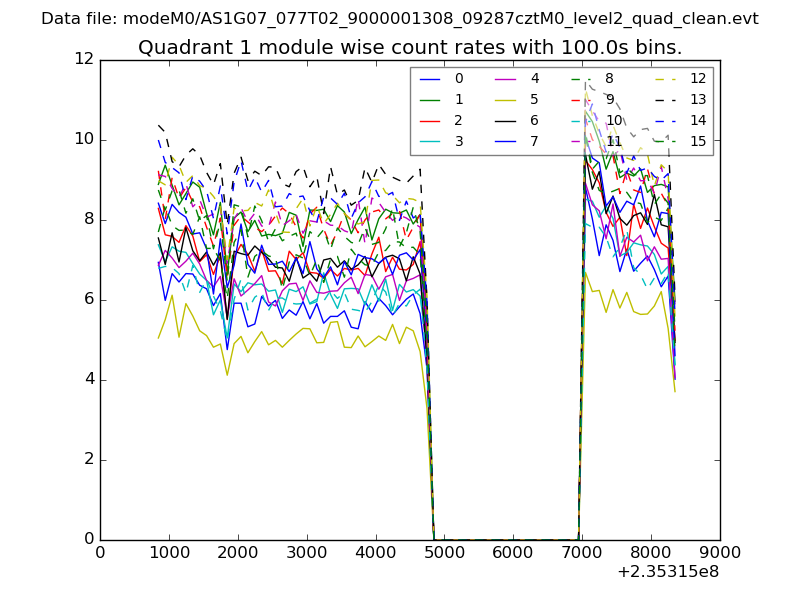 |
 |
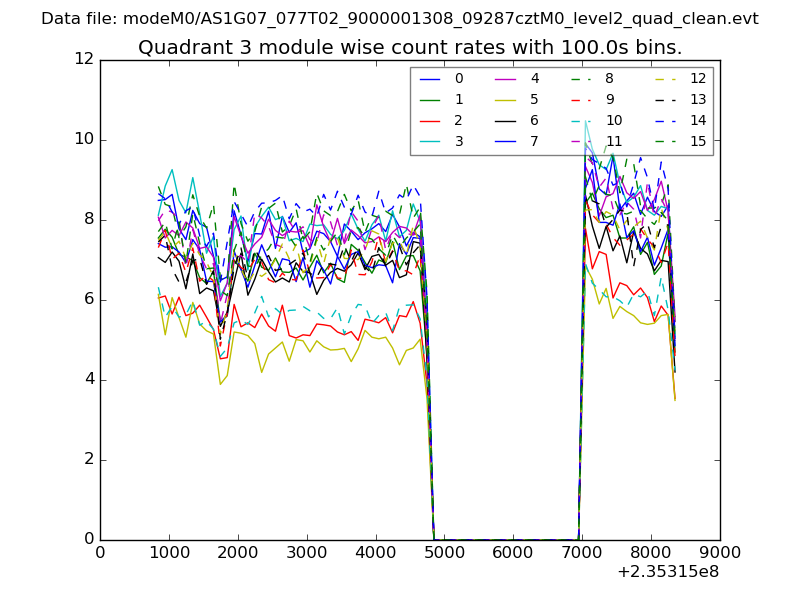
| Module-wise count rates for Quadrant C Data is divided into 100 sec bins |
 |
 |
| Module-wise count rates for Quadrant D Data is divided into 100 sec bins |
 |
 |
| Parameter | Plot |
|---|---|
| CZT HV Monitor | 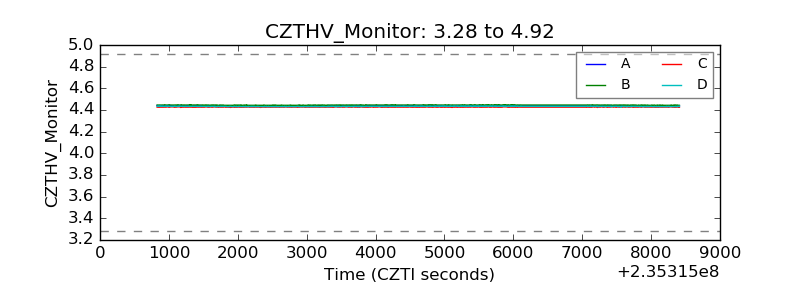 |
| D_VDD | 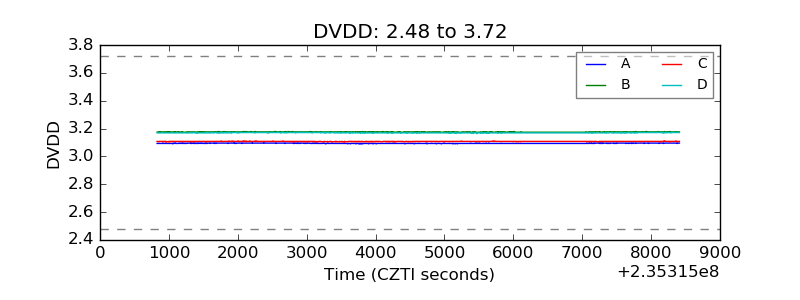 |
| Temperature 1 | 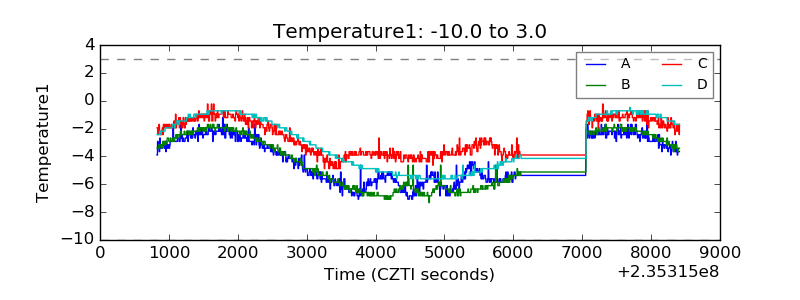 |
| Veto HV Monitor | 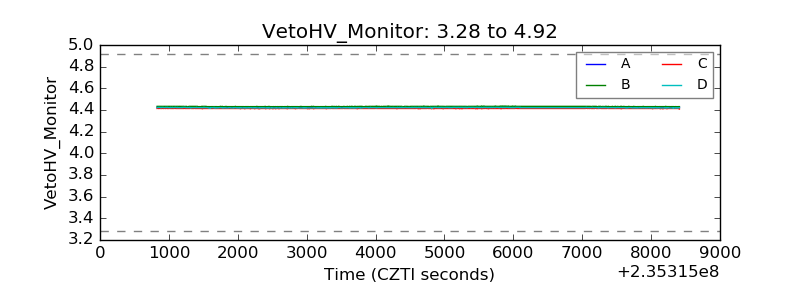 |
| Veto LLD | 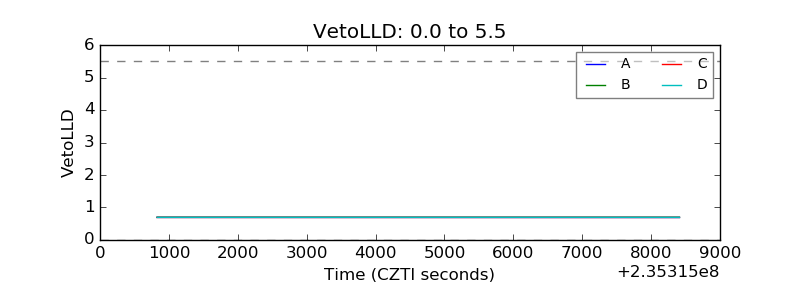 |
| Alpha Counter | 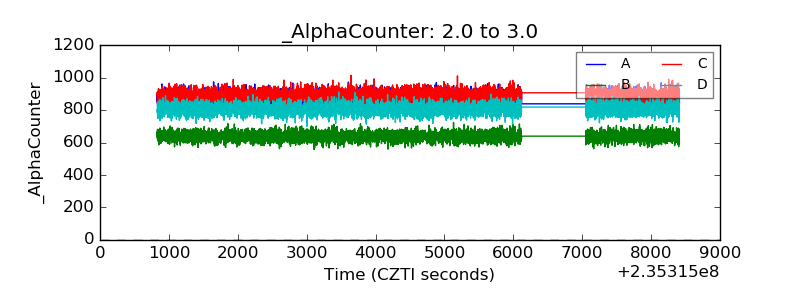 |
| _CPM_Rate | 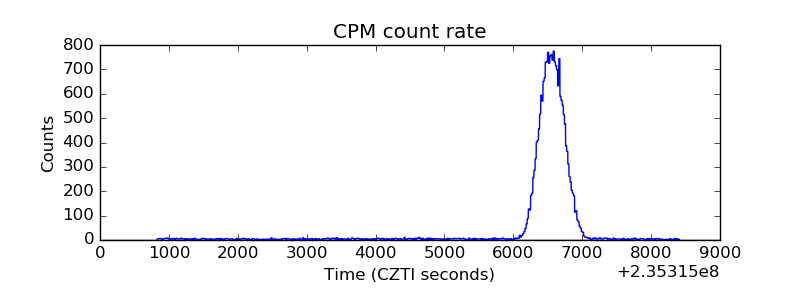 |
| CZT Counter | 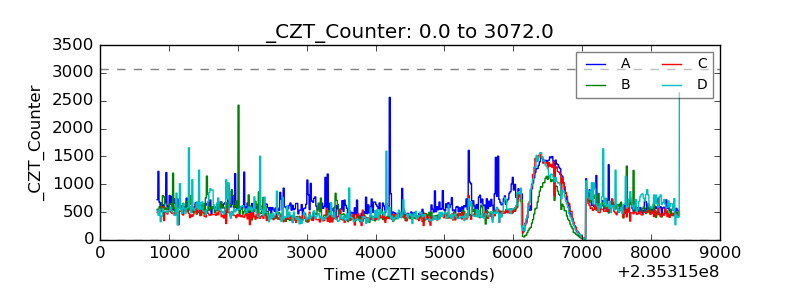 |
| +2.5 Volts monitor |  |
| +5 Volts monitor |  |
| _ROLL_ROT | 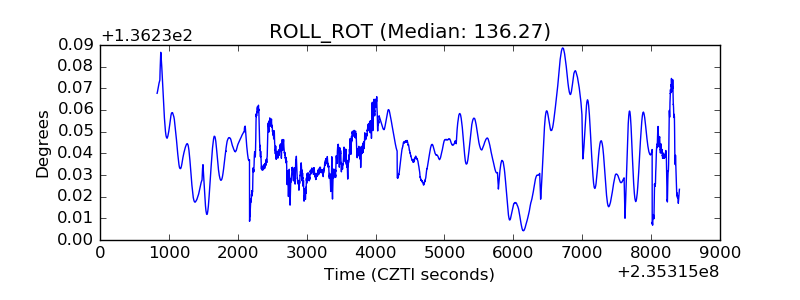 |
| _Roll_DEC | 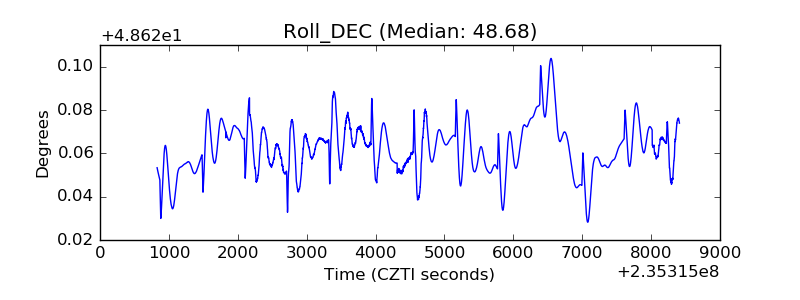 |
| _Roll_RA | 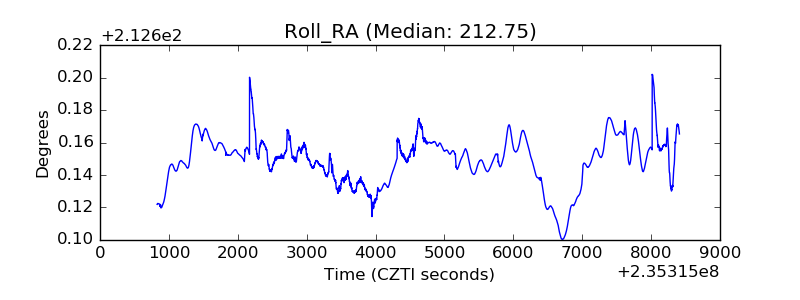 |
| Veto Counter | 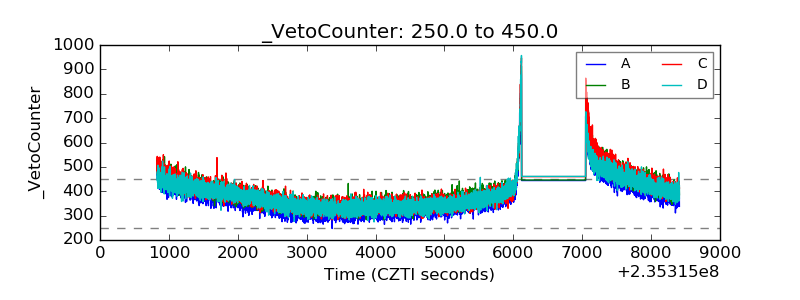 |