| Param | Original file | Final file |
|---|---|---|
| Filename | modeM0/AS1G07_077T02_9000001308_09290cztM0_level2.evt | modeM0/AS1G07_077T02_9000001308_09290cztM0_level2_quad_clean.evt |
| Size (bytes) | 449,844,480 | 84,905,280 |
| Size | 429.0 MB | 81.0 MB |
| Events in quadrant A | 4,381,382 | 529,451 |
| Events in quadrant B | 2,906,789 | 549,938 |
| Events in quadrant C | 2,775,723 | 552,246 |
| Events in quadrant D | 3,157,272 | 525,550 |
| Mode M0 | |||
|---|---|---|---|
| Quadrant | BADHDUFLAG | Total packets | Discarded packets |
| A | 0 | 17129 | 2 |
| B | 0 | 12665 | 2 |
| C | 0 | 12359 | 6 |
| D | 0 | 13415 | 2 |
| Mode SS | |||
|---|---|---|---|
| Quadrant | BADHDUFLAG | Total packets | Discarded packets |
| A | 0 | 120 | 0 |
| B | 0 | 120 | 0 |
| C | 0 | 120 | 0 |
| D | 0 | 120 | 0 |
| Mode M9 | |||
|---|---|---|---|
| Quadrant | BADHDUFLAG | Total packets | Discarded packets |
| A | 0 | 14 | 0 |
| B | 0 | 14 | 0 |
| C | 0 | 14 | 0 |
| D | 0 | 15 | 0 |
| Quadrant | Total seconds | Saturated seconds | Saturation percentage |
|---|---|---|---|
| A | 5927 | 167 | 2.817614% |
| B | 5927 | 43 | 0.725494% |
| C | 5925 | 35 | 0.590717% |
| D | 5927 | 69 | 1.164164% |
Noise dominated data is calculated using 1-second bins in cleaned event files. If a bin has >2000 counts, and if more than 50% of those come from <1% of pixels, then it is considered to be noise-dominated and hence unusable.
| Quadrant | # 1 sec bins | Bins with >0 counts | Bins with >2000 counts | High rate bins dominated by noise | Noise dominated (total time) | Noise dominated (detector-on time) | Marked lightcurve |
|---|---|---|---|---|---|---|---|
| A | 7132 | 5928 | 92 | 92 | 1.29% | 1.55% | 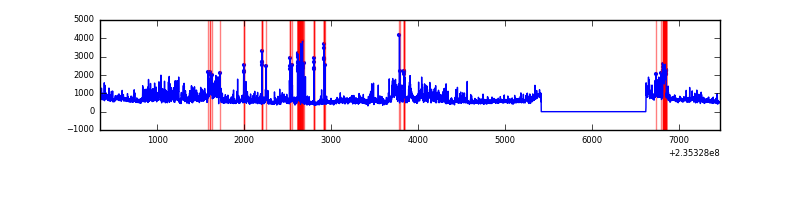 |
| B | 7132 | 5928 | 0 | 0 | 0.00% | 0.00% | 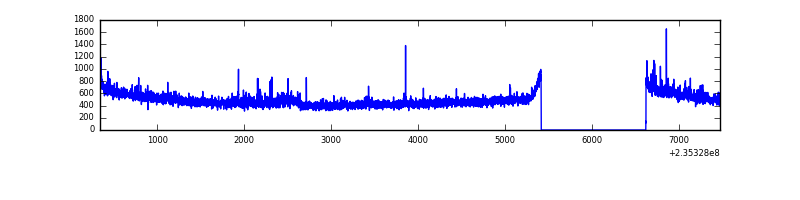 |
| C | 7132 | 5928 | 0 | 0 | 0.00% | 0.00% | 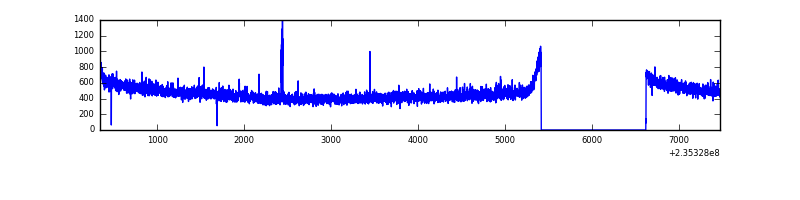 |
| D | 7132 | 5928 | 21 | 21 | 0.29% | 0.35% | 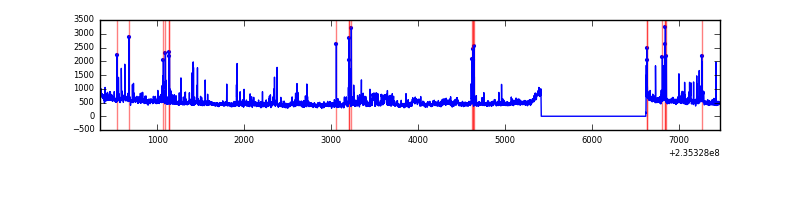 |
Top three noisy pixels from each quadrant. If the there are fewer than three noisy pixels in the level2.evt file, extra rows are filled as -1
| Pixel properties | Quadrant properties | ||||||
|---|---|---|---|---|---|---|---|
| Quadrant | DetID | PixID | Counts | Sigma | Mean | Median | Sigma |
| A | 8 | 5 | 1267916 | 8900.38 | 704 | 689 | 142.4 |
| A | 15 | 223 | 93106 | 649.09 | 704 | 689 | 142.4 |
| A | 15 | 239 | 78469 | 546.29 | 704 | 689 | 142.4 |
| B | 0 | 219 | 48861 | 358.79 | 715 | 699 | 134.2 |
| B | 0 | 245 | 24529 | 177.53 | 715 | 699 | 134.2 |
| B | 4 | 80 | 16461 | 117.42 | 715 | 699 | 134.2 |
| C | 10 | 22 | 17671 | 105.48 | 703 | 706 | 160.8 |
| C | 14 | 67 | 10675 | 61.98 | 703 | 706 | 160.8 |
| C | 13 | 61 | 5262 | 28.33 | 703 | 706 | 160.8 |
| D | 1 | 52 | 212456 | 1170.68 | 694 | 675 | 180.9 |
| D | 7 | 71 | 171885 | 946.41 | 694 | 675 | 180.9 |
| D | 2 | 152 | 49874 | 271.96 | 694 | 675 | 180.9 |
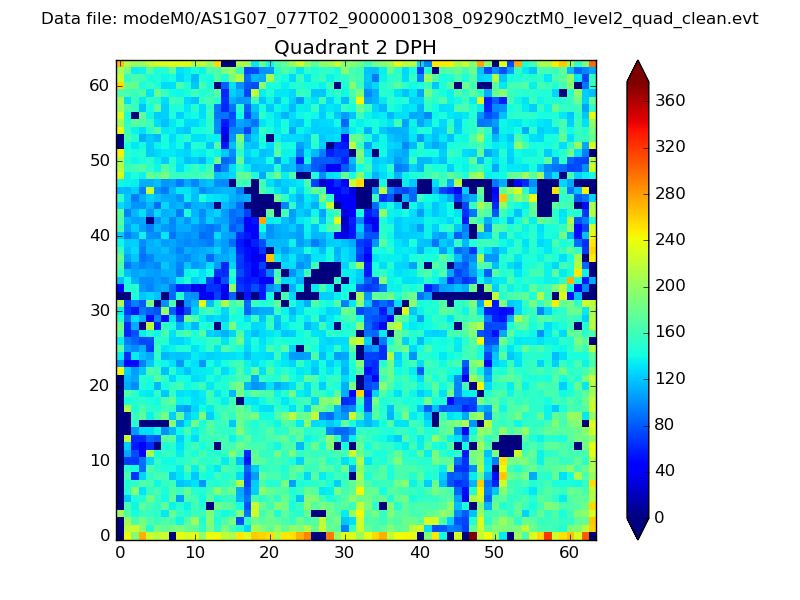
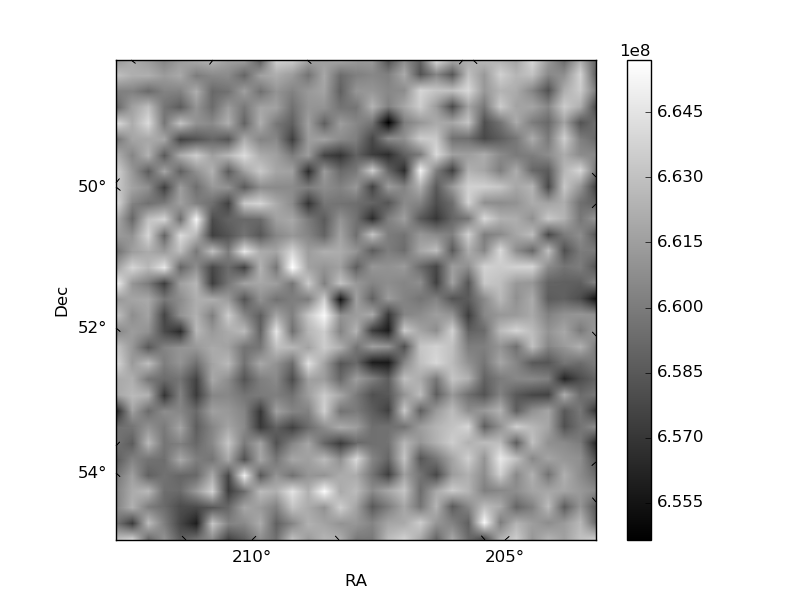
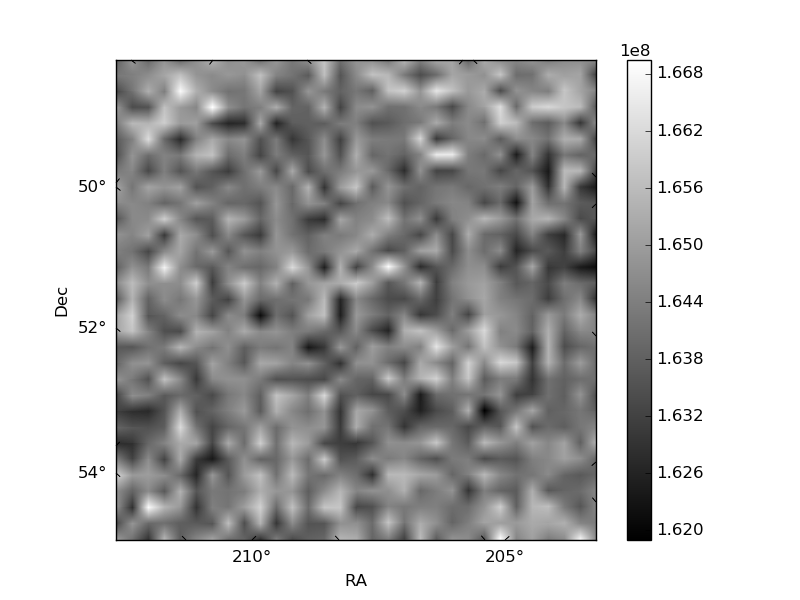
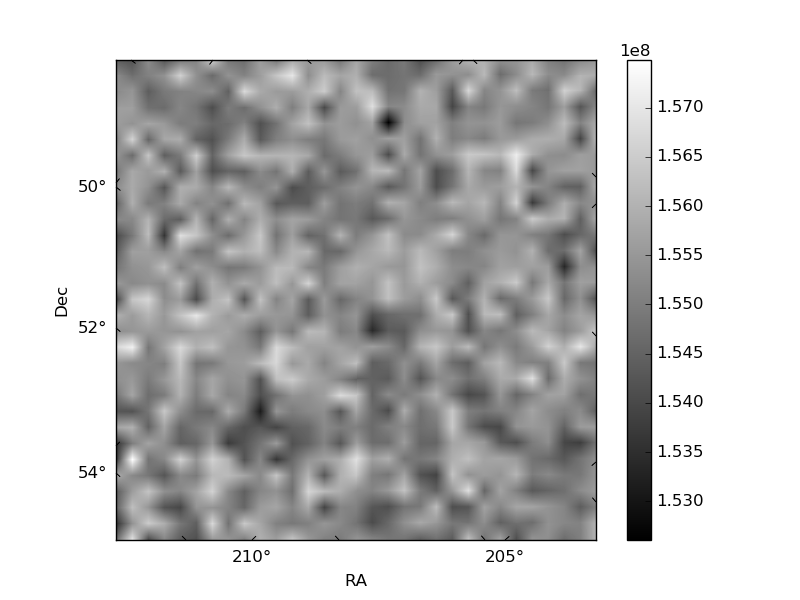
Histogram calculated using DETX and DETY for each event in the final _common_clean file
| Quadrant A | 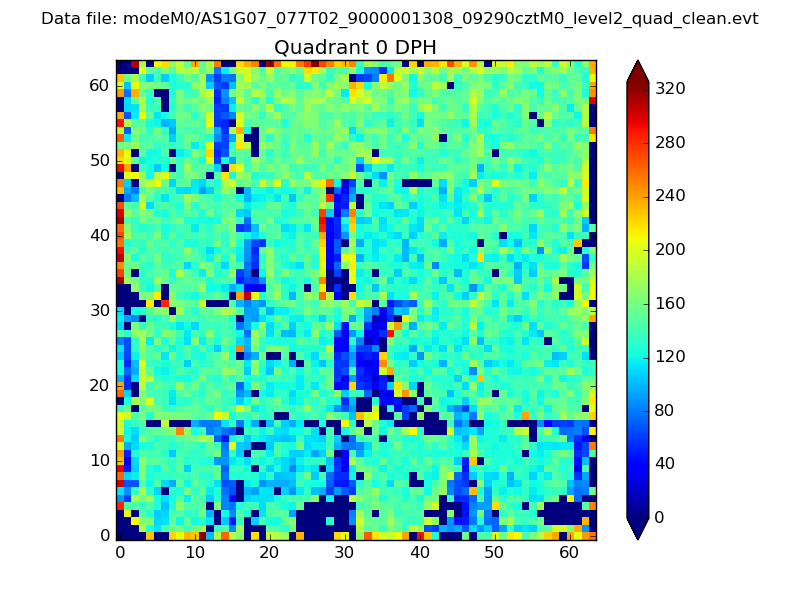 |
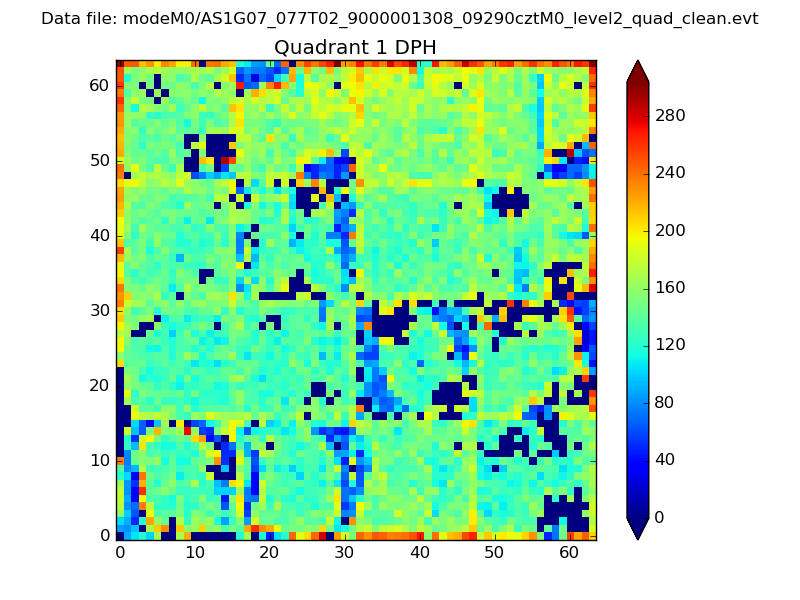 |
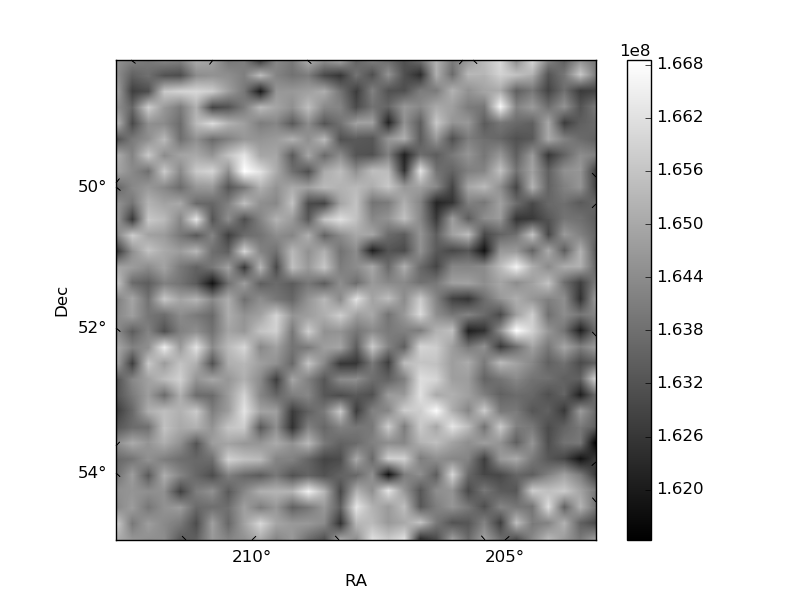
Quadrant B |
|---|---|---|---|
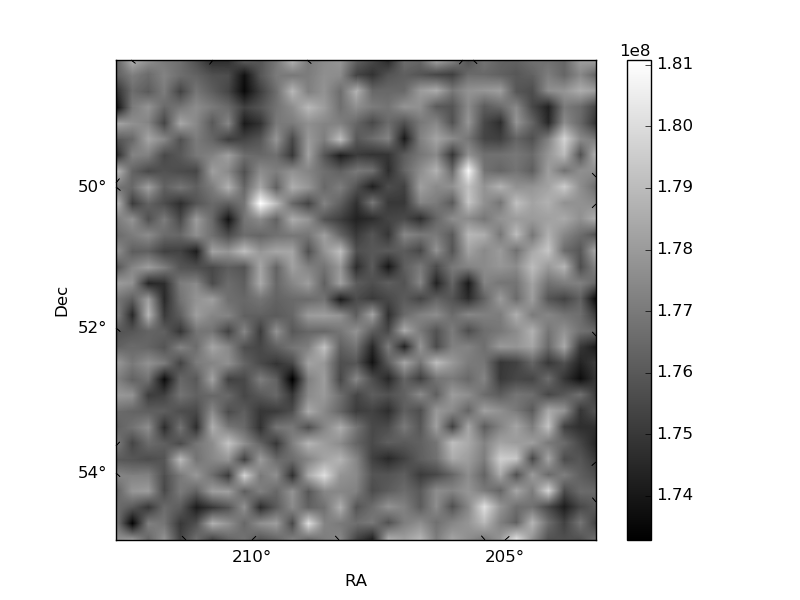
| Quadrant D | 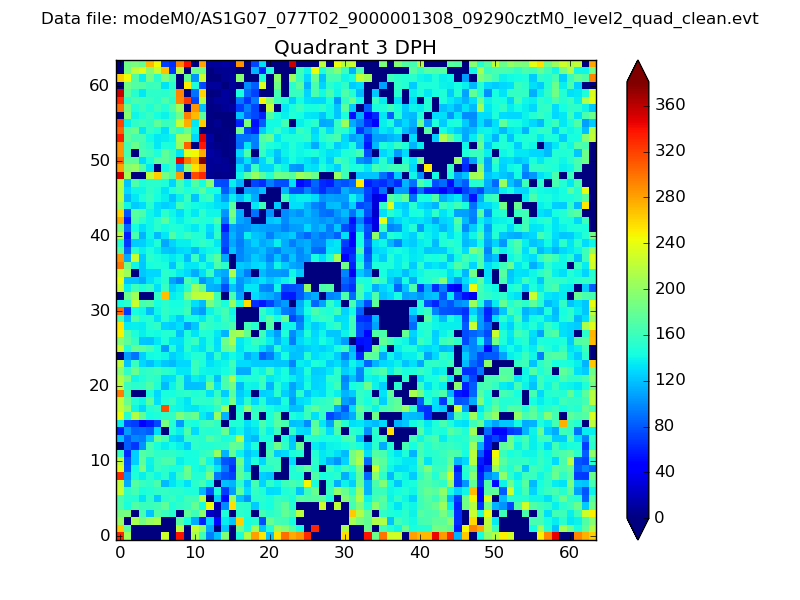 |
 |
Quadrant C |
| Plot type | Count rate plots | Images |
|---|---|---|
| Comparison with Poisson distribution Blue bars denote a histogram of data divided into 1 sec bins. Red curve is a Poisson curve with rate = median count rate of data. |
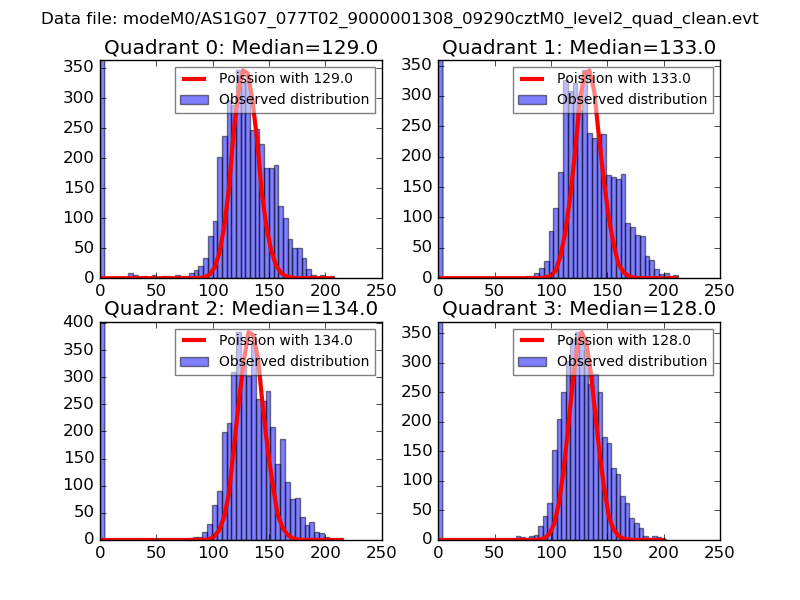 |
 |
| Quadrant-wise count rates Data is divided into 100 sec bins |
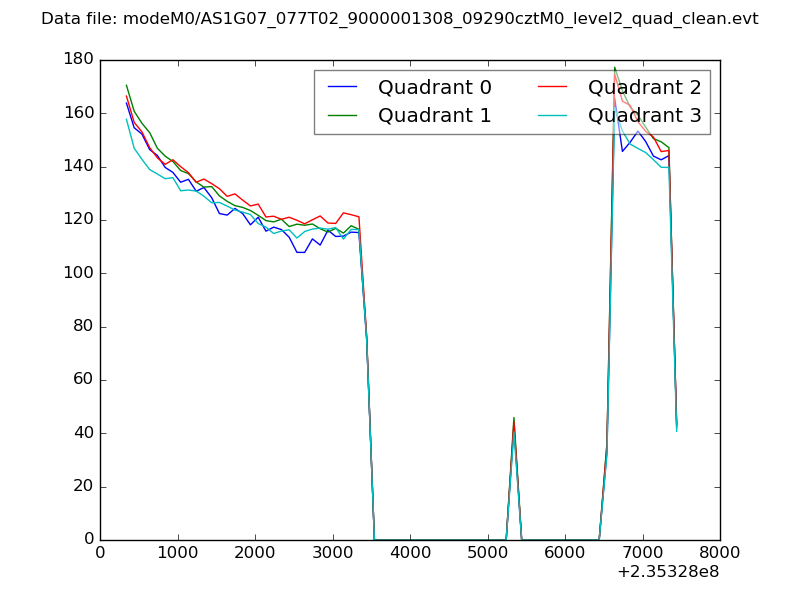 |
|
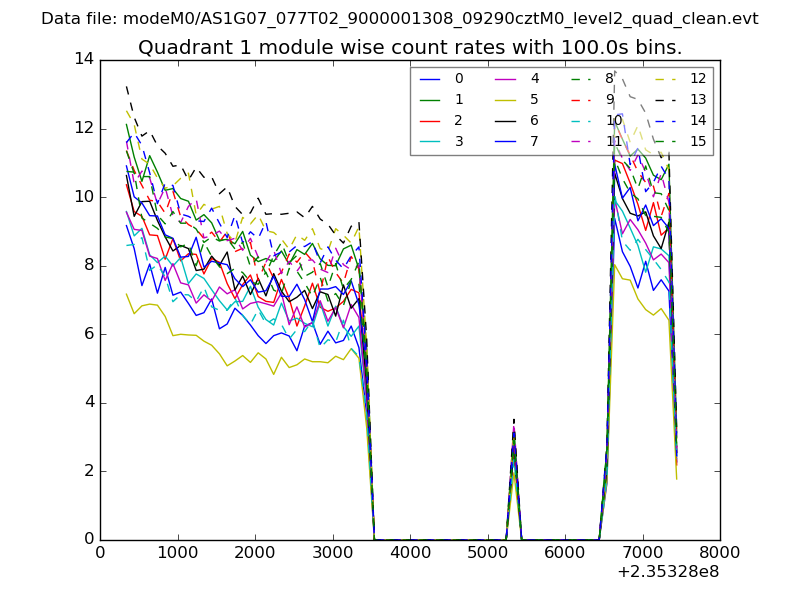
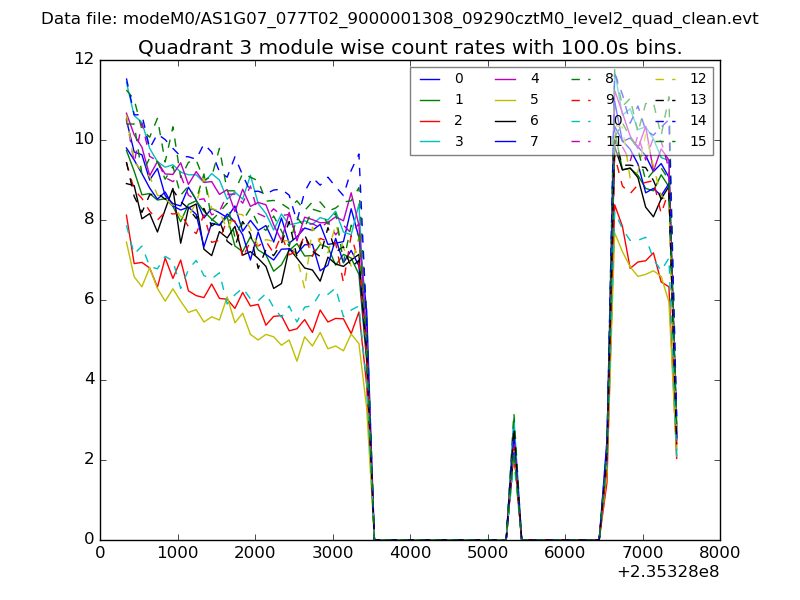
| Module-wise count rates for Quadrant A Data is divided into 100 sec bins |
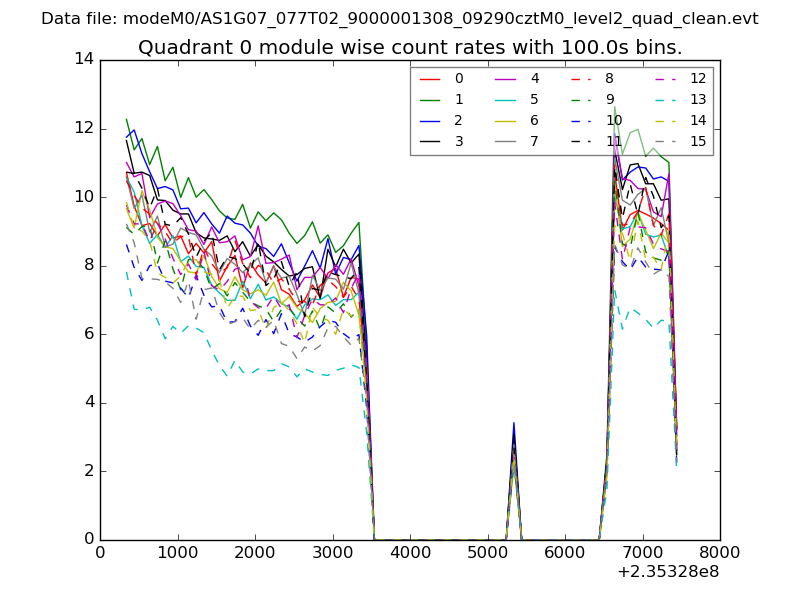 |
 |
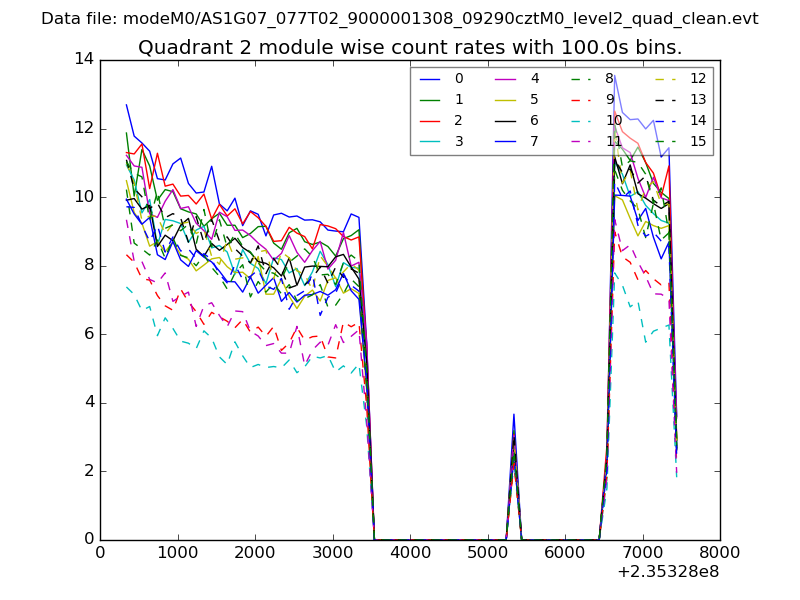
| Module-wise count rates for Quadrant B Data is divided into 100 sec bins |
 |
 |
| Module-wise count rates for Quadrant C Data is divided into 100 sec bins |
 |
 |
| Module-wise count rates for Quadrant D Data is divided into 100 sec bins |
 |
 |
| Parameter | Plot |
|---|---|
| CZT HV Monitor | 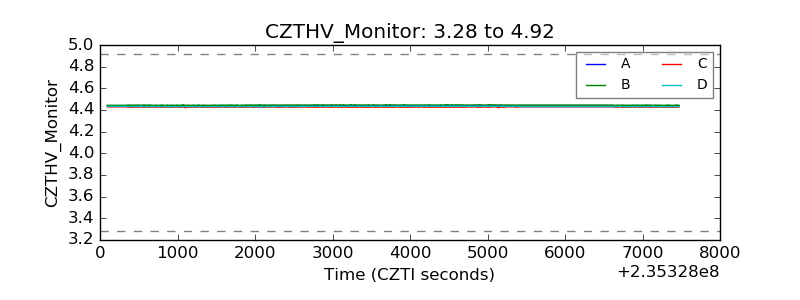 |
| D_VDD | 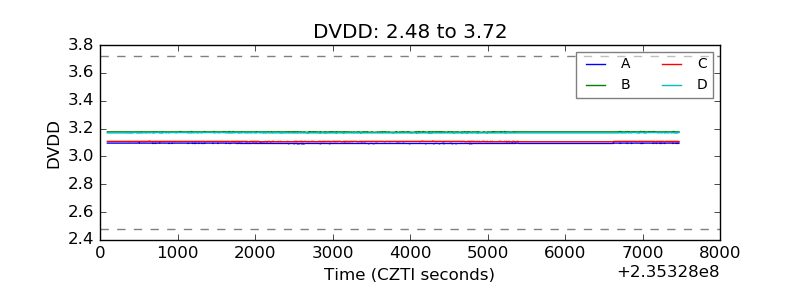 |
| Temperature 1 | 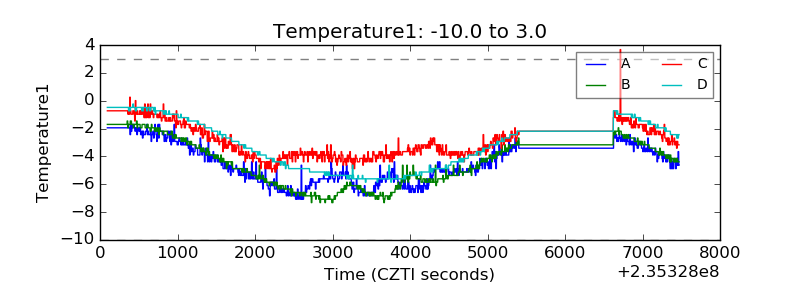 |
| Veto HV Monitor |  |
| Veto LLD | 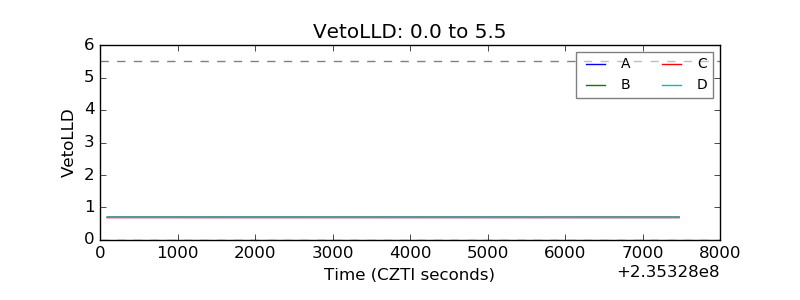 |
| Alpha Counter | 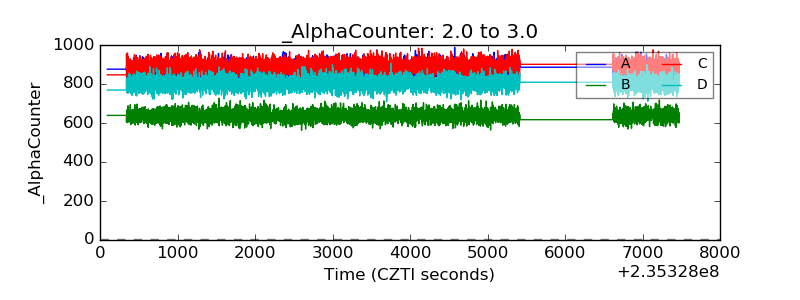 |
| _CPM_Rate | 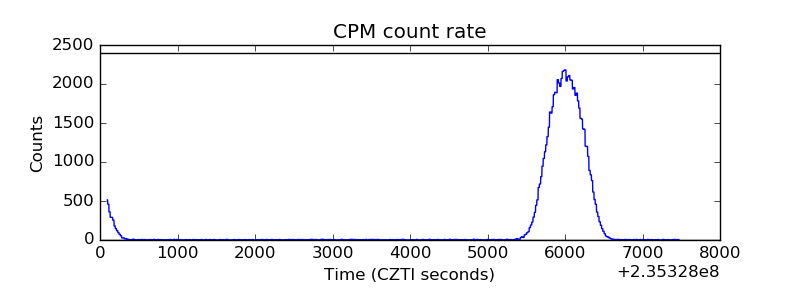 |
| CZT Counter |  |
| +2.5 Volts monitor |  |
| +5 Volts monitor |  |
| _ROLL_ROT | 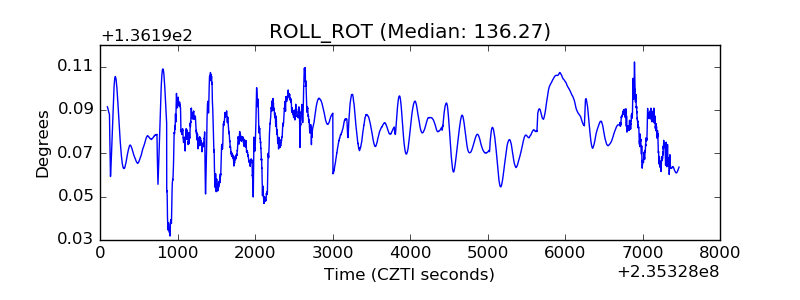 |
| _Roll_DEC | 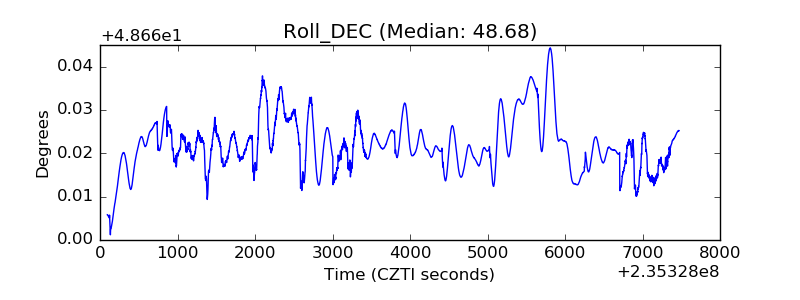 |
| _Roll_RA |  |
| Veto Counter | 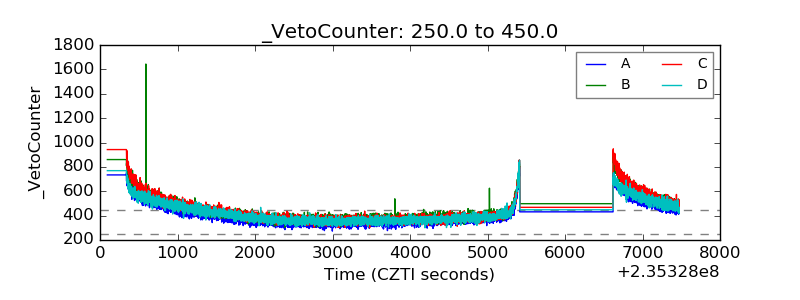 |