| Param | Original file | Final file |
|---|---|---|
| Filename | modeM0/AS1G07_077T02_9000001308_09291cztM0_level2.evt | modeM0/AS1G07_077T02_9000001308_09291cztM0_level2_quad_clean.evt |
| Size (bytes) | 1,836,610,560 | 342,717,120 |
| Size | 1.7 GB | 326.8 MB |
| Events in quadrant A | 16,484,586 | 2,158,909 |
| Events in quadrant B | 12,120,964 | 2,207,247 |
| Events in quadrant C | 11,133,270 | 2,203,293 |
| Events in quadrant D | 14,211,803 | 2,107,977 |
| Mode M0 | |||
|---|---|---|---|
| Quadrant | BADHDUFLAG | Total packets | Discarded packets |
| A | 0 | 66069 | 407 |
| B | 0 | 53183 | 261 |
| C | 0 | 50795 | 190 |
| D | 0 | 59543 | 279 |
| Mode SS | |||
|---|---|---|---|
| Quadrant | BADHDUFLAG | Total packets | Discarded packets |
| A | 0 | 506 | 2 |
| B | 0 | 506 | 2 |
| C | 0 | 506 | 2 |
| D | 0 | 506 | 0 |
| Mode M9 | |||
|---|---|---|---|
| Quadrant | BADHDUFLAG | Total packets | Discarded packets |
| A | 0 | 39 | 0 |
| B | 0 | 39 | 0 |
| C | 0 | 39 | 0 |
| D | 0 | 39 | 0 |
| Quadrant | Total seconds | Saturated seconds | Saturation percentage |
|---|---|---|---|
| A | 24740 | 957 | 3.868230% |
| B | 24762 | 301 | 1.215572% |
| C | 24781 | 188 | 0.758646% |
| D | 24765 | 595 | 2.402584% |
Noise dominated data is calculated using 1-second bins in cleaned event files. If a bin has >2000 counts, and if more than 50% of those come from <1% of pixels, then it is considered to be noise-dominated and hence unusable.
| Quadrant | # 1 sec bins | Bins with >0 counts | Bins with >2000 counts | High rate bins dominated by noise | Noise dominated (total time) | Noise dominated (detector-on time) | Marked lightcurve |
|---|---|---|---|---|---|---|---|
| A | 34478 | 24848 | 344 | 344 | 1.00% | 1.38% | 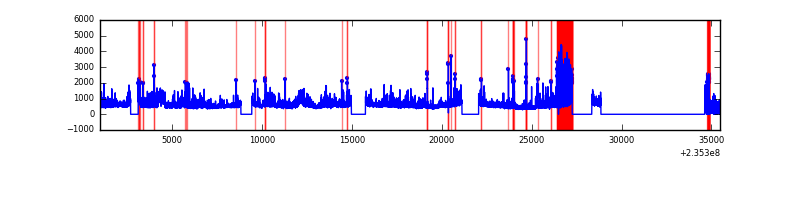 |
| B | 34479 | 24856 | 20 | 20 | 0.06% | 0.08% | 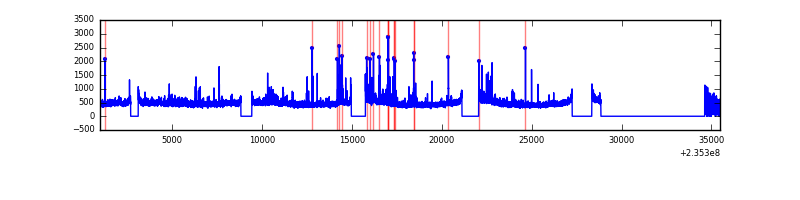 |
| C | 34479 | 24856 | 0 | 0 | 0.00% | 0.00% |  |
| D | 34479 | 24853 | 268 | 268 | 0.78% | 1.08% | 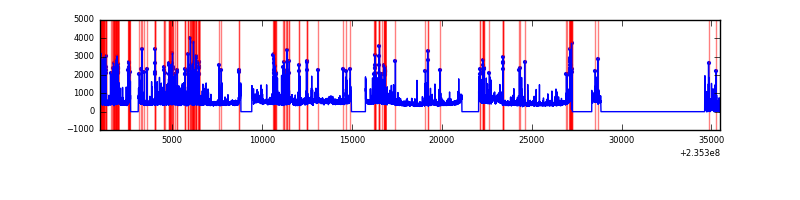 |
Top three noisy pixels from each quadrant. If the there are fewer than three noisy pixels in the level2.evt file, extra rows are filled as -1
| Pixel properties | Quadrant properties | ||||||
|---|---|---|---|---|---|---|---|
| Quadrant | DetID | PixID | Counts | Sigma | Mean | Median | Sigma |
| A | 8 | 5 | 3848126 | 6707.39 | 2844 | 2782 | 573.3 |
| A | 15 | 223 | 776771 | 1350.06 | 2844 | 2782 | 573.3 |
| A | 15 | 239 | 434877 | 753.7 | 2844 | 2782 | 573.3 |
| B | 0 | 214 | 261169 | 474.22 | 2898 | 2828 | 544.8 |
| B | 8 | 234 | 206293 | 373.48 | 2898 | 2828 | 544.8 |
| B | 0 | 219 | 123708 | 221.89 | 2898 | 2828 | 544.8 |
| C | 14 | 67 | 32269 | 44.84 | 2838 | 2848 | 656.1 |
| C | 13 | 61 | 21590 | 28.56 | 2838 | 2848 | 656.1 |
| C | 12 | 4 | 15298 | 18.97 | 2838 | 2848 | 656.1 |
| D | 1 | 52 | 1980997 | 2843.21 | 2794 | 2724 | 695.8 |
| D | 12 | 233 | 749589 | 1073.41 | 2794 | 2724 | 695.8 |
| D | 7 | 71 | 379999 | 542.23 | 2794 | 2724 | 695.8 |
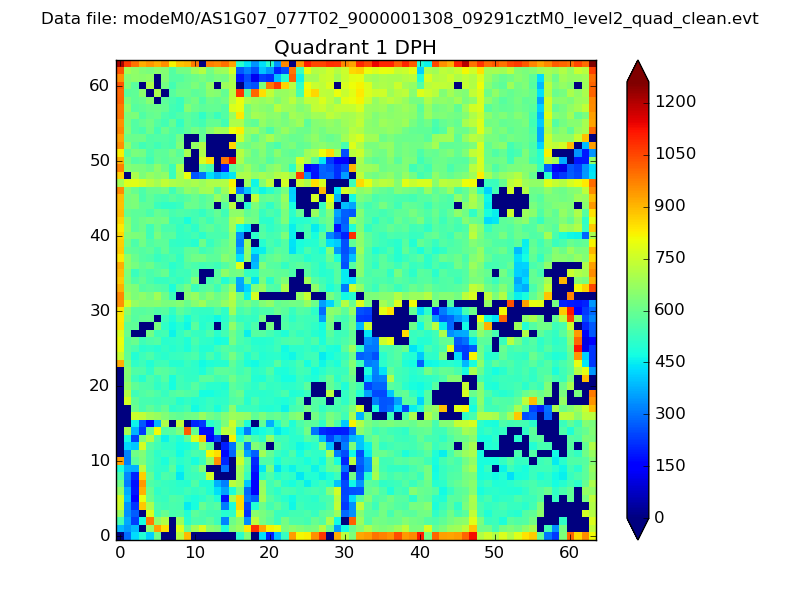
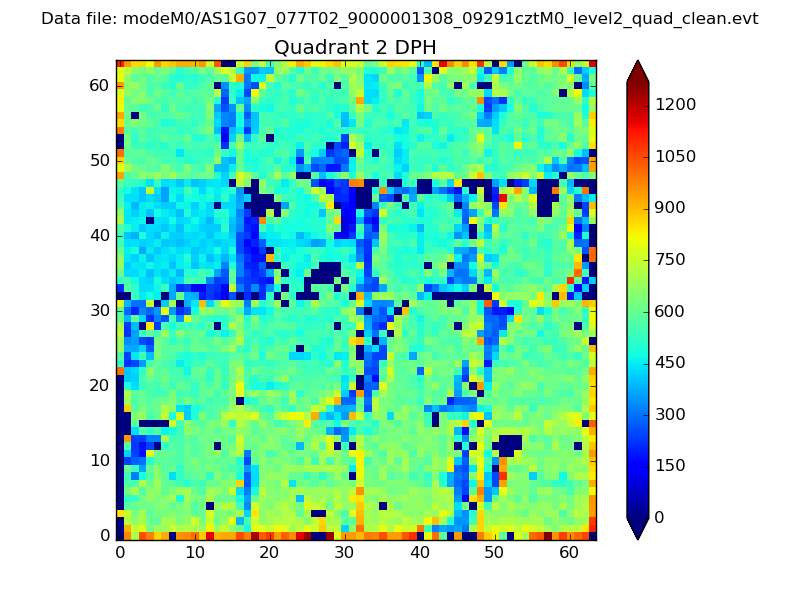
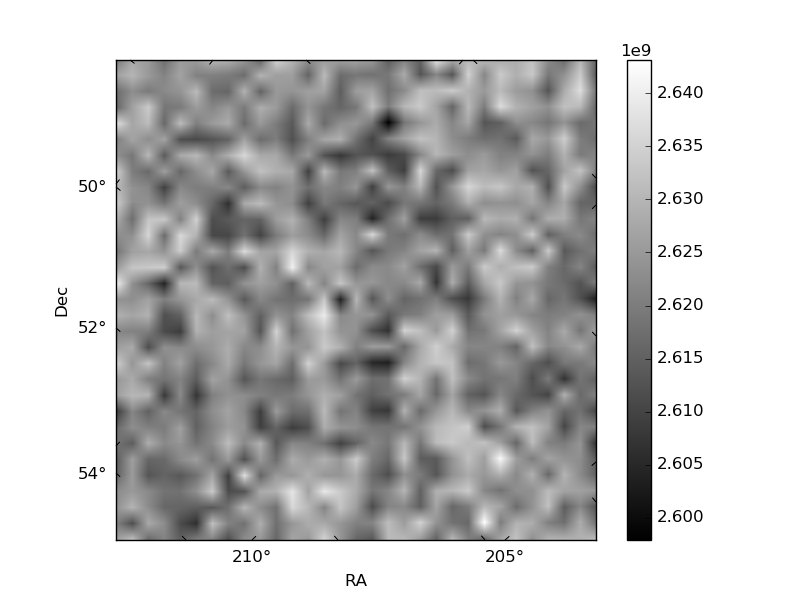
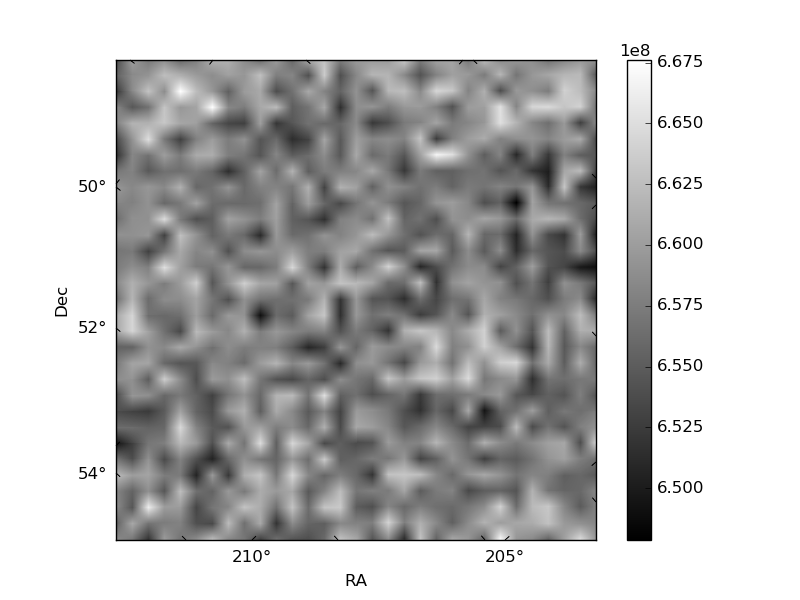
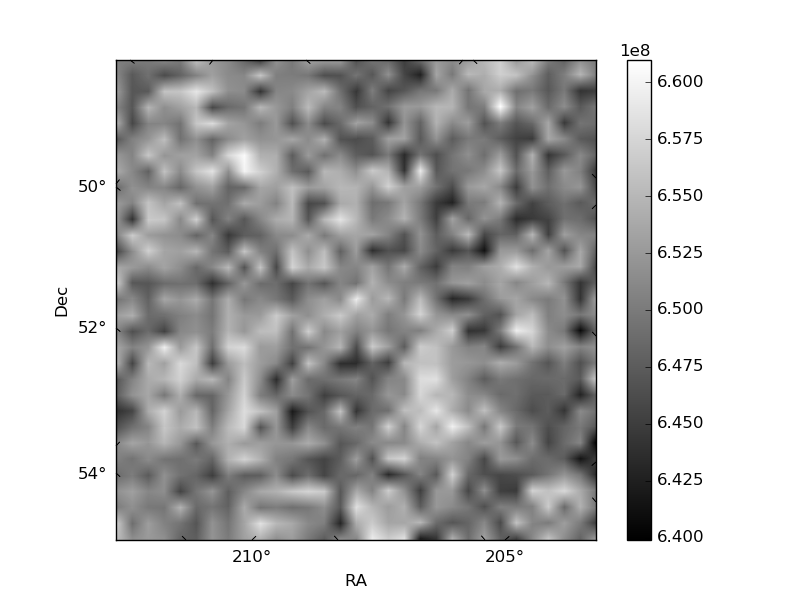
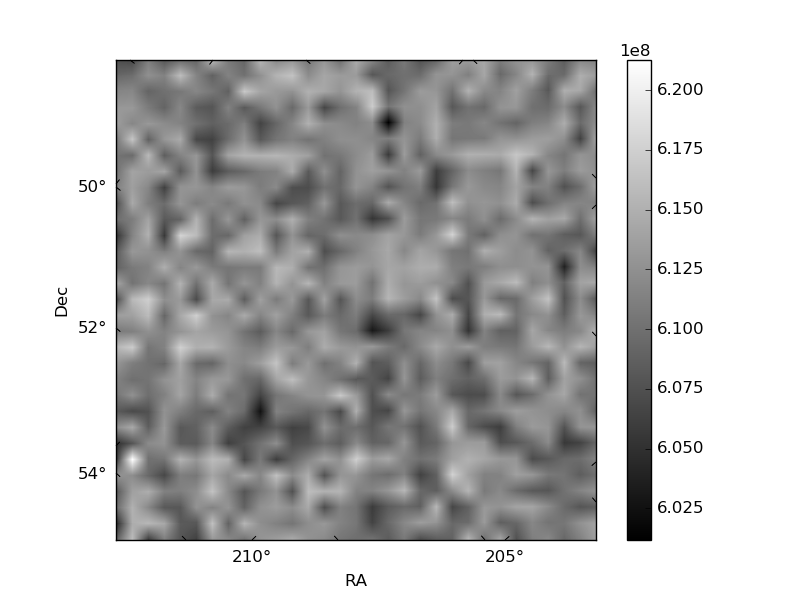
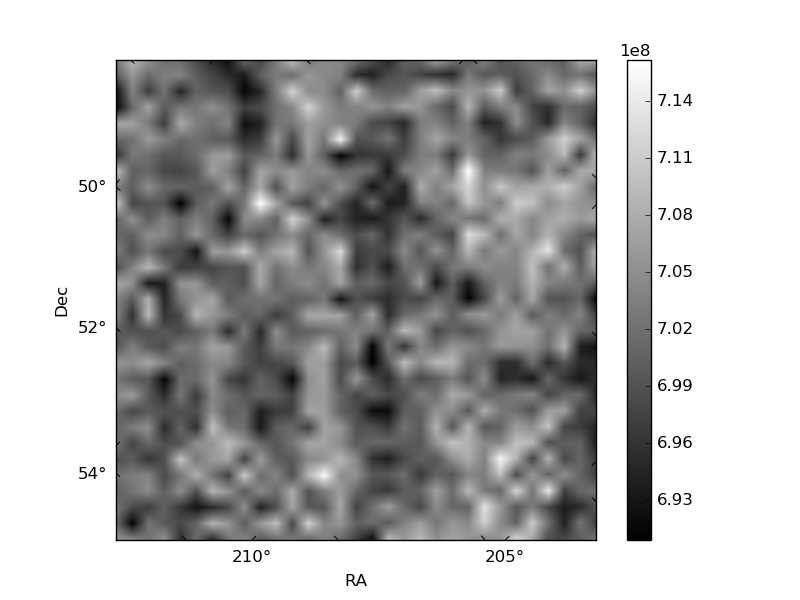
Histogram calculated using DETX and DETY for each event in the final _common_clean file
| Quadrant A | 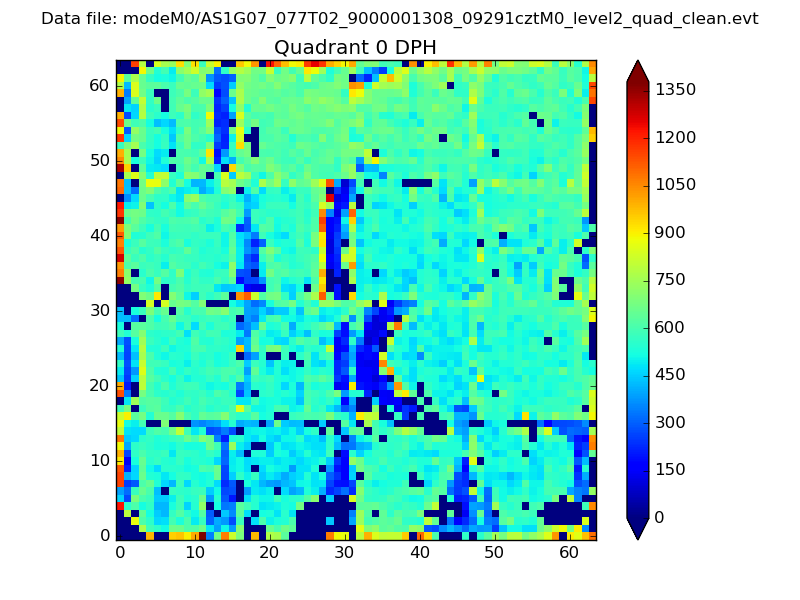 |
 |
Quadrant B |
|---|---|---|---|
| Quadrant D | 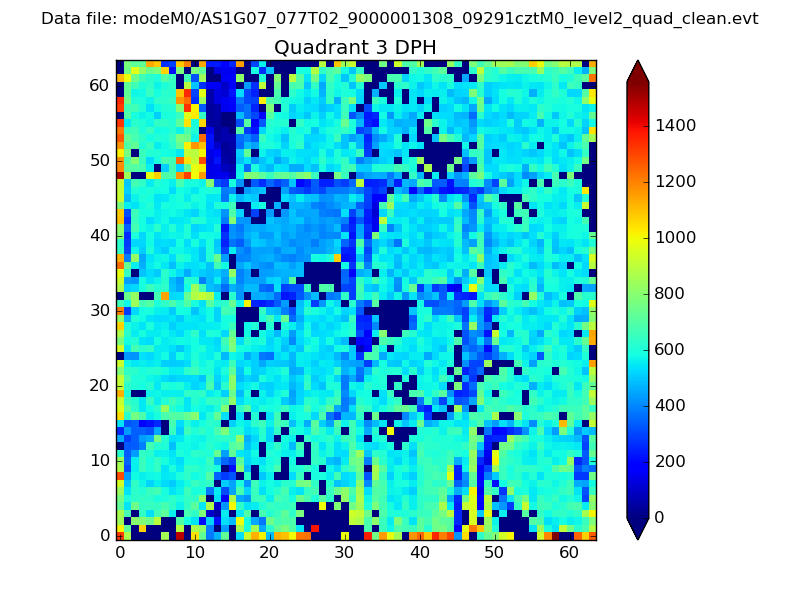 |
 |
Quadrant C |
| Plot type | Count rate plots | Images |
|---|---|---|
| Comparison with Poisson distribution Blue bars denote a histogram of data divided into 1 sec bins. Red curve is a Poisson curve with rate = median count rate of data. |
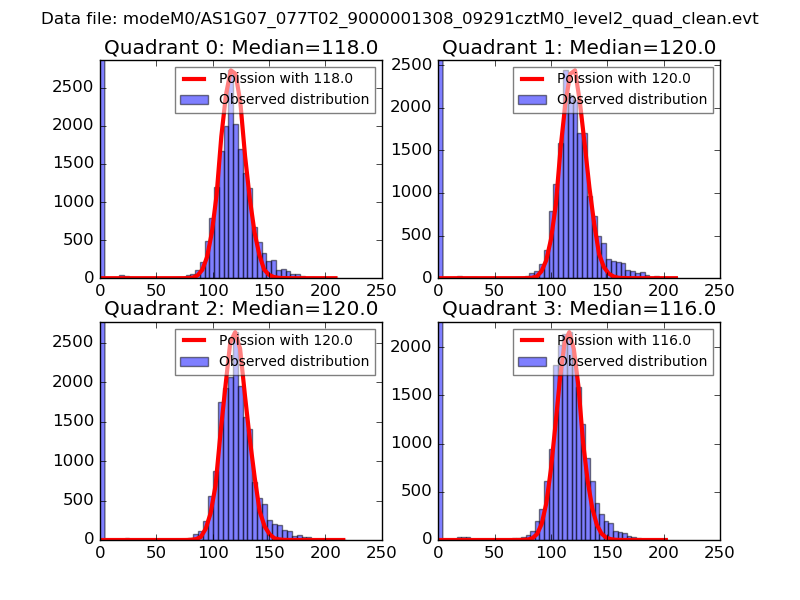 |
 |
| Quadrant-wise count rates Data is divided into 100 sec bins |
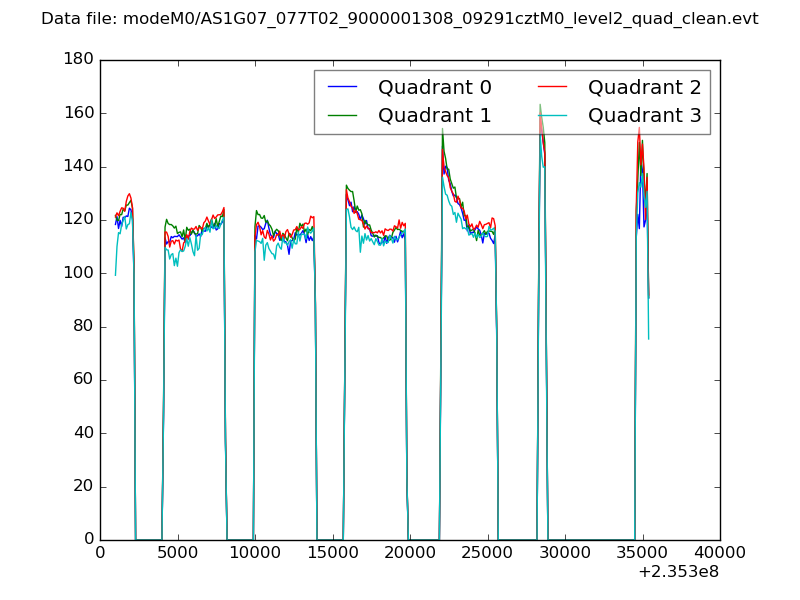 |
|
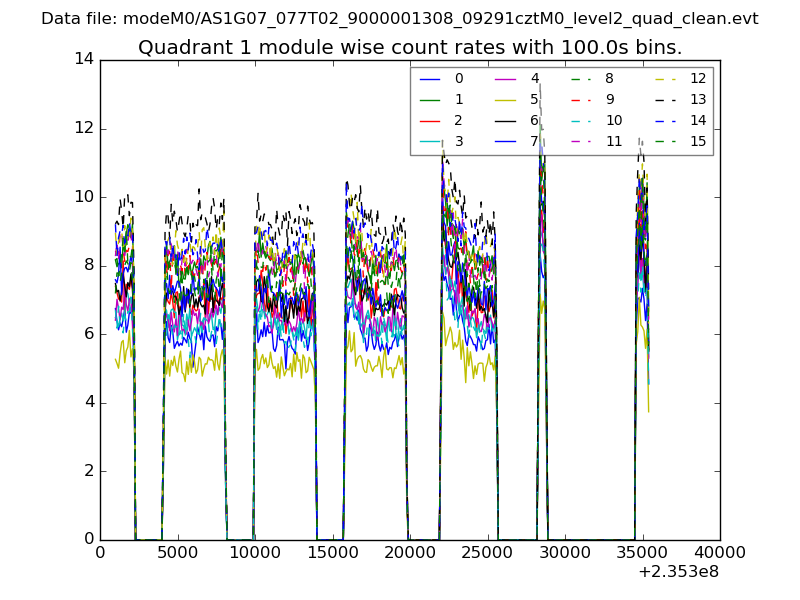
| Module-wise count rates for Quadrant A Data is divided into 100 sec bins |
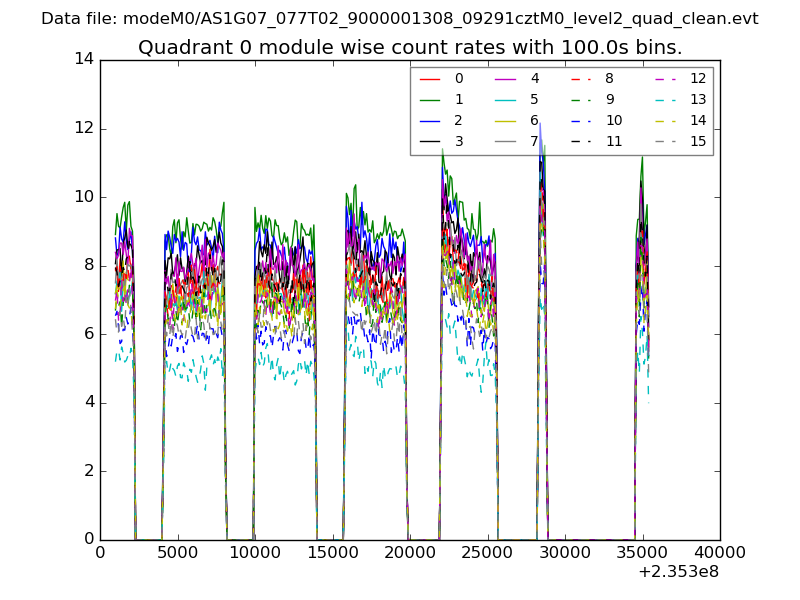 |
 |
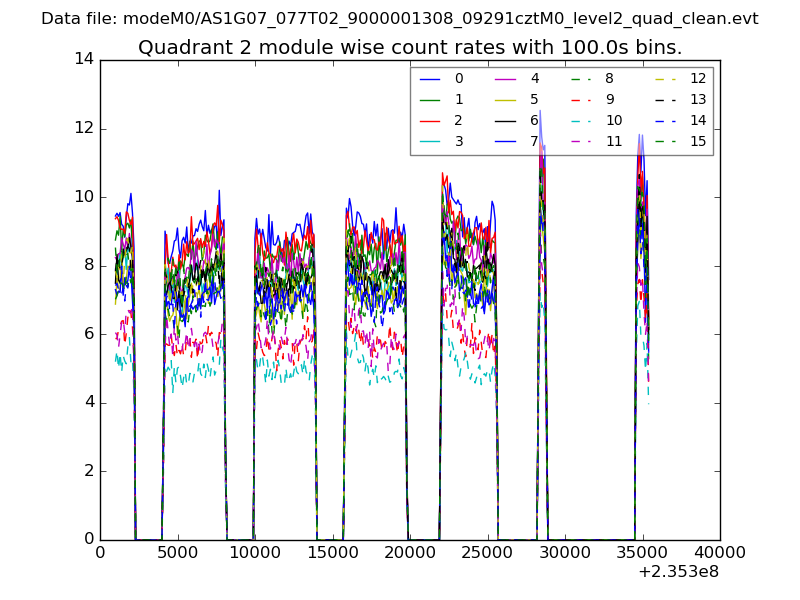
| Module-wise count rates for Quadrant B Data is divided into 100 sec bins |
 |
 |
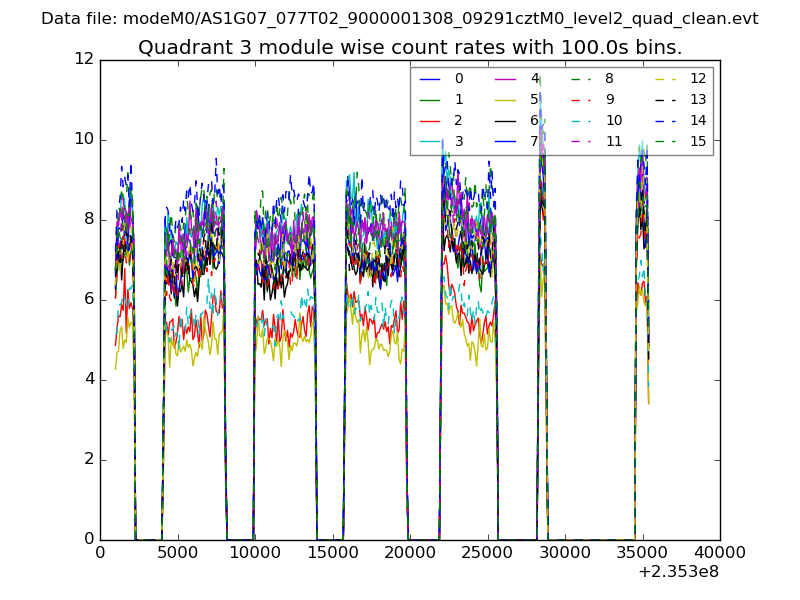
| Module-wise count rates for Quadrant C Data is divided into 100 sec bins |
 |
 |
| Module-wise count rates for Quadrant D Data is divided into 100 sec bins |
 |
 |
| Parameter | Plot |
|---|---|
| CZT HV Monitor | 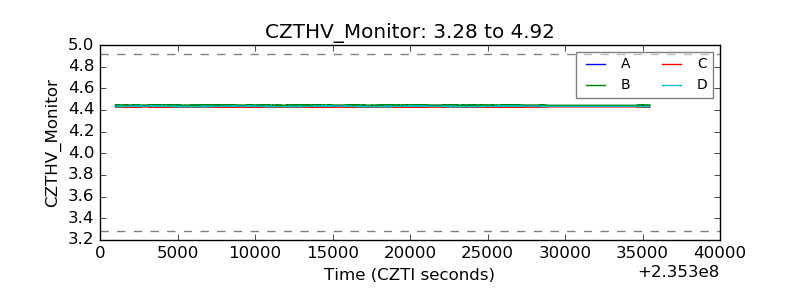 |
| D_VDD | 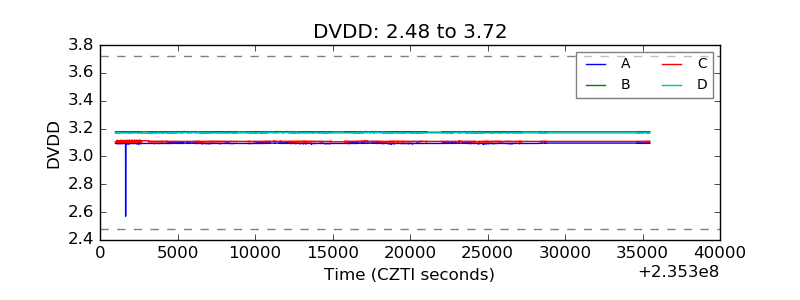 |
| Temperature 1 | 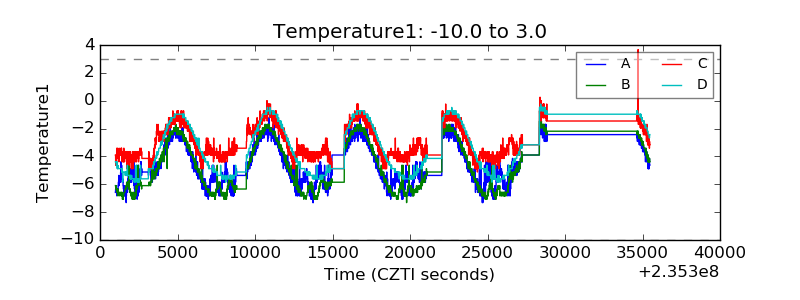 |
| Veto HV Monitor | 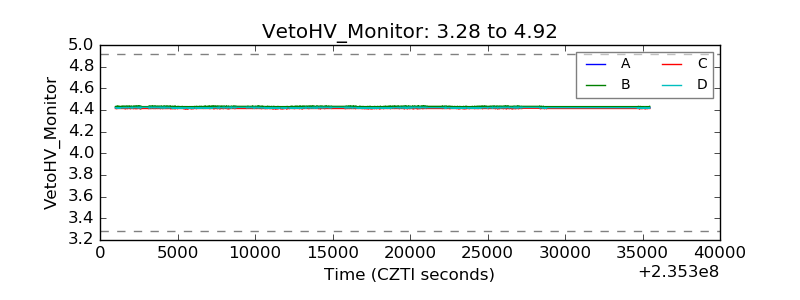 |
| Veto LLD | 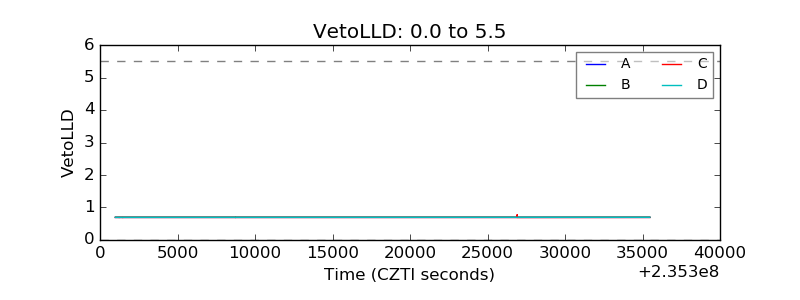 |
| Alpha Counter | 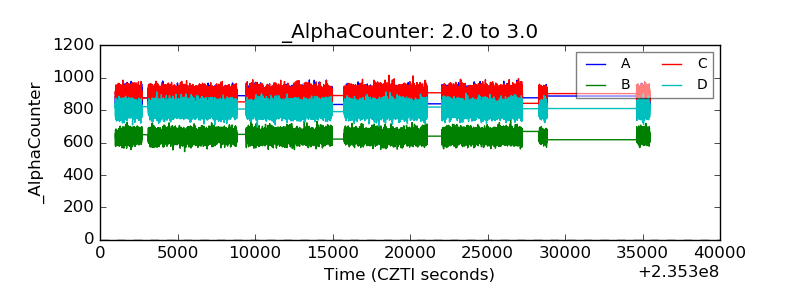 |
| _CPM_Rate | 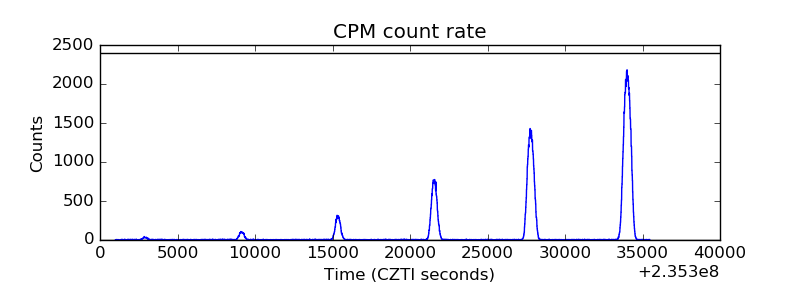 |
| CZT Counter | 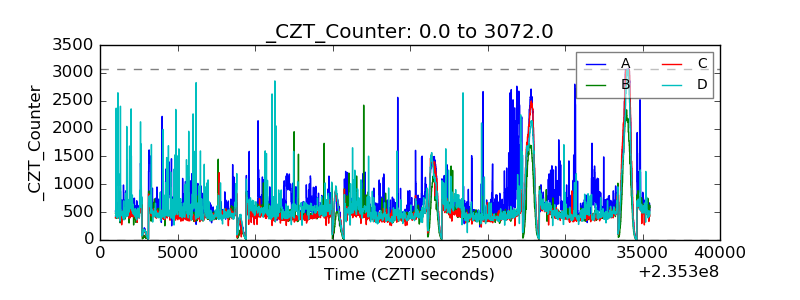 |
| +2.5 Volts monitor | 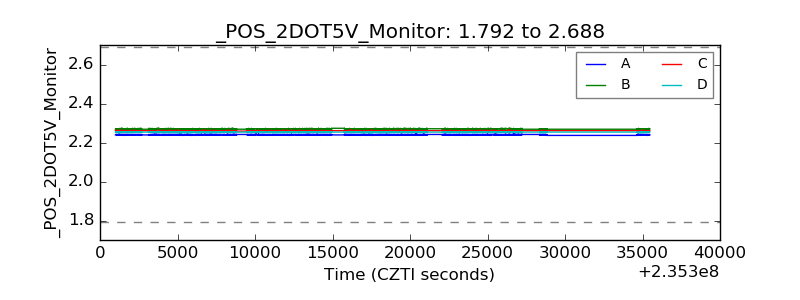 |
| +5 Volts monitor |  |
| _ROLL_ROT | 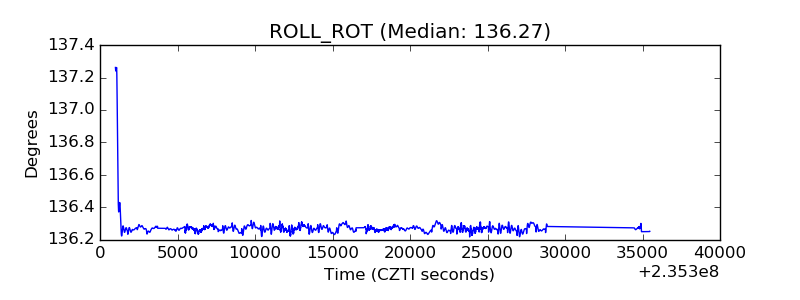 |
| _Roll_DEC | 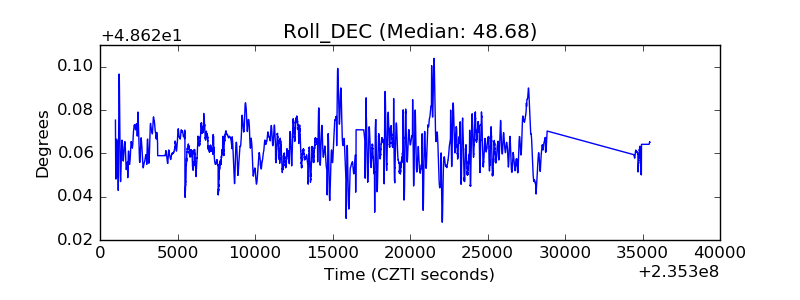 |
| _Roll_RA | 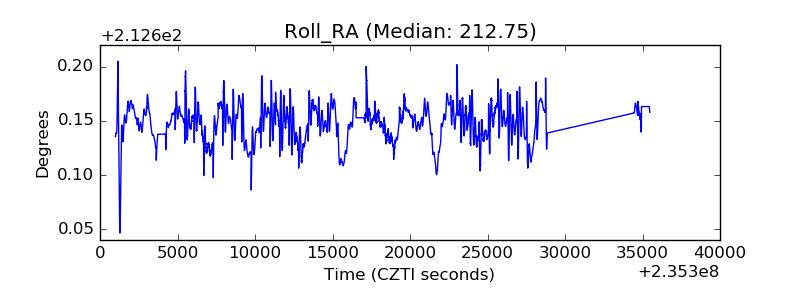 |
| Veto Counter | 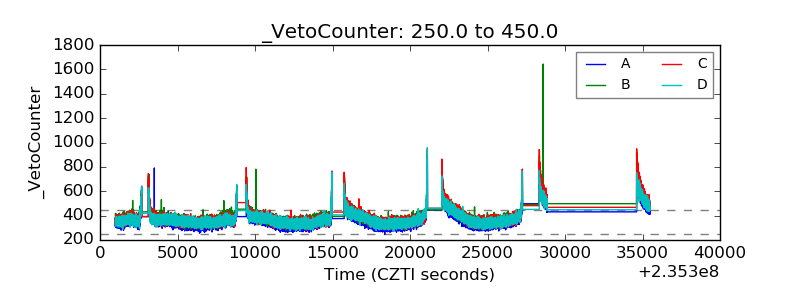 |