| Param | Original file | Final file |
|---|---|---|
| Filename | modeM0/AS1G07_077T03_9000001310cztM0_level2.fits | modeM0/AS1G07_077T03_9000001310cztM0_level2_quad_clean.evt |
| Size (bytes) | 365,569,920 | 362,920,320 |
| Size | 348.6 MB | 346.1 MB |
| Events in quadrant A | 2,150,010 | 2,117,733 |
| Events in quadrant B | 2,141,330 | 2,190,002 |
| Events in quadrant C | 2,188,928 | 2,105,715 |
| Events in quadrant D | 1,843,912 | 1,832,568 |
| Mode M9 | |||
|---|---|---|---|
| Quadrant | BADHDUFLAG | Total packets | Discarded packets |
| A | 0 | 57 | 0 |
| B | 0 | 60 | 0 |
| C | 0 | 58 | 0 |
| D | 0 | 59 | 0 |
| Mode M0 | |||
|---|---|---|---|
| Quadrant | BADHDUFLAG | Total packets | Discarded packets |
| A | 0 | 99846 | 0 |
| B | 0 | 83492 | 0 |
| C | 0 | 82231 | 0 |
| D | 0 | 97190 | 0 |
| Mode SS | |||
|---|---|---|---|
| Quadrant | BADHDUFLAG | Total packets | Discarded packets |
| A | 0 | 815 | 0 |
| B | 0 | 816 | 0 |
| C | 0 | 824 | 0 |
| D | 0 | 818 | 0 |
| Quadrant | Total seconds | Saturated seconds | Saturation percentage |
|---|---|---|---|
| A | 39799 | 1238 | 3.110631% |
| B | 40014 | 722 | 1.804368% |
| C | 40075 | 466 | 1.162820% |
| D | 39879 | 1945 | 4.877254% |
Noise dominated data is calculated using 1-second bins in cleaned event files. If a bin has >2000 counts, and if more than 50% of those come from <1% of pixels, then it is considered to be noise-dominated and hence unusable.
| Quadrant | # 1 sec bins | Bins with >0 counts | Bins with >2000 counts | High rate bins dominated by noise | Noise dominated (total time) | Noise dominated (detector-on time) | Marked lightcurve |
|---|---|---|---|---|---|---|---|
| A | 53198 | 40767 | 0 | 0 | 0.00% | 0.00% |  |
| B | 53199 | 41078 | 0 | 0 | 0.00% | 0.00% |  |
| C | 53199 | 41147 | 0 | 0 | 0.00% | 0.00% |  |
| D | 53199 | 40912 | 0 | 0 | 0.00% | 0.00% |  |
Top three noisy pixels from each quadrant. If the there are fewer than three noisy pixels in the level2.evt file, extra rows are filled as -1
| Pixel properties | Quadrant properties | ||||||
|---|---|---|---|---|---|---|---|
| Quadrant | DetID | PixID | Counts | Sigma | Mean | Median | Sigma |
| A | 0 | 29 | 2106 | 11.24 | 558 | 523 | 140.9 |
| A | 7 | 110 | 1756 | 8.75 | 558 | 523 | 140.9 |
| A | 9 | 19 | 1603 | 7.67 | 558 | 523 | 140.9 |
| B | 2 | 9 | 1865 | 11.77 | 564 | 536 | 112.9 |
| B | 5 | 128 | 1521 | 8.72 | 564 | 536 | 112.9 |
| B | 14 | 254 | 1509 | 8.62 | 564 | 536 | 112.9 |
| C | 12 | 241 | 1610 | 7.01 | 578 | 536 | 153.2 |
| C | 3 | 126 | 1451 | 5.97 | 578 | 536 | 153.2 |
| C | 9 | 242 | 1430 | 5.84 | 578 | 536 | 153.2 |
| D | 3 | 14 | 1397 | 6.49 | 524 | 475 | 142.1 |
| D | 6 | 231 | 1353 | 6.18 | 524 | 475 | 142.1 |
| D | 10 | 189 | 1336 | 6.06 | 524 | 475 | 142.1 |
Histogram calculated using DETX and DETY for each event in the final _common_clean file
| Quadrant A |  |
 |
Quadrant B |
|---|---|---|---|
| Quadrant D | 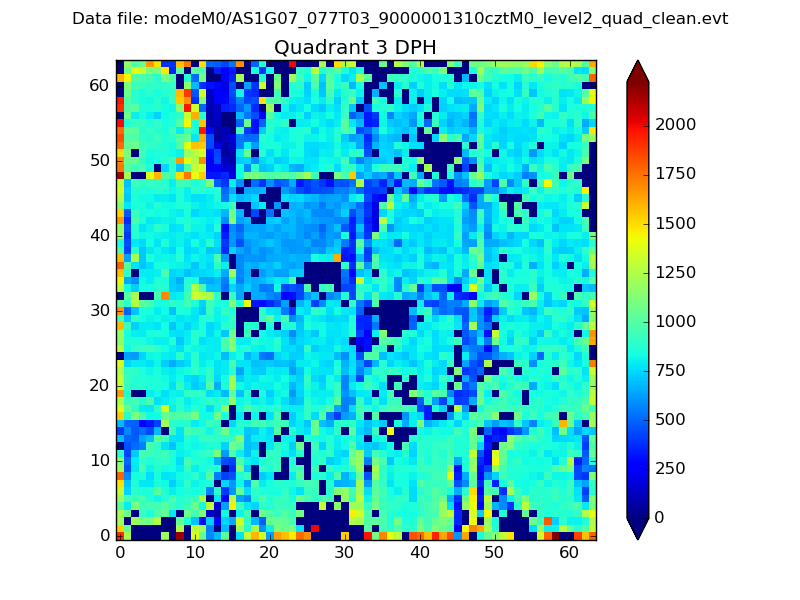 |
 |
Quadrant C |
| Plot type | Count rate plots | Images |
|---|---|---|
| Comparison with Poisson distribution Blue bars denote a histogram of data divided into 1 sec bins. Red curve is a Poisson curve with rate = median count rate of data. |
 |
 |
| Quadrant-wise count rates Data is divided into 100 sec bins |
 |
|
| Module-wise count rates for Quadrant A Data is divided into 100 sec bins |
 |
 |
| Module-wise count rates for Quadrant B Data is divided into 100 sec bins |
 |
 |
| Module-wise count rates for Quadrant C Data is divided into 100 sec bins |
 |
 |
| Module-wise count rates for Quadrant D Data is divided into 100 sec bins |
 |
 |
| Parameter | Plot |
|---|---|
| CZT HV Monitor |  |
| D_VDD |  |
| Temperature 1 |  |
| Veto HV Monitor |  |
| Veto LLD |  |
| Alpha Counter |  |
| _CPM_Rate |  |
| CZT Counter |  |
| +2.5 Volts monitor |  |
| +5 Volts monitor |  |
| _ROLL_ROT |  |
| _Roll_DEC |  |
| _Roll_RA |  |
| Veto Counter |  |