| Param | Original file | Final file |
|---|---|---|
| Filename | modeM0/AS1G07_077T03_9000001310_09293cztM0_level2.evt | modeM0/AS1G07_077T03_9000001310_09293cztM0_level2_quad_clean.evt |
| Size (bytes) | 280,995,840 | 61,248,960 |
| Size | 268.0 MB | 58.4 MB |
| Events in quadrant A | 2,261,298 | 380,437 |
| Events in quadrant B | 1,964,853 | 403,533 |
| Events in quadrant C | 1,927,138 | 403,579 |
| Events in quadrant D | 2,071,889 | 374,309 |
| Mode M9 | |||
|---|---|---|---|
| Quadrant | BADHDUFLAG | Total packets | Discarded packets |
| A | 0 | 20 | 5 |
| B | 0 | 20 | 7 |
| C | 0 | 18 | 3 |
| D | 0 | 21 | 6 |
| Mode M0 | |||
|---|---|---|---|
| Quadrant | BADHDUFLAG | Total packets | Discarded packets |
| A | 0 | 14799 | 5439 |
| B | 0 | 13045 | 4455 |
| C | 0 | 12880 | 4250 |
| D | 0 | 14197 | 5113 |
| Mode SS | |||
|---|---|---|---|
| Quadrant | BADHDUFLAG | Total packets | Discarded packets |
| A | 0 | 127 | 54 |
| B | 0 | 127 | 46 |
| C | 0 | 128 | 38 |
| D | 0 | 128 | 48 |
| Quadrant | Total seconds | Saturated seconds | Saturation percentage |
|---|---|---|---|
| A | 4074 | 33 | 0.810015% |
| B | 4175 | 19 | 0.455090% |
| C | 4225 | 14 | 0.331361% |
| D | 4110 | 37 | 0.900243% |
Noise dominated data is calculated using 1-second bins in cleaned event files. If a bin has >2000 counts, and if more than 50% of those come from <1% of pixels, then it is considered to be noise-dominated and hence unusable.
| Quadrant | # 1 sec bins | Bins with >0 counts | Bins with >2000 counts | High rate bins dominated by noise | Noise dominated (total time) | Noise dominated (detector-on time) | Marked lightcurve |
|---|---|---|---|---|---|---|---|
| A | 7611 | 5219 | 3 | 3 | 0.04% | 0.06% | 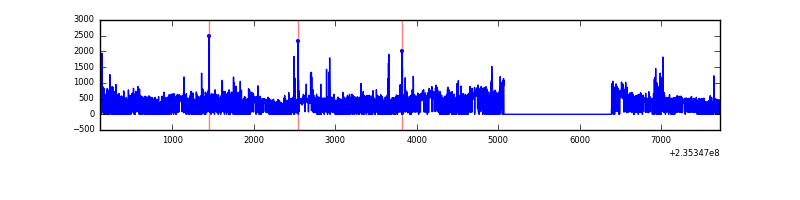 |
| B | 7611 | 5289 | 0 | 0 | 0.00% | 0.00% | 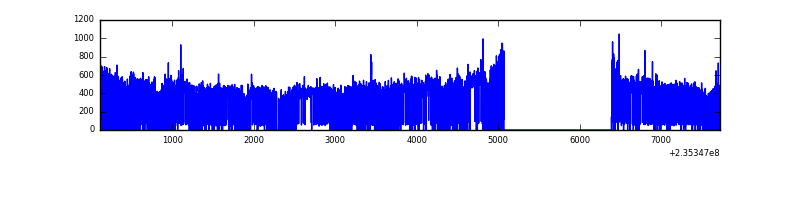 |
| C | 7611 | 5363 | 1 | 1 | 0.01% | 0.02% | 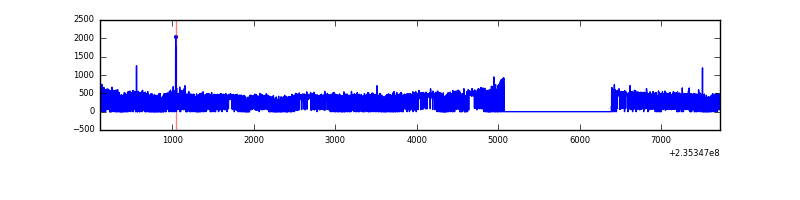 |
| D | 7610 | 5213 | 22 | 22 | 0.29% | 0.42% | 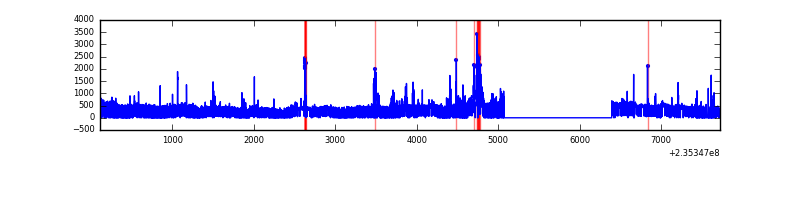 |
Top three noisy pixels from each quadrant. If the there are fewer than three noisy pixels in the level2.evt file, extra rows are filled as -1
| Pixel properties | Quadrant properties | ||||||
|---|---|---|---|---|---|---|---|
| Quadrant | DetID | PixID | Counts | Sigma | Mean | Median | Sigma |
| A | 8 | 5 | 319416 | 3289.21 | 475 | 466 | 97.0 |
| A | 5 | 16 | 45545 | 464.88 | 475 | 466 | 97.0 |
| A | 12 | 236 | 42845 | 437.04 | 475 | 466 | 97.0 |
| B | 4 | 80 | 11052 | 112.36 | 495 | 483 | 94.1 |
| B | 0 | 214 | 10053 | 101.74 | 495 | 483 | 94.1 |
| B | 12 | 111 | 10046 | 101.67 | 495 | 483 | 94.1 |
| C | 10 | 22 | 10389 | 87.69 | 490 | 493 | 112.9 |
| C | 14 | 67 | 3745 | 28.82 | 490 | 493 | 112.9 |
| C | 13 | 61 | 3670 | 28.15 | 490 | 493 | 112.9 |
| D | 12 | 233 | 89122 | 746.95 | 463 | 451 | 118.7 |
| D | 12 | 227 | 54527 | 455.53 | 463 | 451 | 118.7 |
| D | 2 | 14 | 44639 | 372.23 | 463 | 451 | 118.7 |
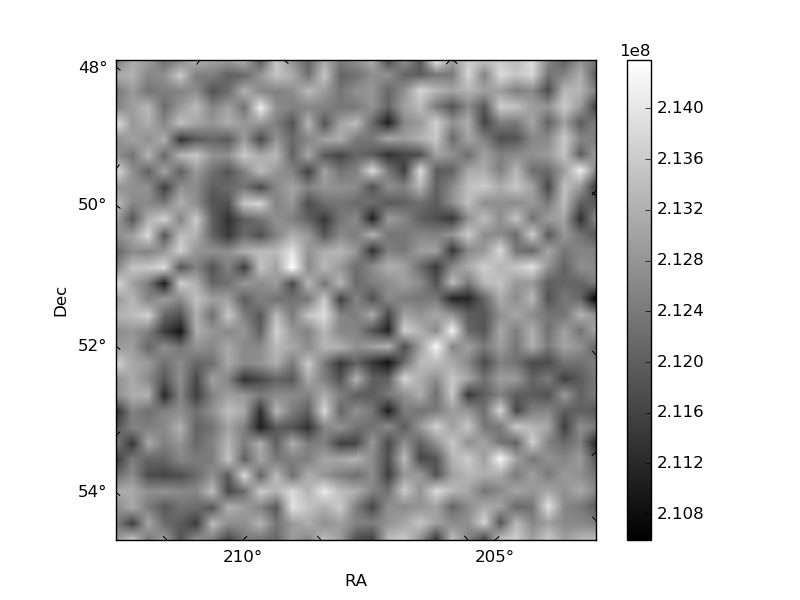
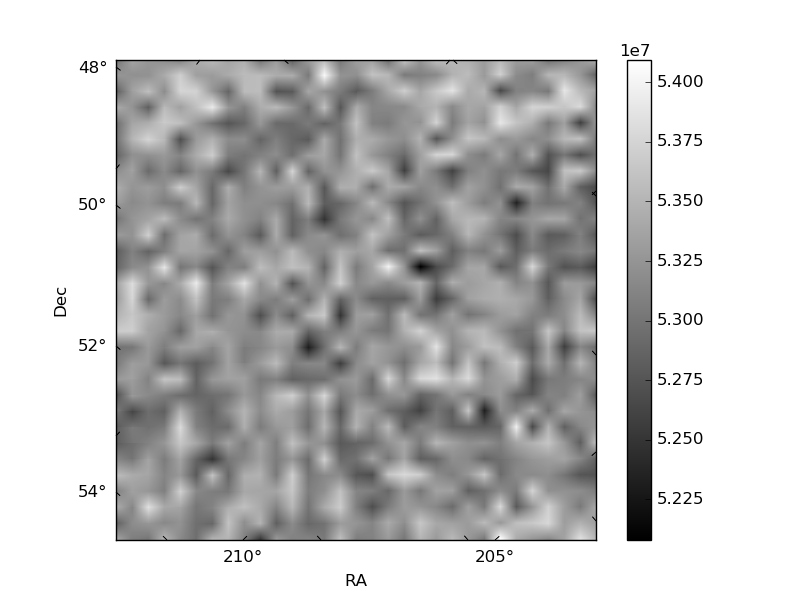
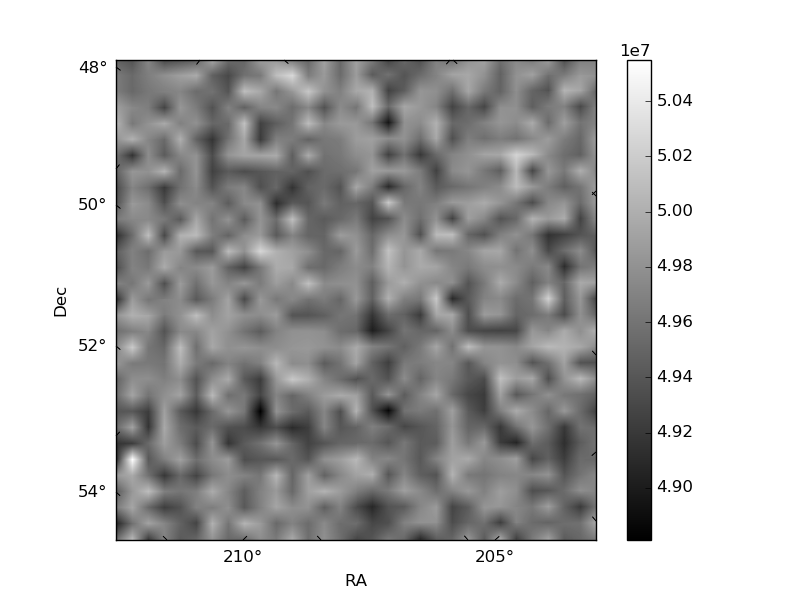
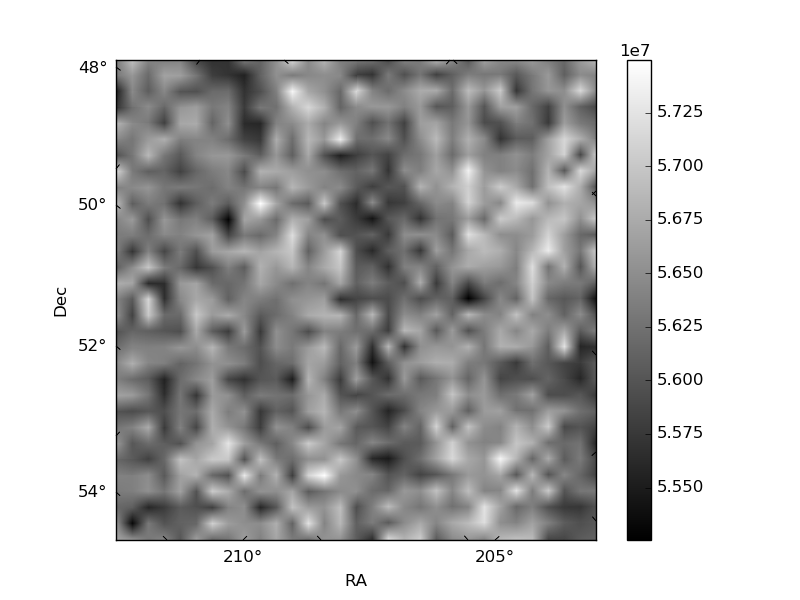
Histogram calculated using DETX and DETY for each event in the final _common_clean file
| Quadrant A | 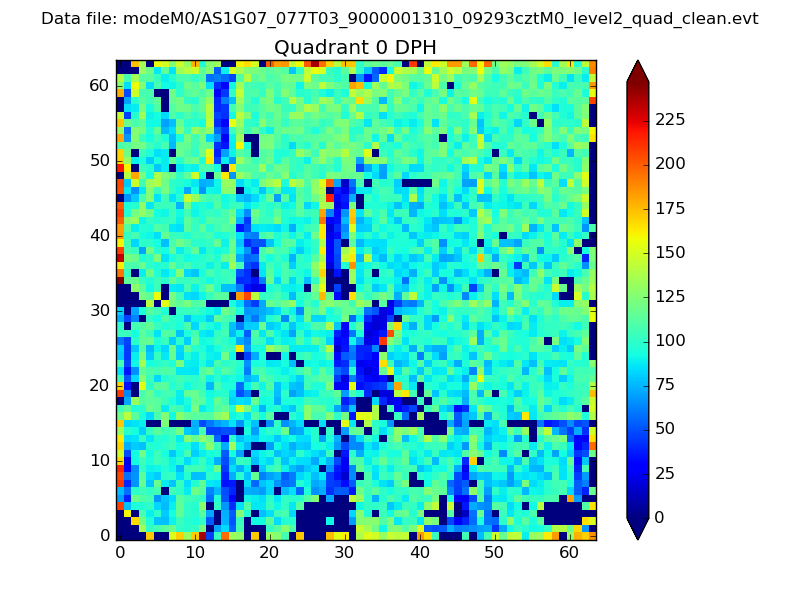 |
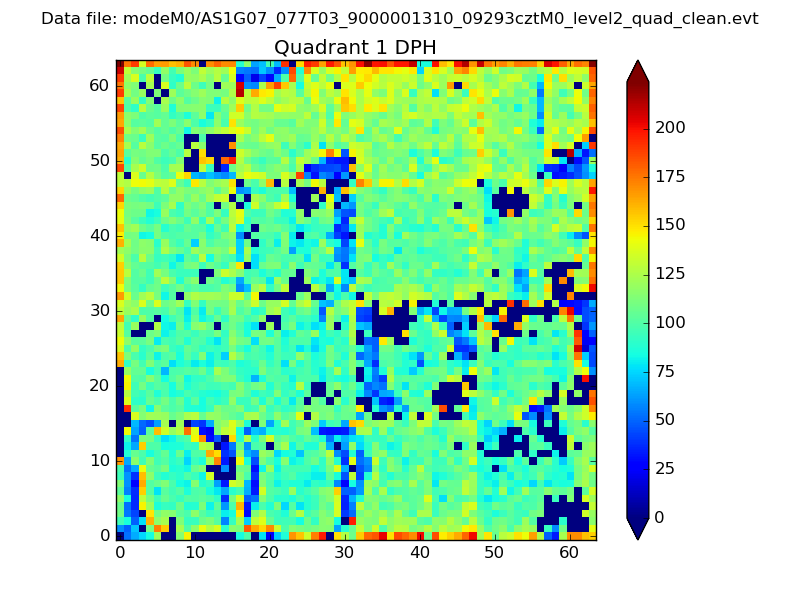 |
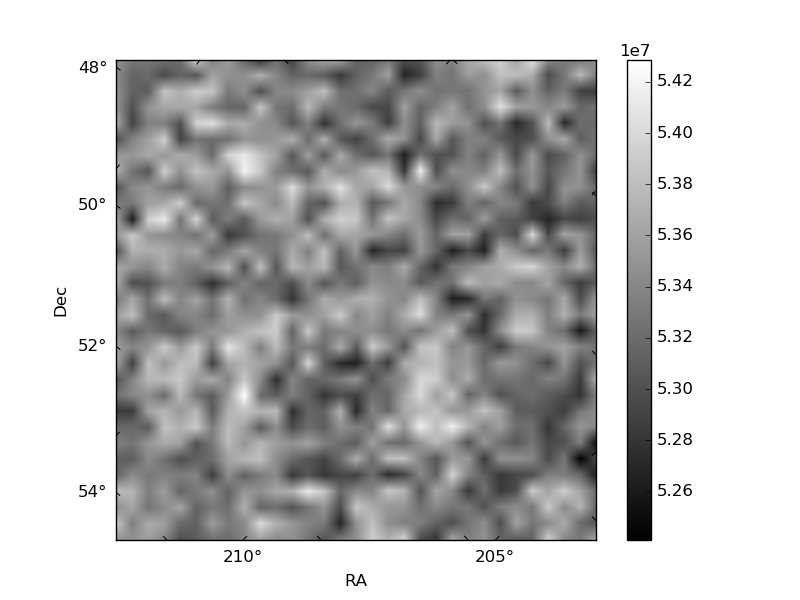
Quadrant B |
|---|---|---|---|
| Quadrant D | 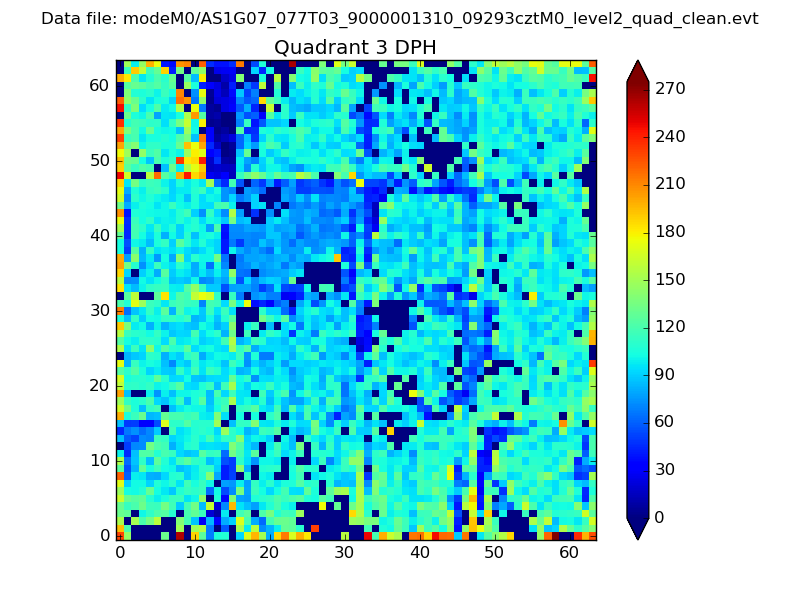 |
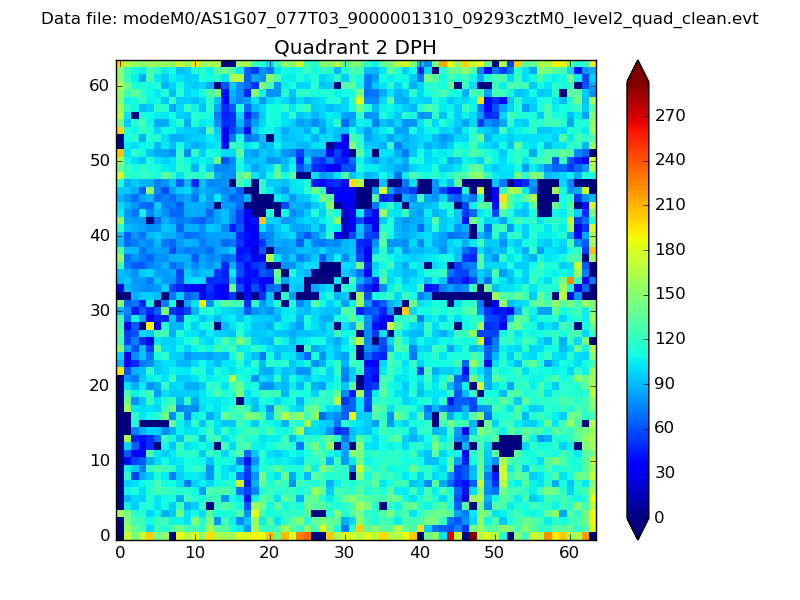 |
Quadrant C |
| Plot type | Count rate plots | Images |
|---|---|---|
| Comparison with Poisson distribution Blue bars denote a histogram of data divided into 1 sec bins. Red curve is a Poisson curve with rate = median count rate of data. |
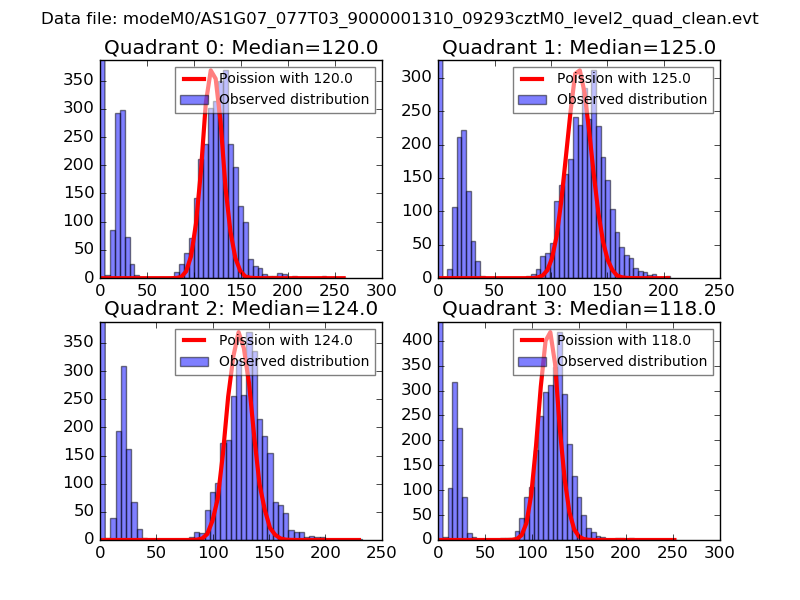 |
 |
| Quadrant-wise count rates Data is divided into 100 sec bins |
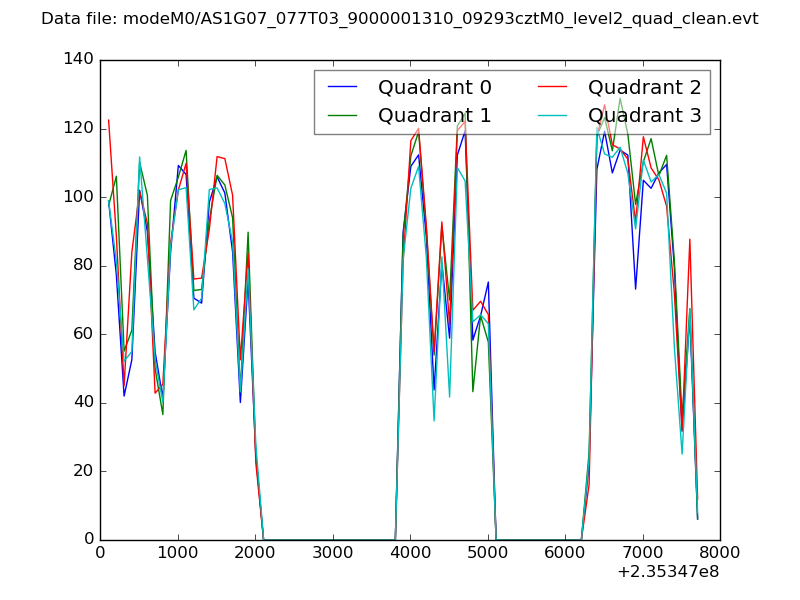 |
|
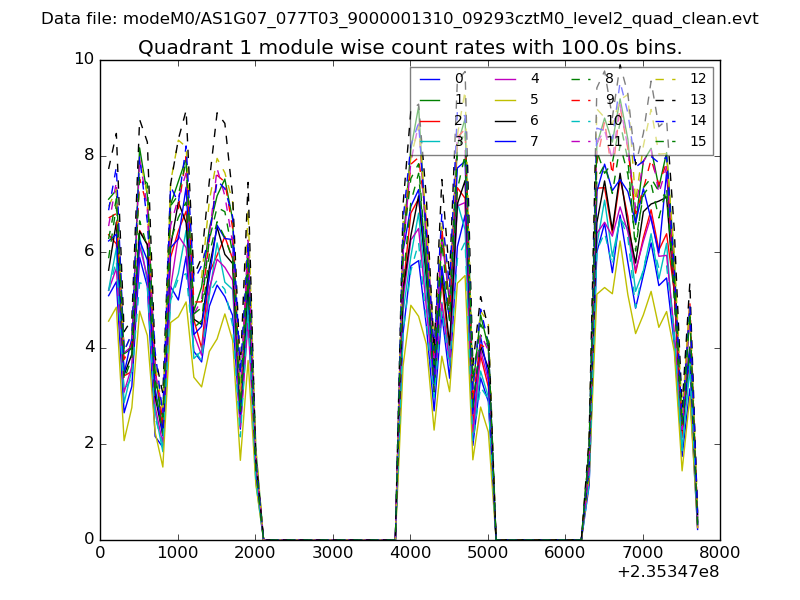
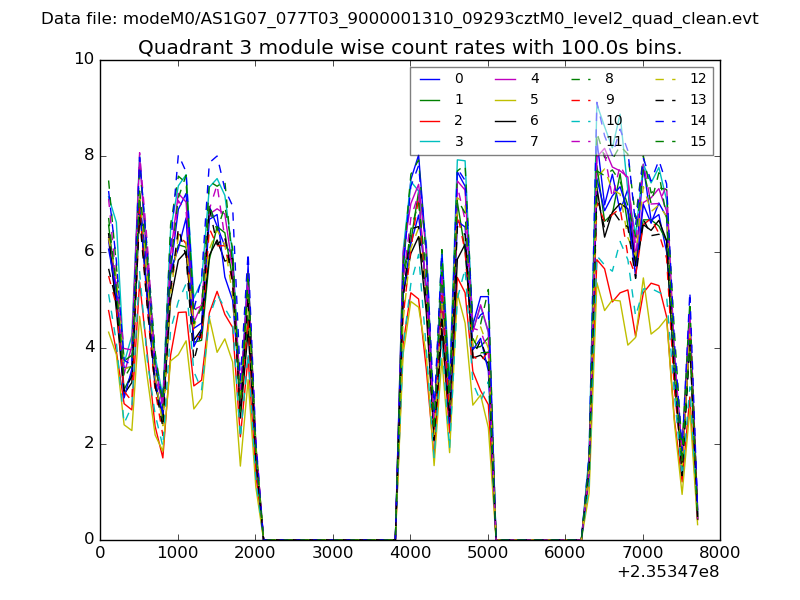
| Module-wise count rates for Quadrant A Data is divided into 100 sec bins |
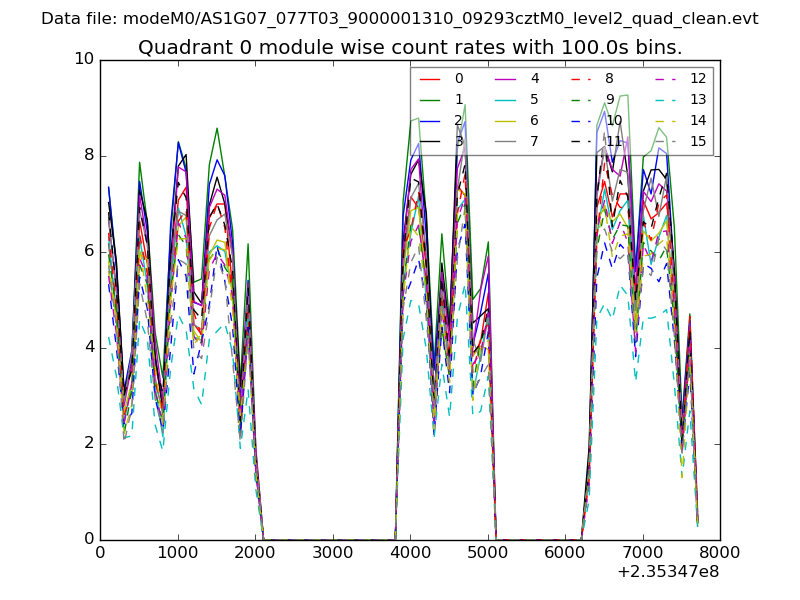 |
 |
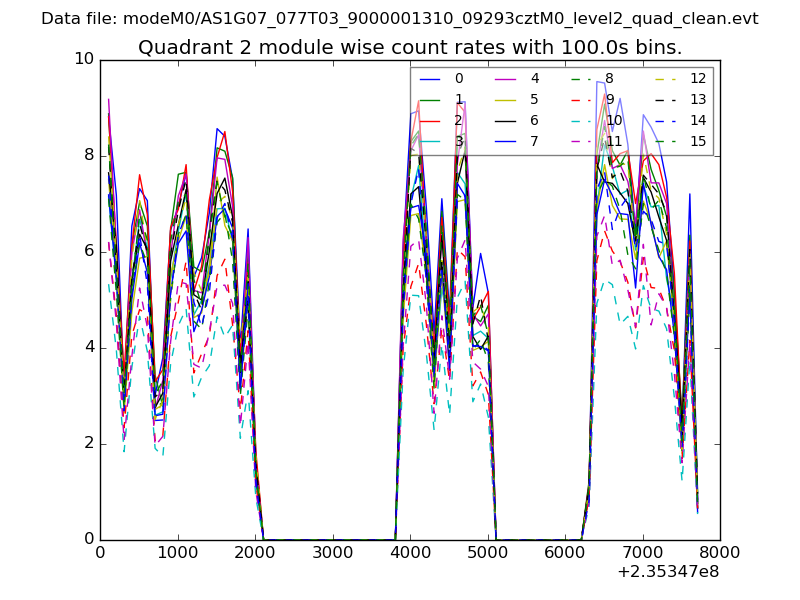
| Module-wise count rates for Quadrant B Data is divided into 100 sec bins |
 |
 |
| Module-wise count rates for Quadrant C Data is divided into 100 sec bins |
 |
 |
| Module-wise count rates for Quadrant D Data is divided into 100 sec bins |
 |
 |
| Parameter | Plot |
|---|---|
| CZT HV Monitor | 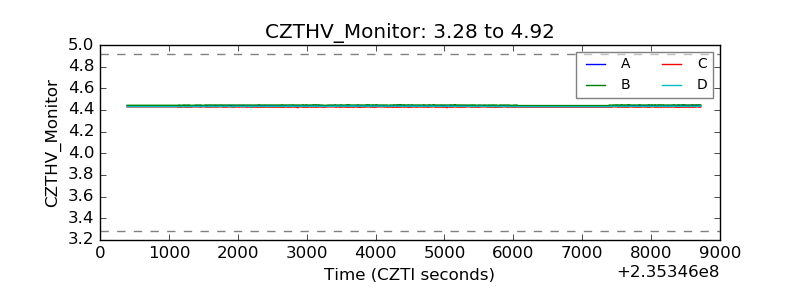 |
| D_VDD | 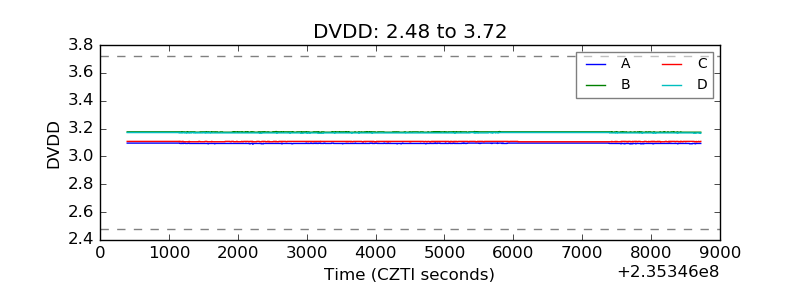 |
| Temperature 1 | 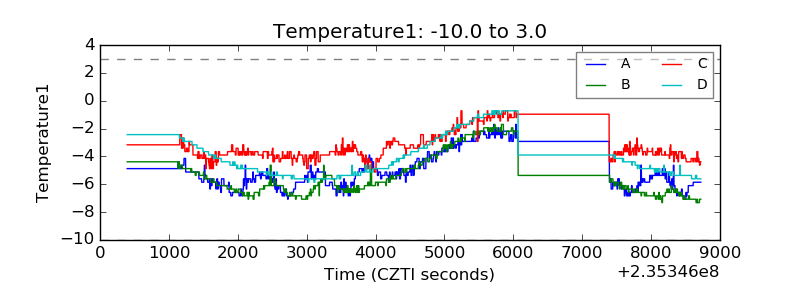 |
| Veto HV Monitor | 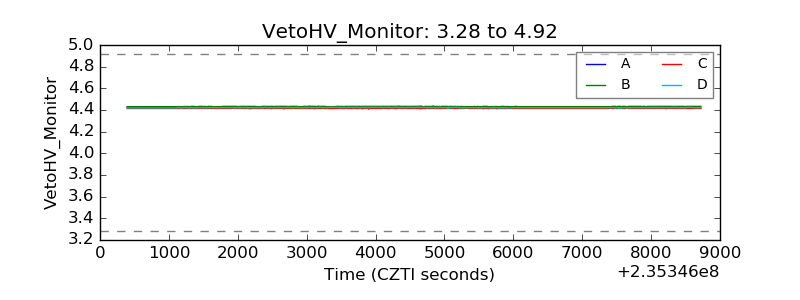 |
| Veto LLD | 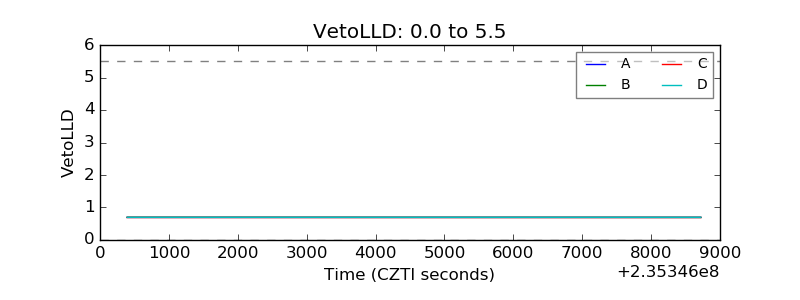 |
| Alpha Counter | 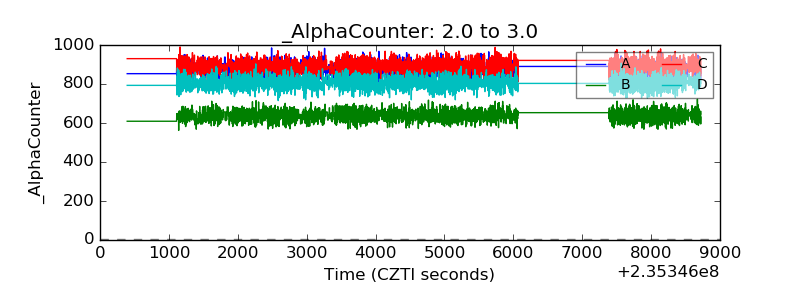 |
| _CPM_Rate | 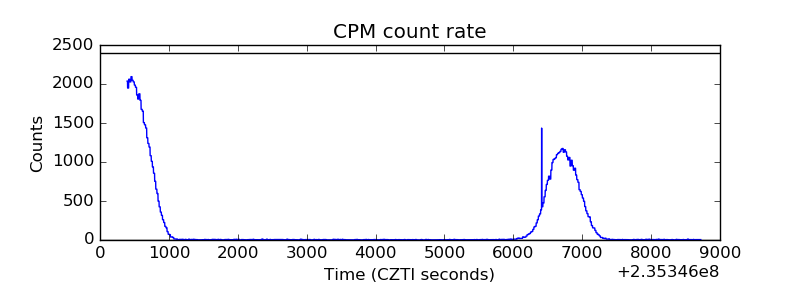 |
| CZT Counter | 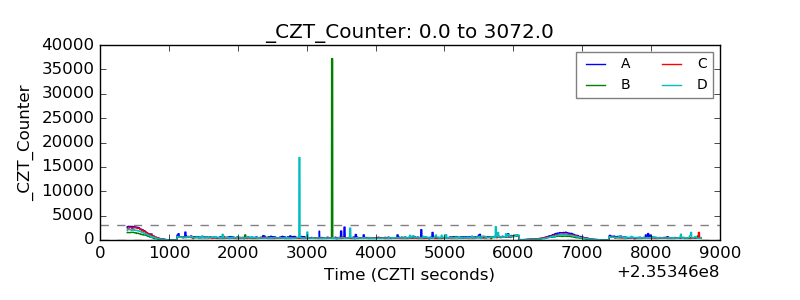 |
| +2.5 Volts monitor | 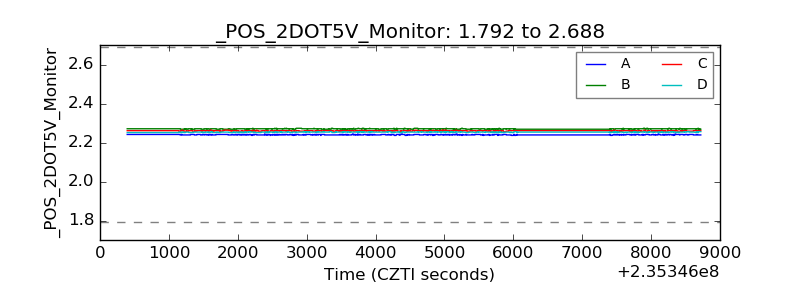 |
| +5 Volts monitor | 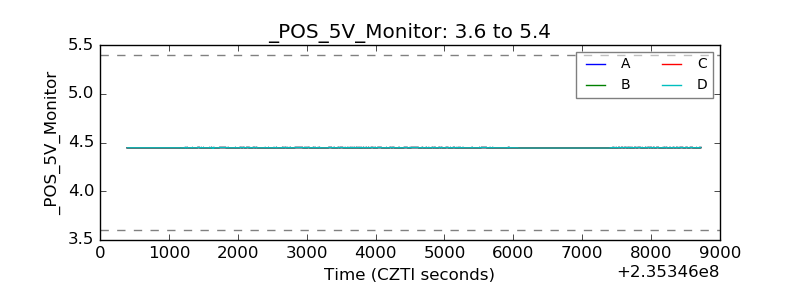 |
| _ROLL_ROT | 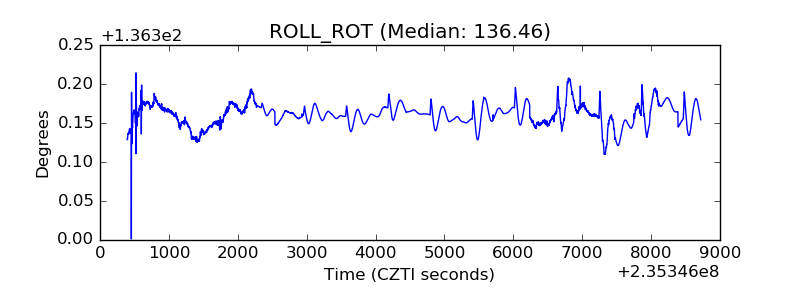 |
| _Roll_DEC | 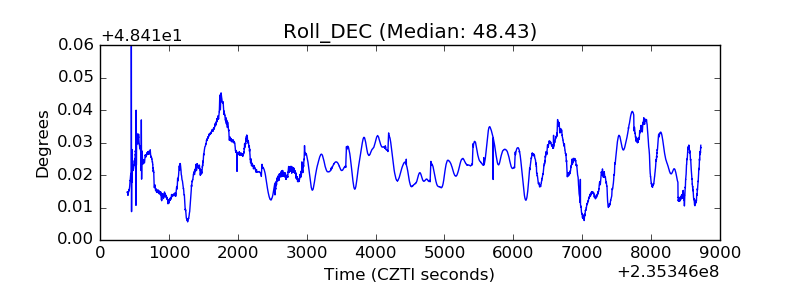 |
| _Roll_RA | 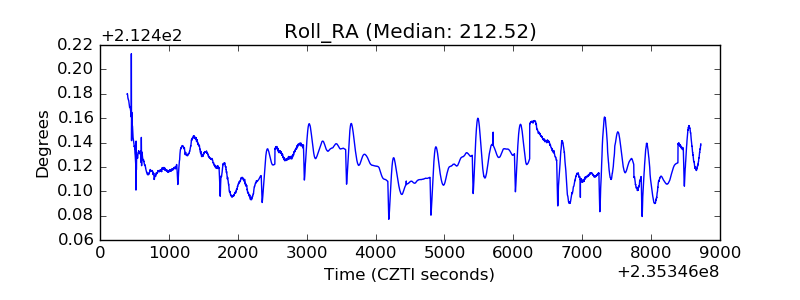 |
| Veto Counter | 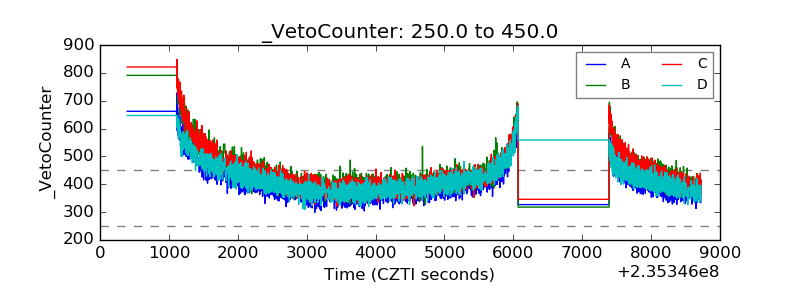 |