| Param | Original file | Final file |
|---|---|---|
| Filename | modeM0/AS1G07_077T03_9000001310_09294cztM0_level2.evt | modeM0/AS1G07_077T03_9000001310_09294cztM0_level2_quad_clean.evt |
| Size (bytes) | 993,781,440 | 183,513,600 |
| Size | 947.7 MB | 175.0 MB |
| Events in quadrant A | 8,389,198 | 1,122,994 |
| Events in quadrant B | 6,800,428 | 1,173,534 |
| Events in quadrant C | 6,539,090 | 1,168,207 |
| Events in quadrant D | 7,395,518 | 1,101,063 |
| Mode M9 | |||
|---|---|---|---|
| Quadrant | BADHDUFLAG | Total packets | Discarded packets |
| A | 0 | 49 | 8 |
| B | 0 | 50 | 5 |
| C | 0 | 50 | 5 |
| D | 0 | 50 | 7 |
| Mode M0 | |||
|---|---|---|---|
| Quadrant | BADHDUFLAG | Total packets | Discarded packets |
| A | 0 | 48663 | 14403 |
| B | 0 | 41676 | 11799 |
| C | 0 | 40740 | 11192 |
| D | 0 | 44857 | 12491 |
| Mode SS | |||
|---|---|---|---|
| Quadrant | BADHDUFLAG | Total packets | Discarded packets |
| A | 0 | 400 | 101 |
| B | 0 | 406 | 114 |
| C | 0 | 406 | 106 |
| D | 0 | 406 | 108 |
| Quadrant | Total seconds | Saturated seconds | Saturation percentage |
|---|---|---|---|
| A | 14264 | 212 | 1.486259% |
| B | 14362 | 92 | 0.640579% |
| C | 14419 | 47 | 0.325959% |
| D | 14343 | 159 | 1.108555% |
Noise dominated data is calculated using 1-second bins in cleaned event files. If a bin has >2000 counts, and if more than 50% of those come from <1% of pixels, then it is considered to be noise-dominated and hence unusable.
| Quadrant | # 1 sec bins | Bins with >0 counts | Bins with >2000 counts | High rate bins dominated by noise | Noise dominated (total time) | Noise dominated (detector-on time) | Marked lightcurve |
|---|---|---|---|---|---|---|---|
| A | 25099 | 14662 | 85 | 85 | 0.34% | 0.58% | 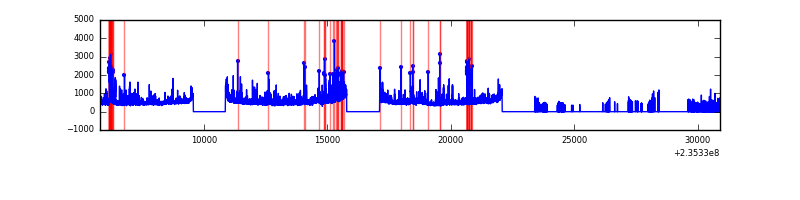 |
| B | 25096 | 14820 | 5 | 5 | 0.02% | 0.03% | 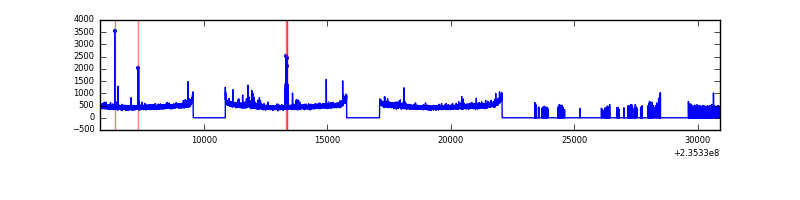 |
| C | 25098 | 14907 | 1 | 1 | 0.00% | 0.01% | 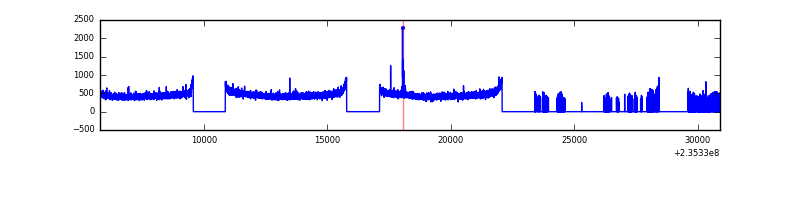 |
| D | 25098 | 14791 | 88 | 88 | 0.35% | 0.59% | 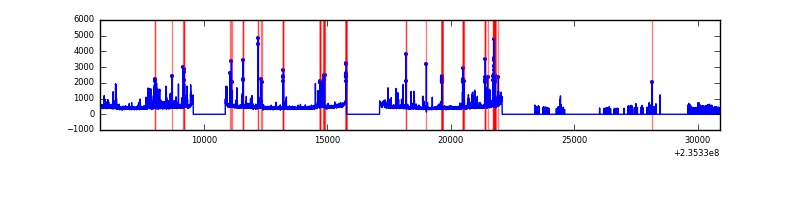 |
Top three noisy pixels from each quadrant. If the there are fewer than three noisy pixels in the level2.evt file, extra rows are filled as -1
| Pixel properties | Quadrant properties | ||||||
|---|---|---|---|---|---|---|---|
| Quadrant | DetID | PixID | Counts | Sigma | Mean | Median | Sigma |
| A | 8 | 5 | 1275289 | 3840.76 | 1665 | 1629 | 331.6 |
| A | 4 | 2 | 221876 | 664.16 | 1665 | 1629 | 331.6 |
| A | 12 | 236 | 165614 | 494.5 | 1665 | 1629 | 331.6 |
| B | 0 | 214 | 76515 | 236.31 | 1708 | 1666 | 316.7 |
| B | 12 | 111 | 34563 | 103.86 | 1708 | 1666 | 316.7 |
| B | 4 | 80 | 29218 | 86.99 | 1708 | 1666 | 316.7 |
| C | 10 | 22 | 18520 | 44.23 | 1667 | 1674 | 380.9 |
| C | 13 | 61 | 12570 | 28.61 | 1667 | 1674 | 380.9 |
| C | 14 | 67 | 10947 | 24.35 | 1667 | 1674 | 380.9 |
| D | 1 | 52 | 479095 | 1201.57 | 1618 | 1578 | 397.4 |
| D | 12 | 233 | 263772 | 659.76 | 1618 | 1578 | 397.4 |
| D | 7 | 71 | 155020 | 386.11 | 1618 | 1578 | 397.4 |
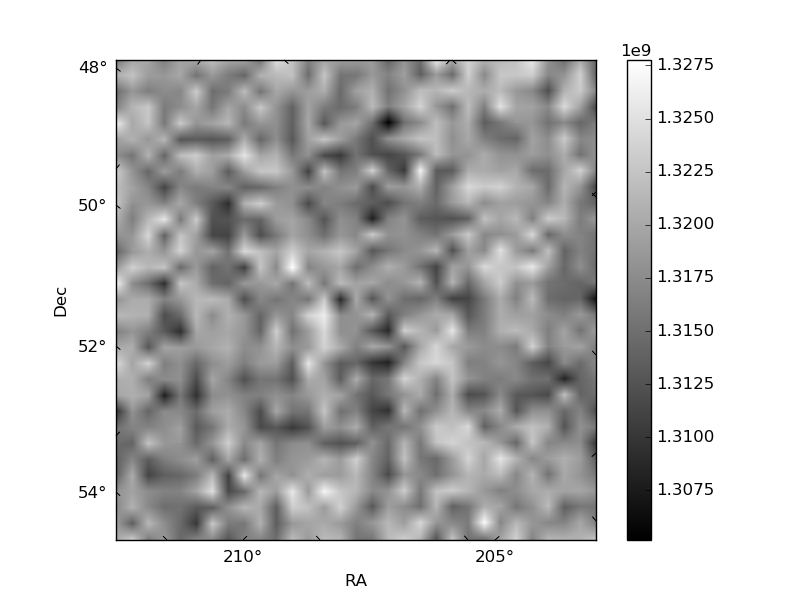
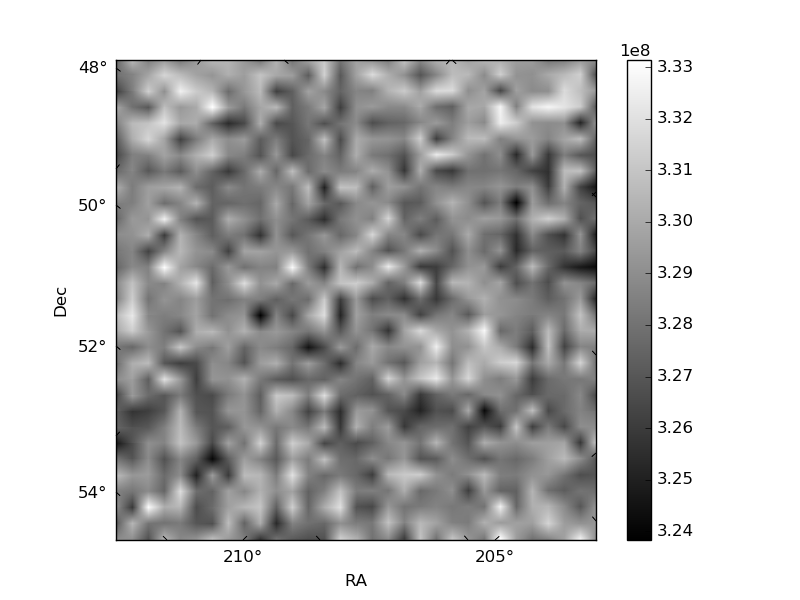
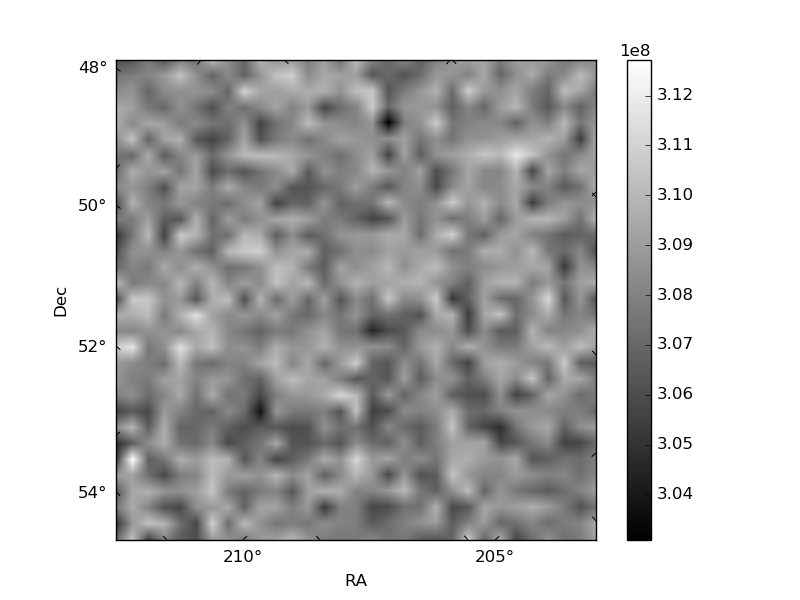
Histogram calculated using DETX and DETY for each event in the final _common_clean file
| Quadrant A | 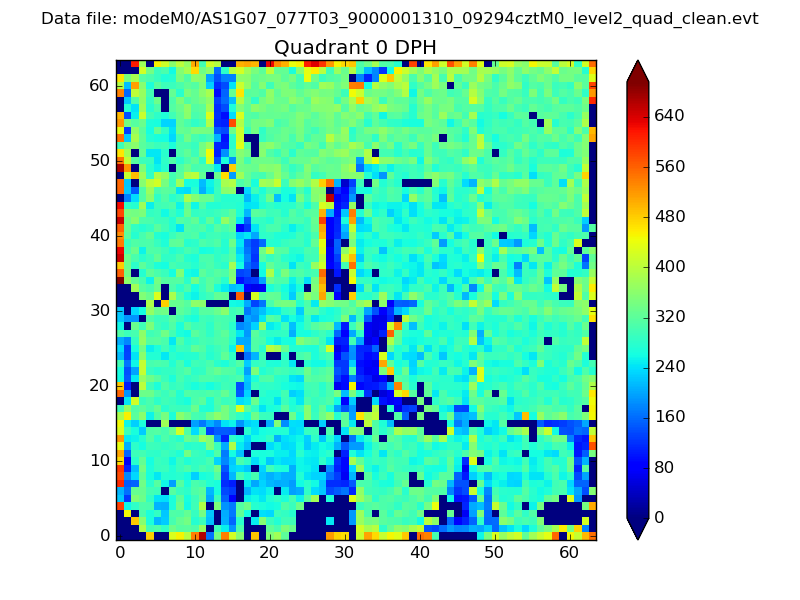 |
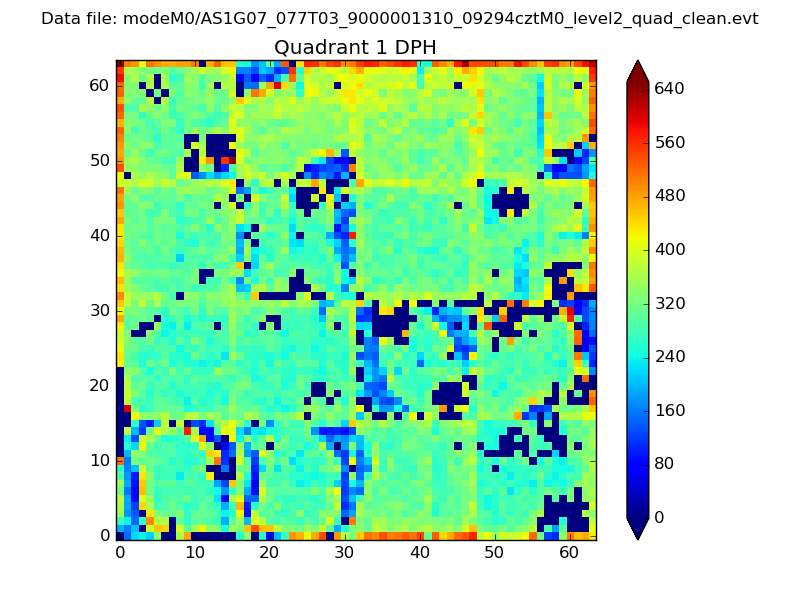 |
Quadrant B |
|---|---|---|---|
| Quadrant D | 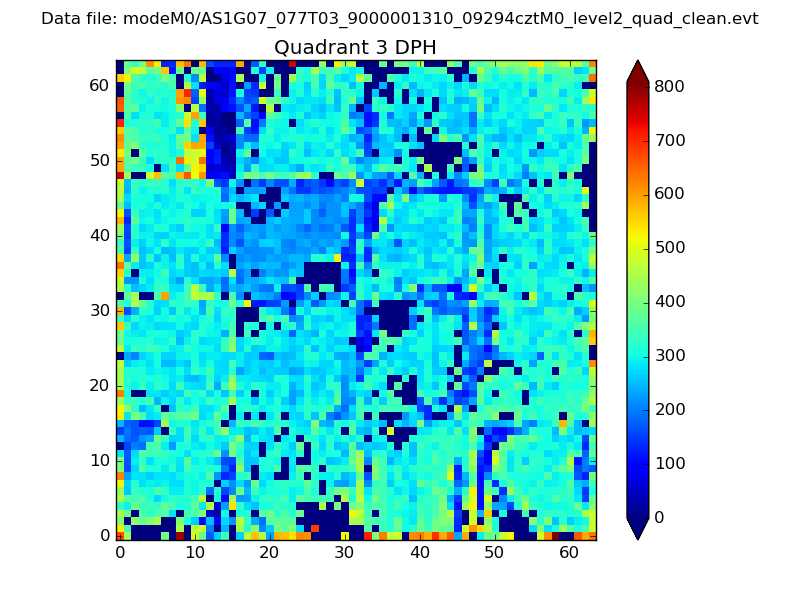 |
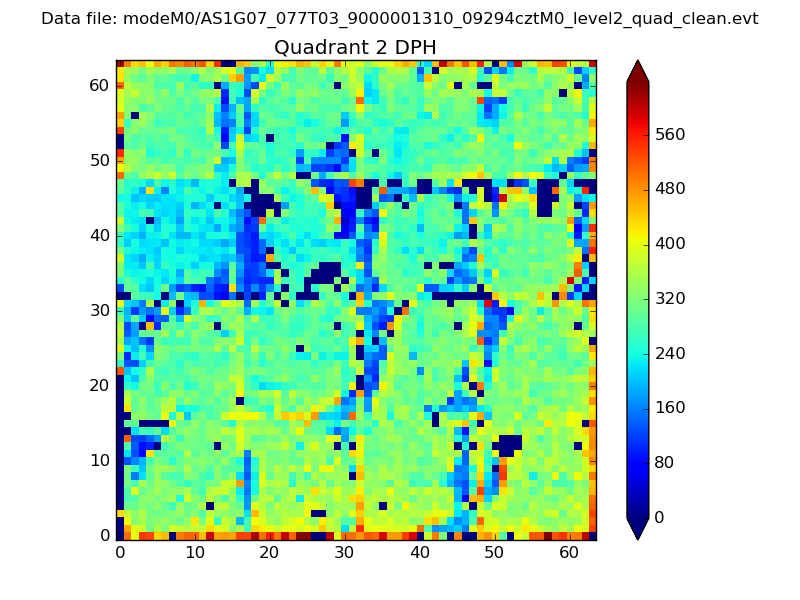 |
Quadrant C |
| Plot type | Count rate plots | Images |
|---|---|---|
| Comparison with Poisson distribution Blue bars denote a histogram of data divided into 1 sec bins. Red curve is a Poisson curve with rate = median count rate of data. |
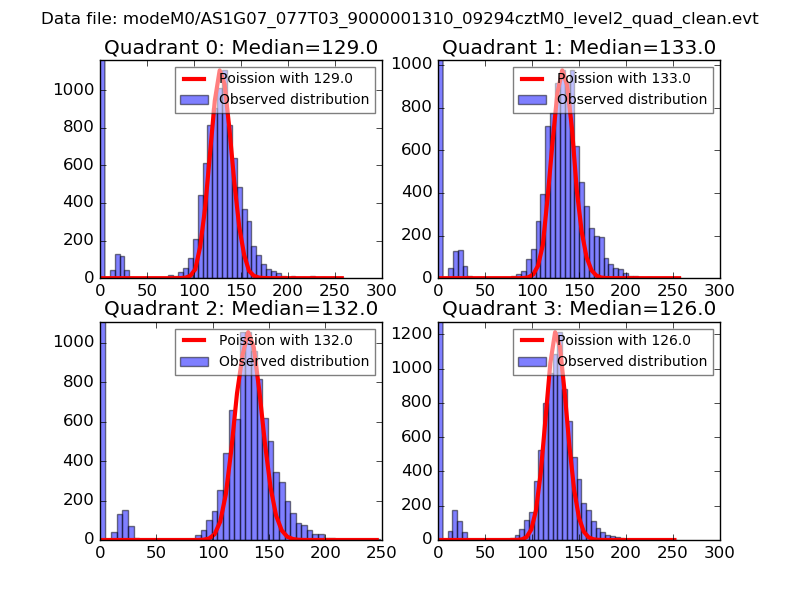 |
 |
| Quadrant-wise count rates Data is divided into 100 sec bins |
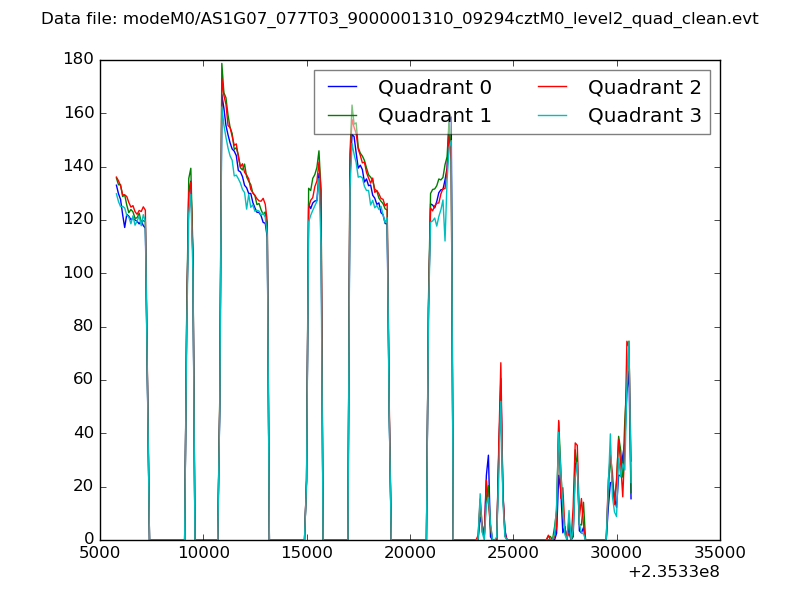 |
|
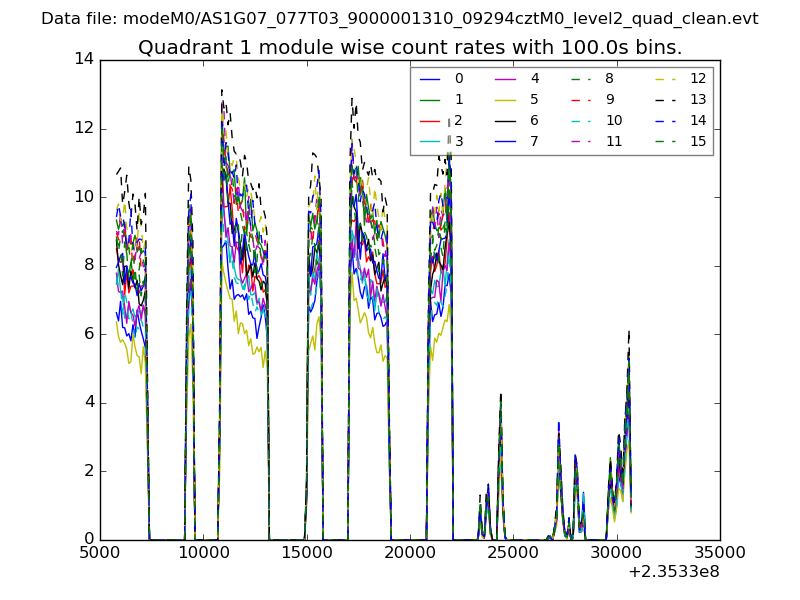
| Module-wise count rates for Quadrant A Data is divided into 100 sec bins |
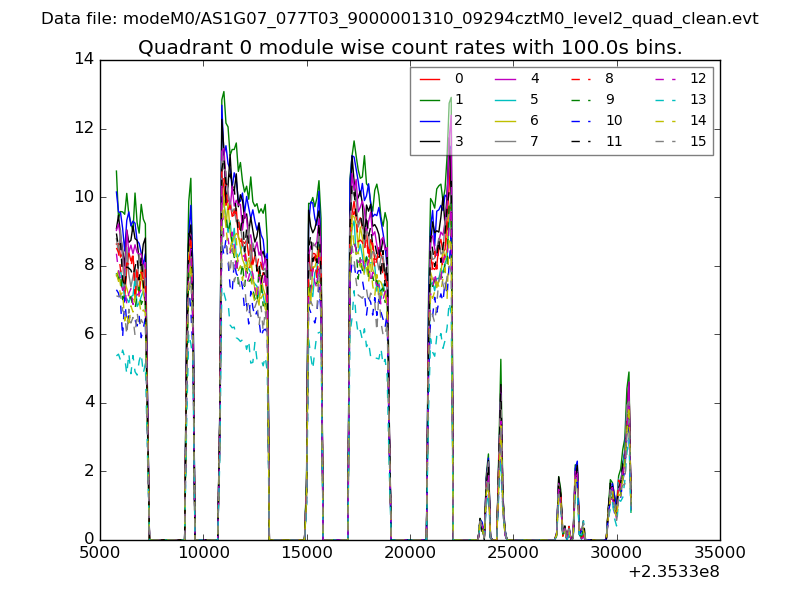 |
 |
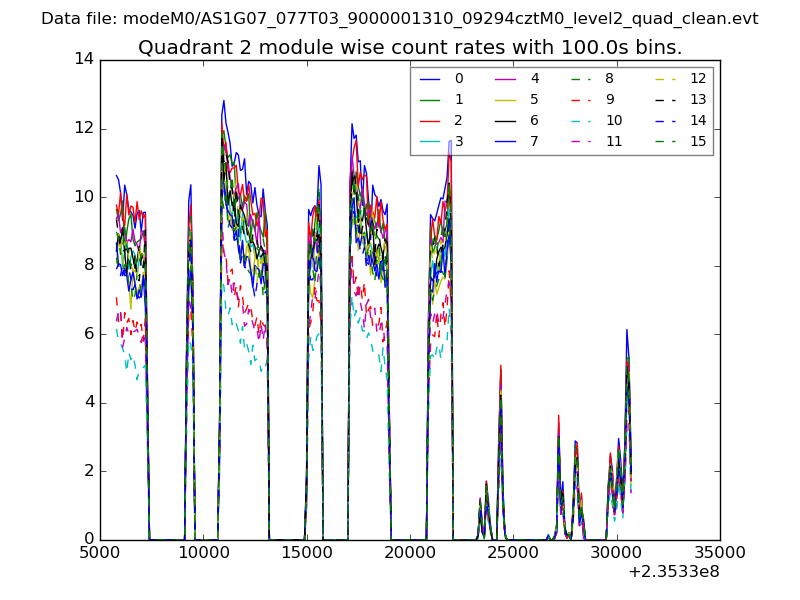
| Module-wise count rates for Quadrant B Data is divided into 100 sec bins |
 |
 |
| Module-wise count rates for Quadrant C Data is divided into 100 sec bins |
 |
 |
| Module-wise count rates for Quadrant D Data is divided into 100 sec bins |
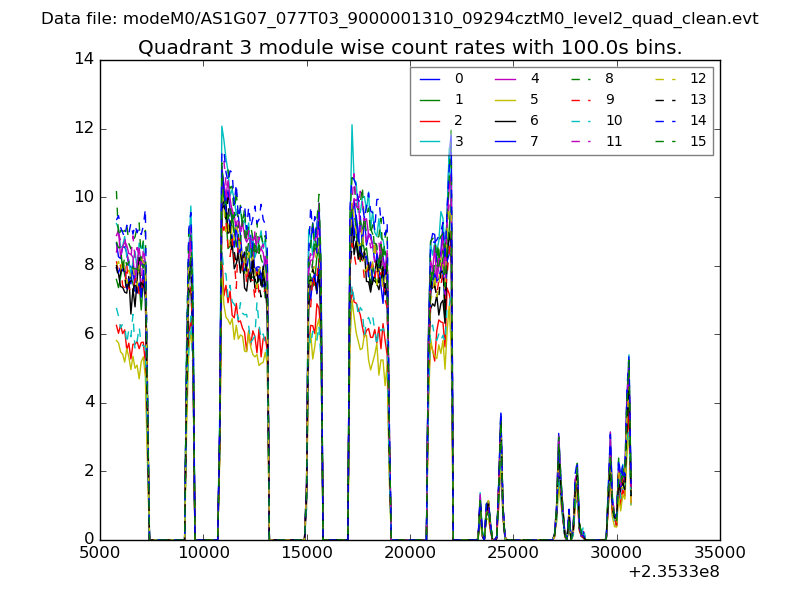 |
 |
| Parameter | Plot |
|---|---|
| CZT HV Monitor | 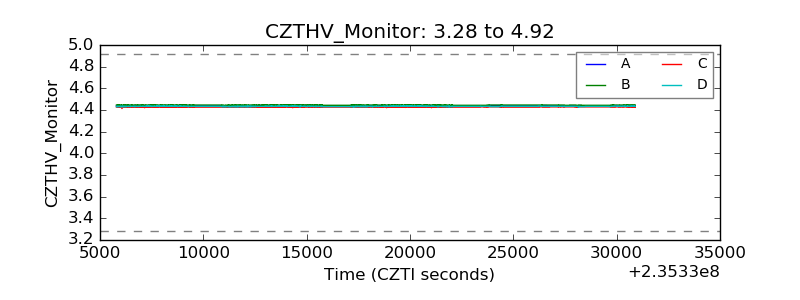 |
| D_VDD | 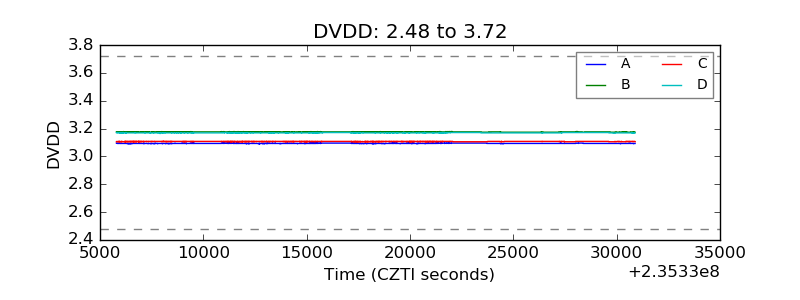 |
| Temperature 1 | 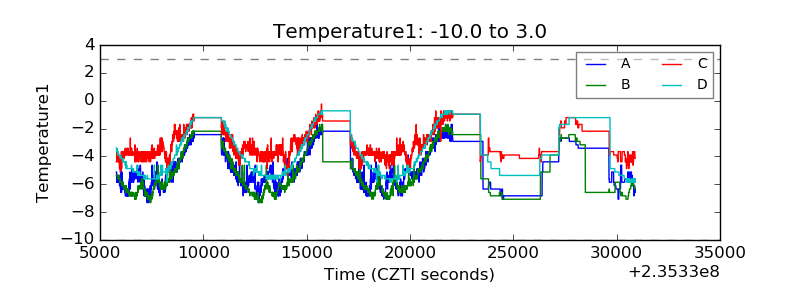 |
| Veto HV Monitor | 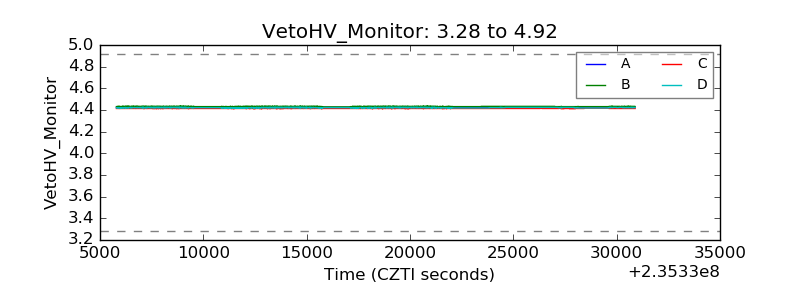 |
| Veto LLD | 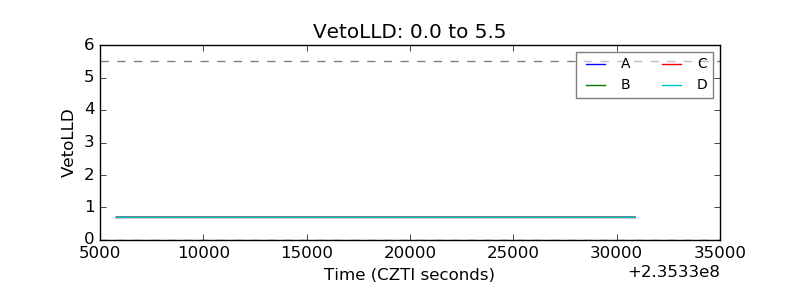 |
| Alpha Counter | 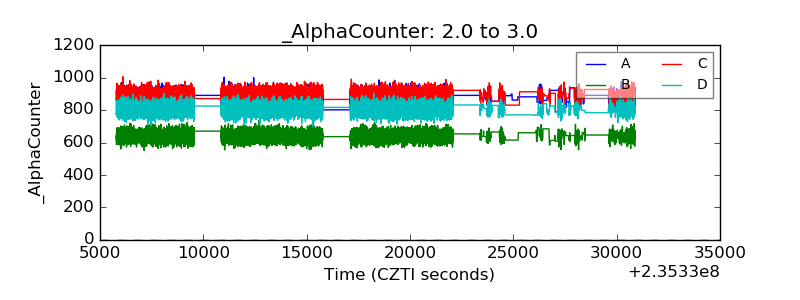 |
| _CPM_Rate | 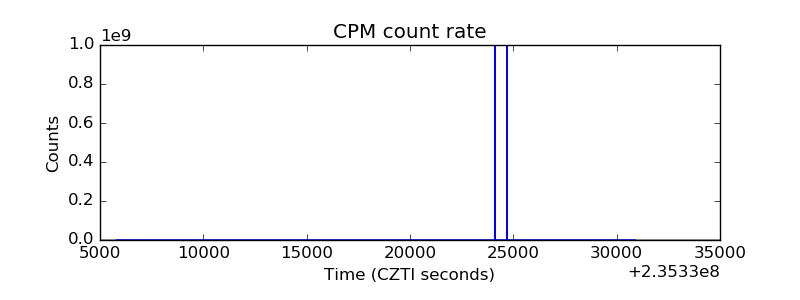 |
| CZT Counter |  |
| +2.5 Volts monitor |  |
| +5 Volts monitor | 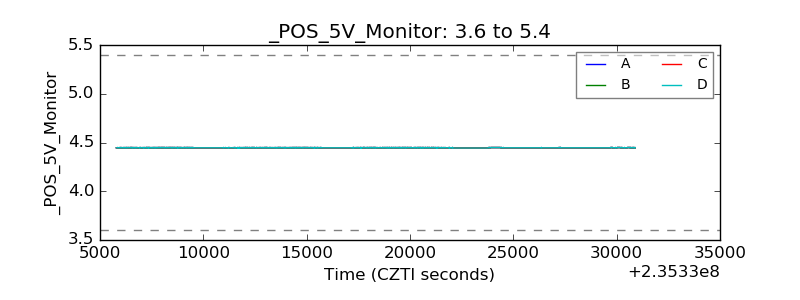 |
| _ROLL_ROT | 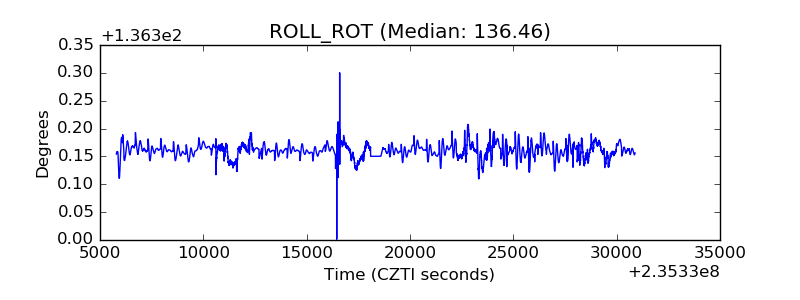 |
| _Roll_DEC | 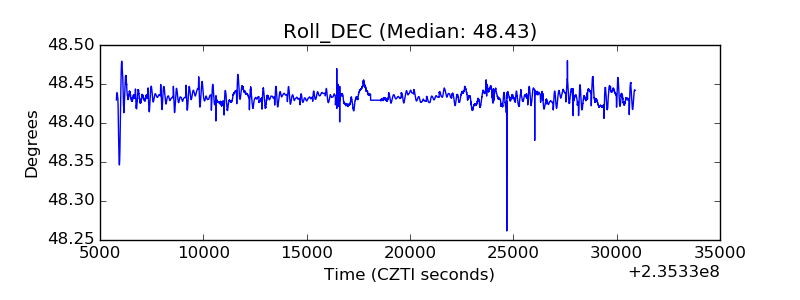 |
| _Roll_RA | 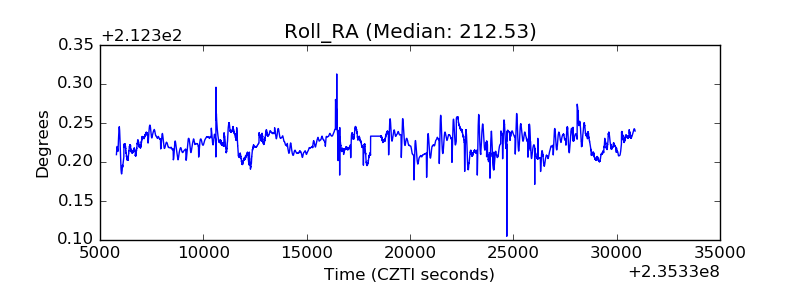 |
| Veto Counter | 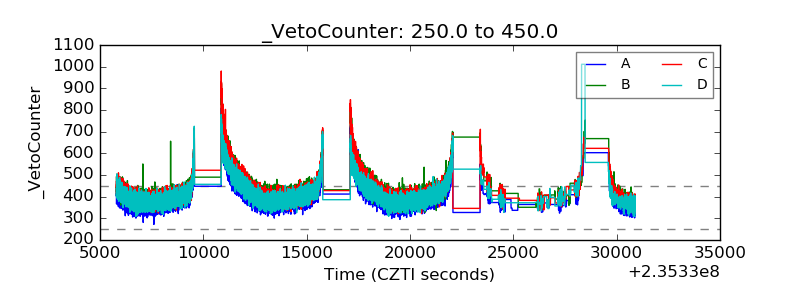 |