| Param | Original file | Final file |
|---|---|---|
| Filename | modeM0/AS1G07_077T03_9000001310_09295cztM0_level2.evt | modeM0/AS1G07_077T03_9000001310_09295cztM0_level2_quad_clean.evt |
| Size (bytes) | 1,764,299,520 | 325,739,520 |
| Size | 1.6 GB | 310.6 MB |
| Events in quadrant A | 15,370,402 | 2,013,854 |
| Events in quadrant B | 12,131,186 | 2,074,963 |
| Events in quadrant C | 11,479,936 | 2,061,355 |
| Events in quadrant D | 12,739,474 | 1,974,079 |
| Mode M9 | |||
|---|---|---|---|
| Quadrant | BADHDUFLAG | Total packets | Discarded packets |
| A | 0 | 57 | 2 |
| B | 0 | 57 | 0 |
| C | 0 | 57 | 2 |
| D | 0 | 57 | 1 |
| Mode M0 | |||
|---|---|---|---|
| Quadrant | BADHDUFLAG | Total packets | Discarded packets |
| A | 0 | 63875 | 1442 |
| B | 0 | 54410 | 1141 |
| C | 0 | 53084 | 1035 |
| D | 0 | 57504 | 1244 |
| Mode SS | |||
|---|---|---|---|
| Quadrant | BADHDUFLAG | Total packets | Discarded packets |
| A | 0 | 528 | 4 |
| B | 0 | 528 | 6 |
| C | 0 | 528 | 6 |
| D | 0 | 528 | 12 |
| Quadrant | Total seconds | Saturated seconds | Saturation percentage |
|---|---|---|---|
| A | 25259 | 434 | 1.718199% |
| B | 25302 | 232 | 0.916924% |
| C | 25325 | 87 | 0.343534% |
| D | 25305 | 239 | 0.944477% |
Noise dominated data is calculated using 1-second bins in cleaned event files. If a bin has >2000 counts, and if more than 50% of those come from <1% of pixels, then it is considered to be noise-dominated and hence unusable.
| Quadrant | # 1 sec bins | Bins with >0 counts | Bins with >2000 counts | High rate bins dominated by noise | Noise dominated (total time) | Noise dominated (detector-on time) | Marked lightcurve |
|---|---|---|---|---|---|---|---|
| A | 31529 | 25689 | 156 | 156 | 0.49% | 0.61% | 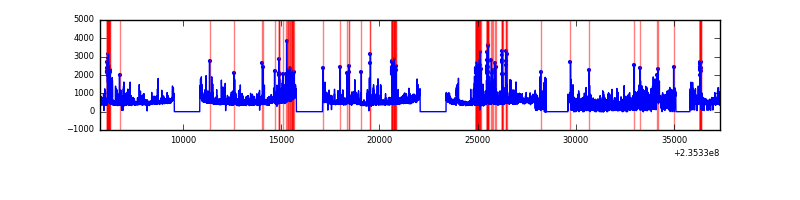 |
| B | 31529 | 25691 | 28 | 28 | 0.09% | 0.11% | 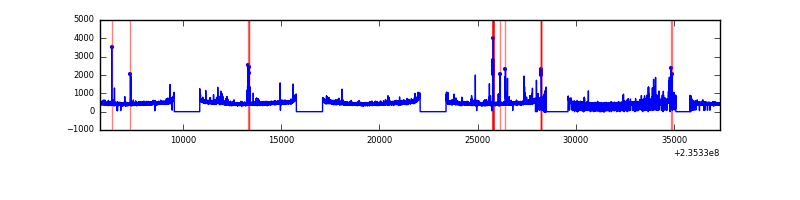 |
| C | 31529 | 25708 | 1 | 1 | 0.00% | 0.00% | 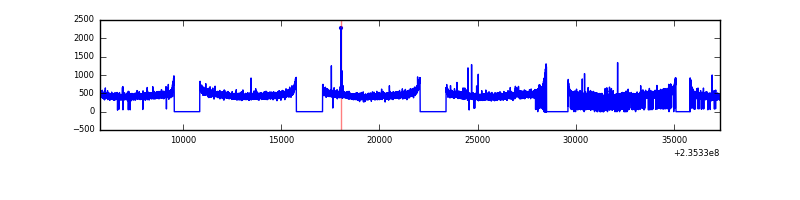 |
| D | 31529 | 25690 | 125 | 125 | 0.40% | 0.49% | 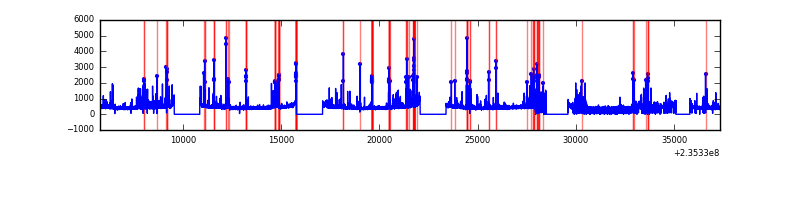 |
Top three noisy pixels from each quadrant. If the there are fewer than three noisy pixels in the level2.evt file, extra rows are filled as -1
| Pixel properties | Quadrant properties | ||||||
|---|---|---|---|---|---|---|---|
| Quadrant | DetID | PixID | Counts | Sigma | Mean | Median | Sigma |
| A | 8 | 5 | 2899524 | 4906.76 | 2952 | 2889 | 590.3 |
| A | 5 | 16 | 229058 | 383.12 | 2952 | 2889 | 590.3 |
| A | 12 | 236 | 228128 | 381.54 | 2952 | 2889 | 590.3 |
| B | 0 | 214 | 225360 | 398.6 | 2995 | 2920 | 558.1 |
| B | 4 | 173 | 94741 | 164.54 | 2995 | 2920 | 558.1 |
| B | 12 | 111 | 61353 | 104.71 | 2995 | 2920 | 558.1 |
| C | 14 | 67 | 46136 | 64.72 | 2920 | 2938 | 667.5 |
| C | 10 | 22 | 23907 | 31.42 | 2920 | 2938 | 667.5 |
| C | 13 | 61 | 22089 | 28.69 | 2920 | 2938 | 667.5 |
| D | 12 | 233 | 535684 | 761.68 | 2864 | 2792 | 699.6 |
| D | 1 | 52 | 521433 | 741.31 | 2864 | 2792 | 699.6 |
| D | 7 | 71 | 232736 | 328.67 | 2864 | 2792 | 699.6 |
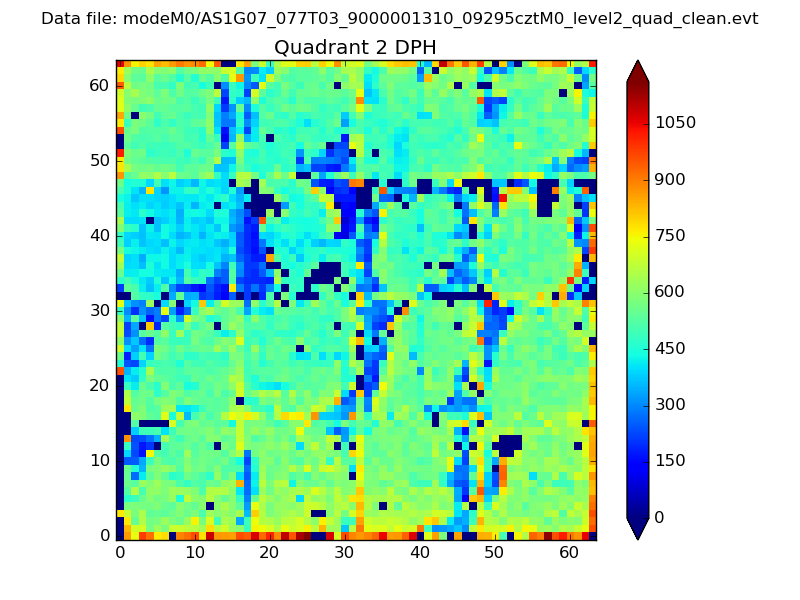
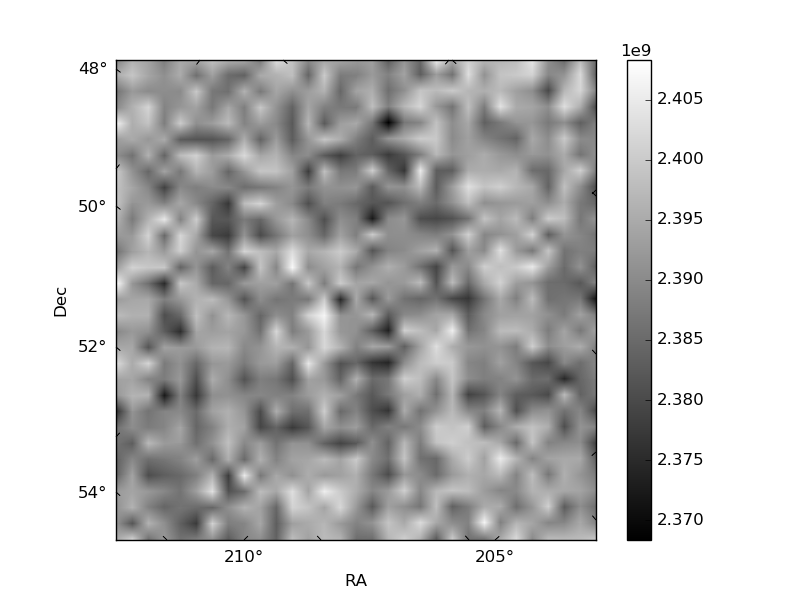
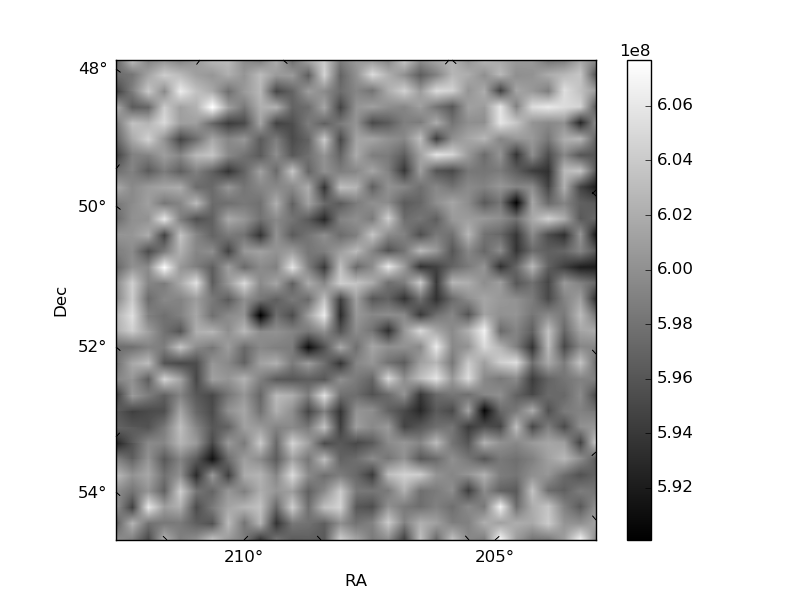
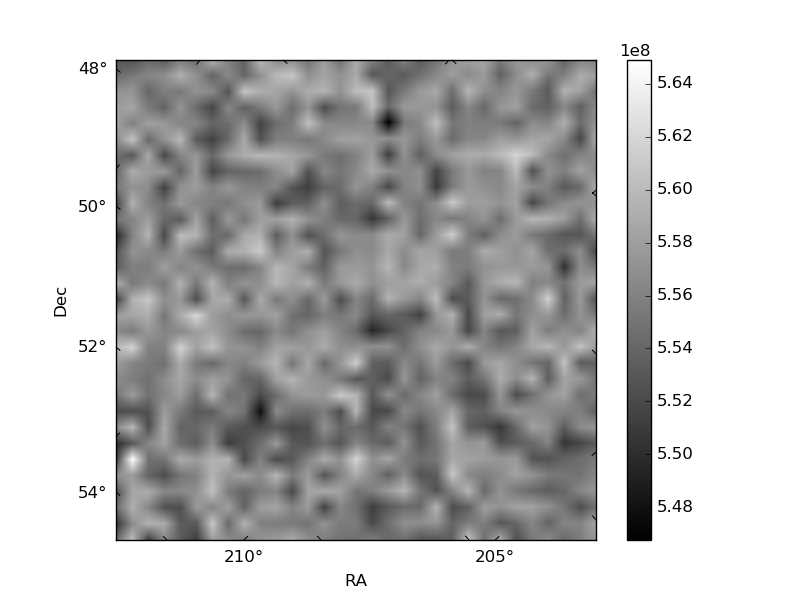
Histogram calculated using DETX and DETY for each event in the final _common_clean file
| Quadrant A | 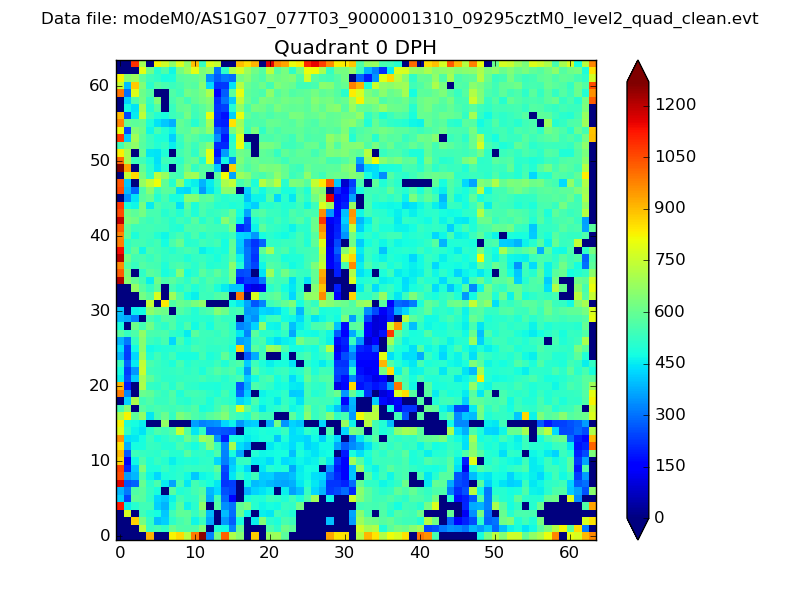 |
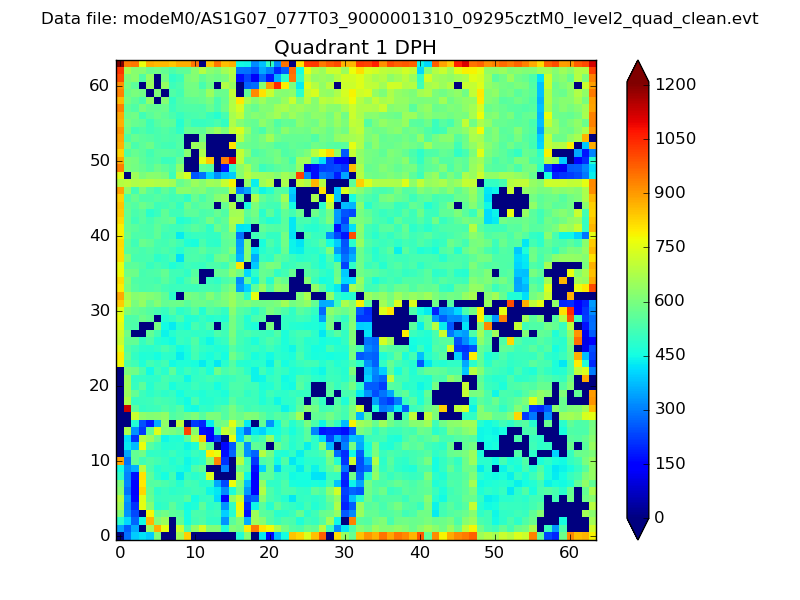 |
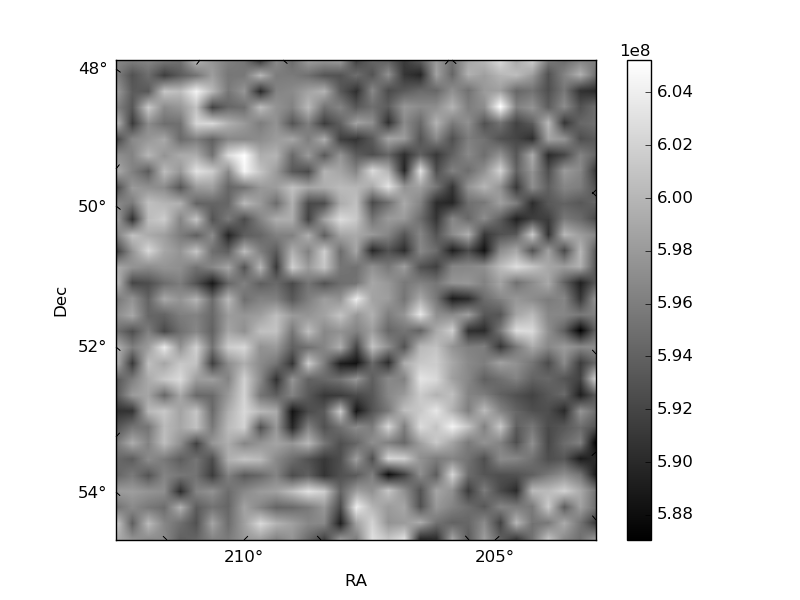
Quadrant B |
|---|---|---|---|
| Quadrant D | 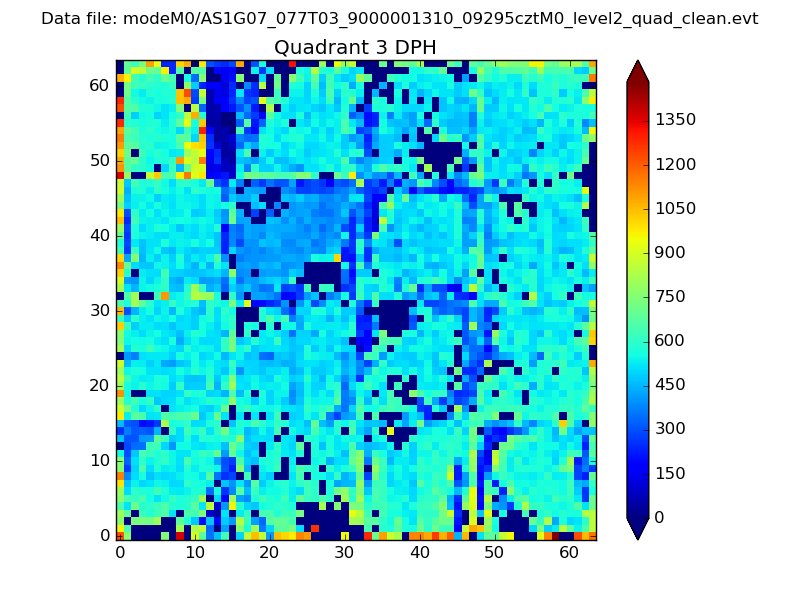 |
 |
Quadrant C |
| Plot type | Count rate plots | Images |
|---|---|---|
| Comparison with Poisson distribution Blue bars denote a histogram of data divided into 1 sec bins. Red curve is a Poisson curve with rate = median count rate of data. |
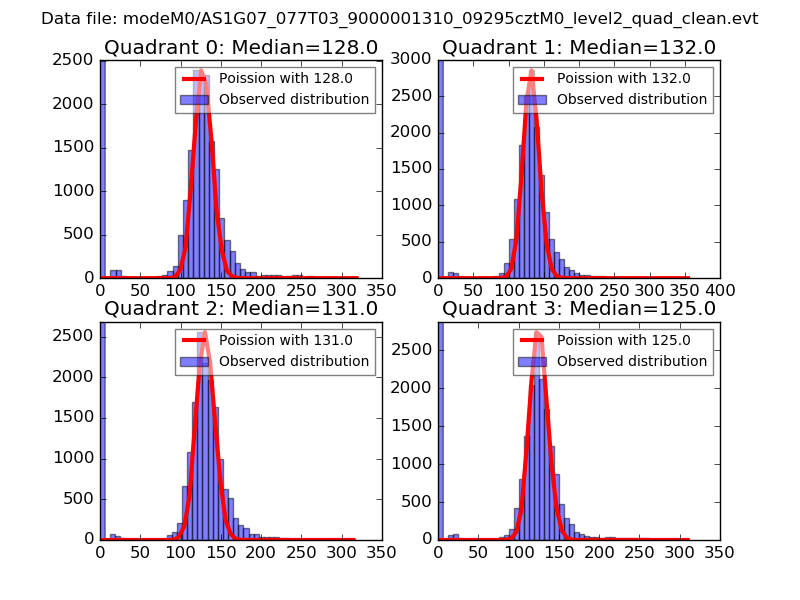 |
 |
| Quadrant-wise count rates Data is divided into 100 sec bins |
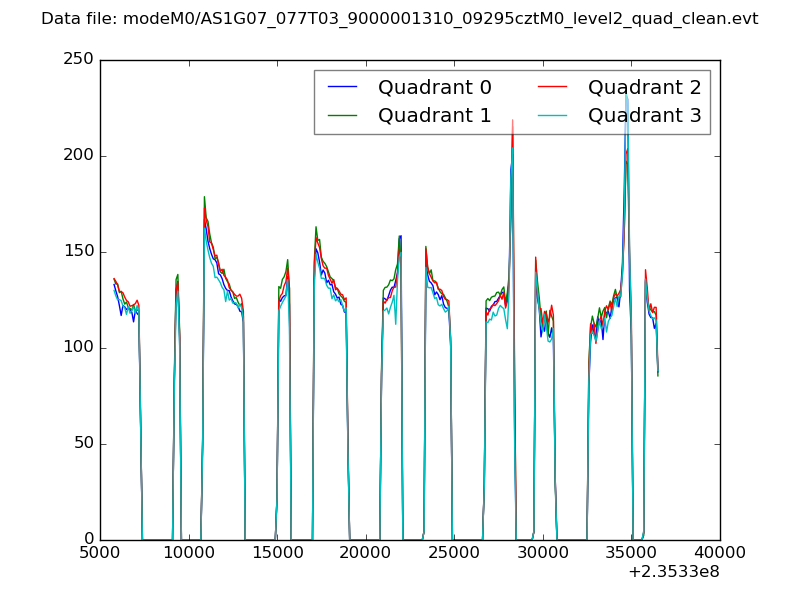 |
|
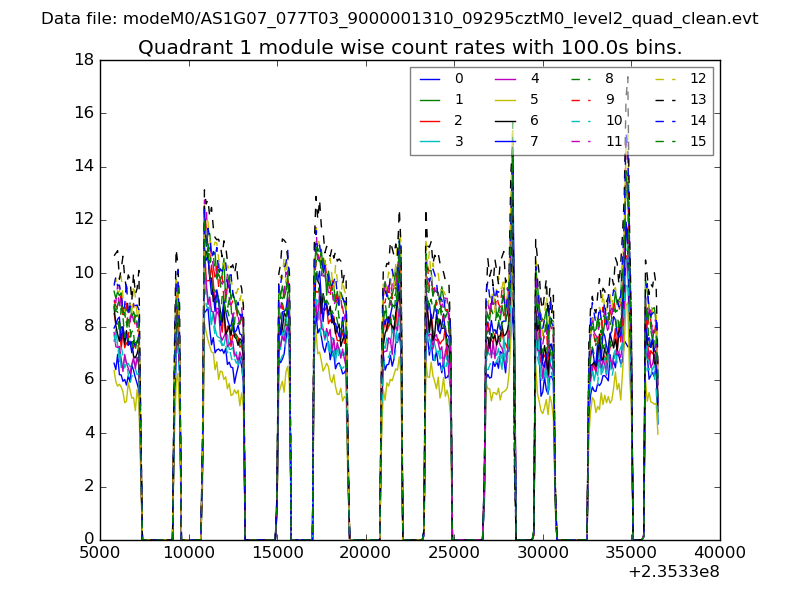
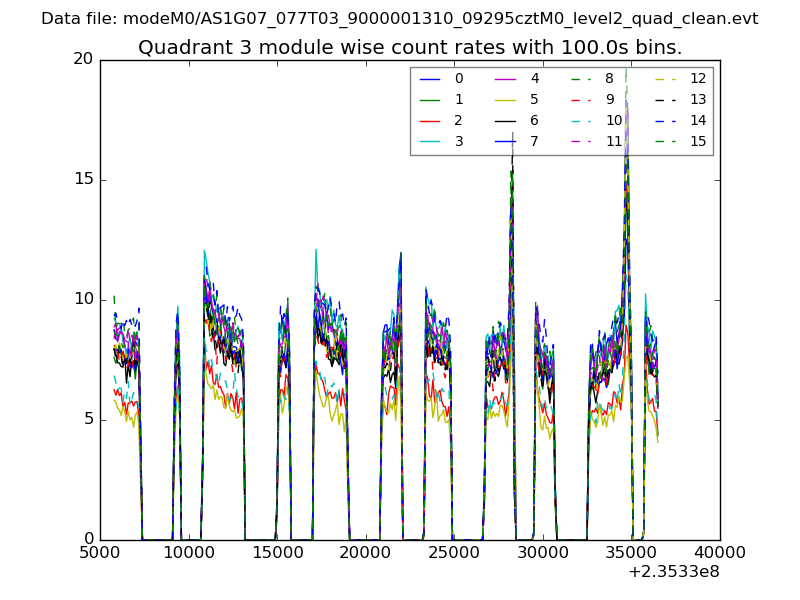
| Module-wise count rates for Quadrant A Data is divided into 100 sec bins |
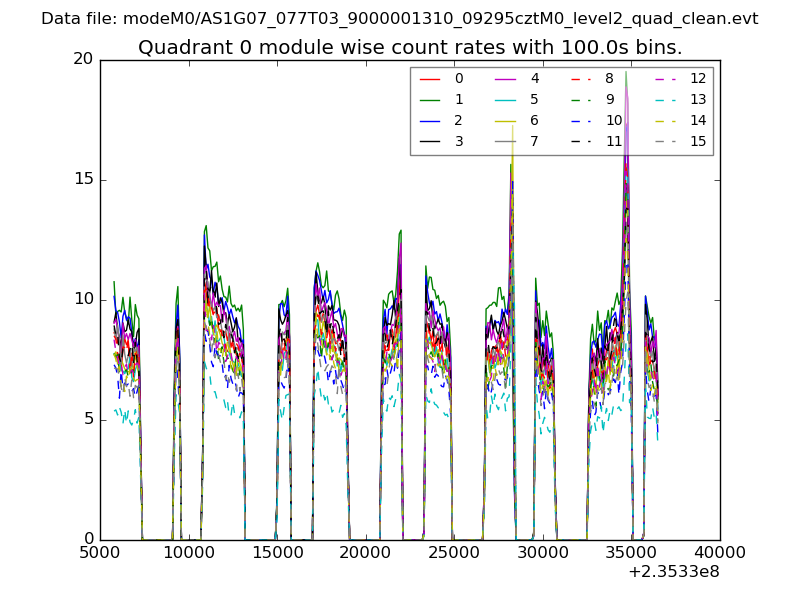 |
 |
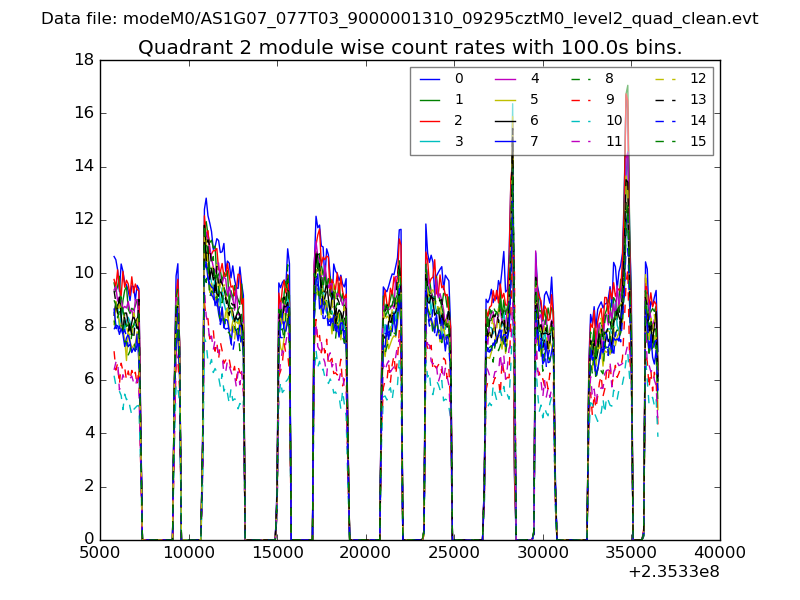
| Module-wise count rates for Quadrant B Data is divided into 100 sec bins |
 |
 |
| Module-wise count rates for Quadrant C Data is divided into 100 sec bins |
 |
 |
| Module-wise count rates for Quadrant D Data is divided into 100 sec bins |
 |
 |
| Parameter | Plot |
|---|---|
| CZT HV Monitor | 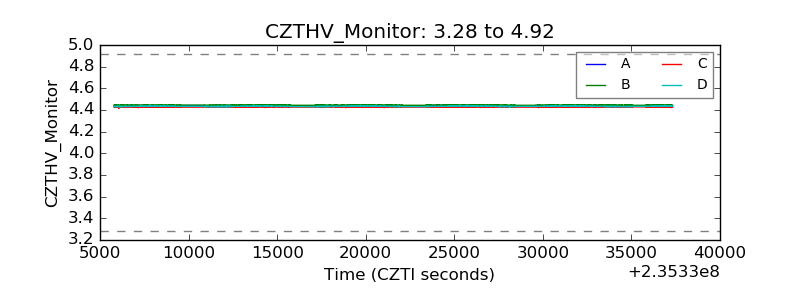 |
| D_VDD | 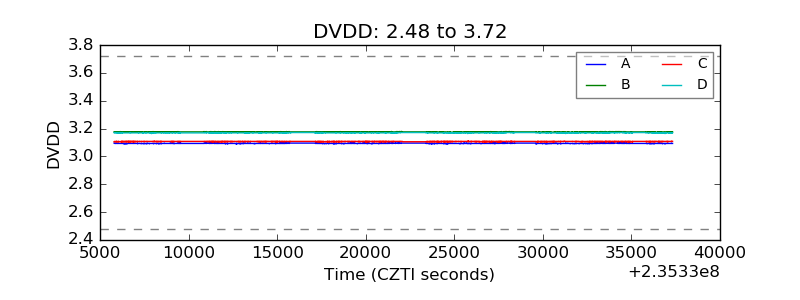 |
| Temperature 1 | 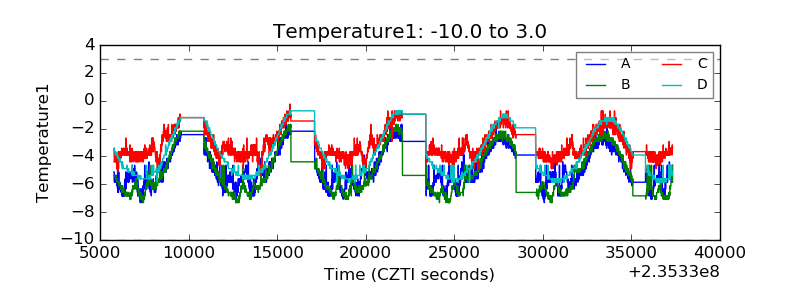 |
| Veto HV Monitor | 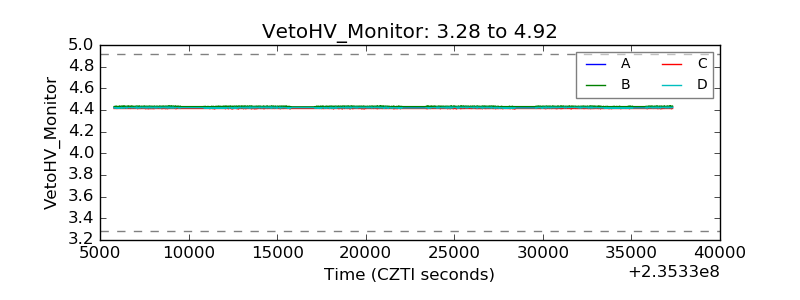 |
| Veto LLD | 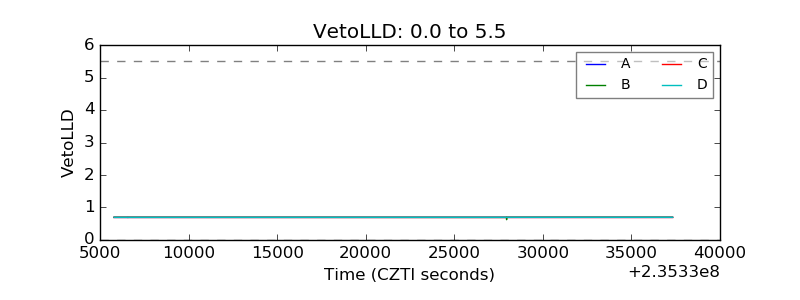 |
| Alpha Counter | 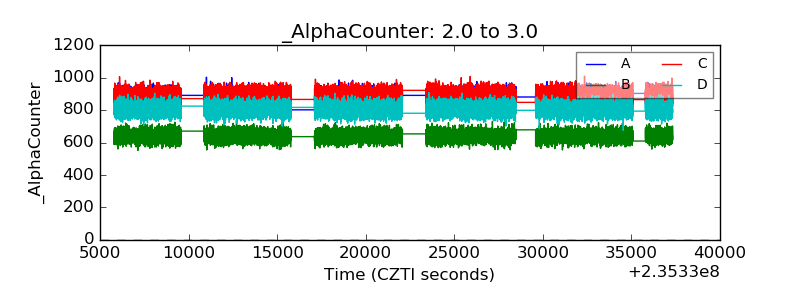 |
| _CPM_Rate | 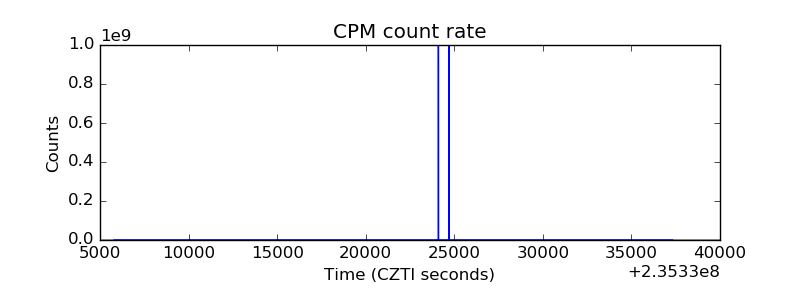 |
| CZT Counter | 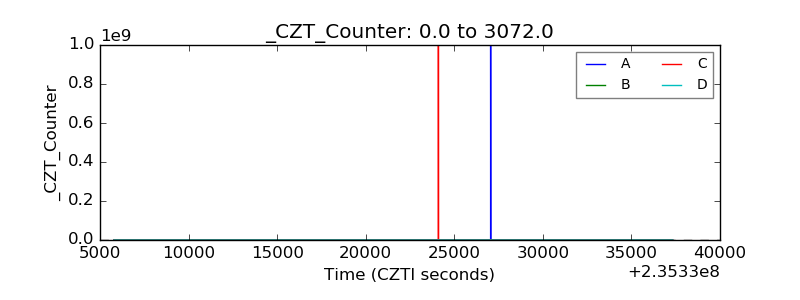 |
| +2.5 Volts monitor |  |
| +5 Volts monitor | 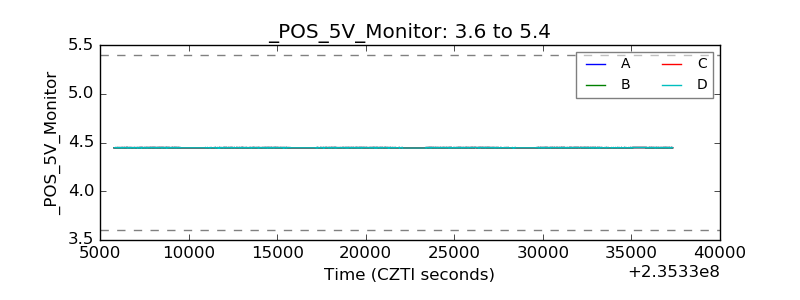 |
| _ROLL_ROT | 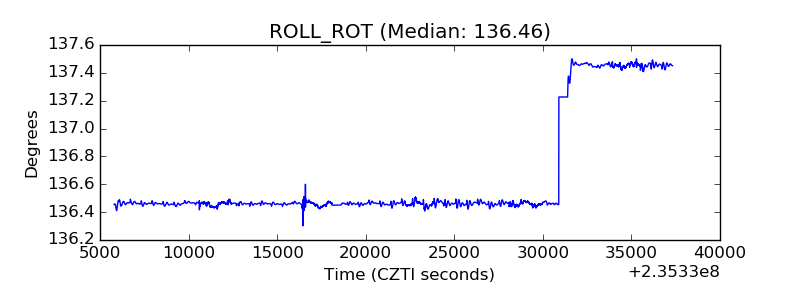 |
| _Roll_DEC | 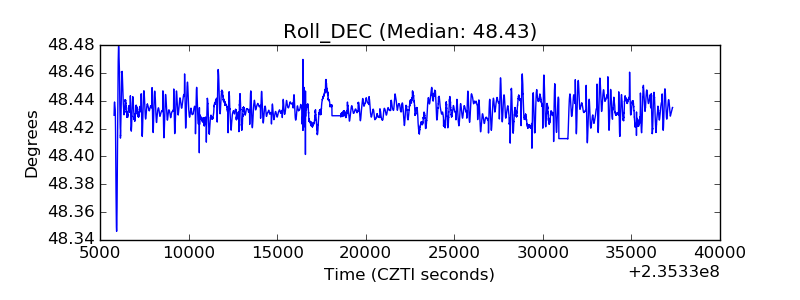 |
| _Roll_RA | 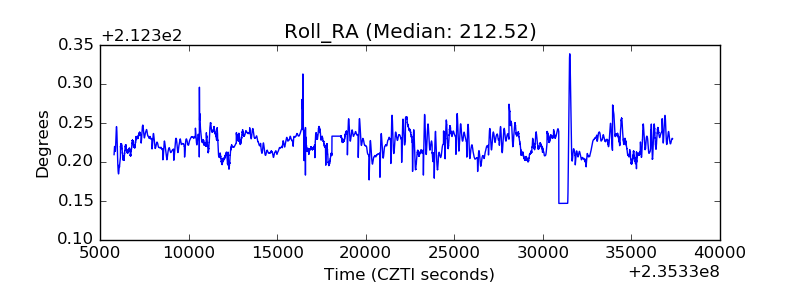 |
| Veto Counter | 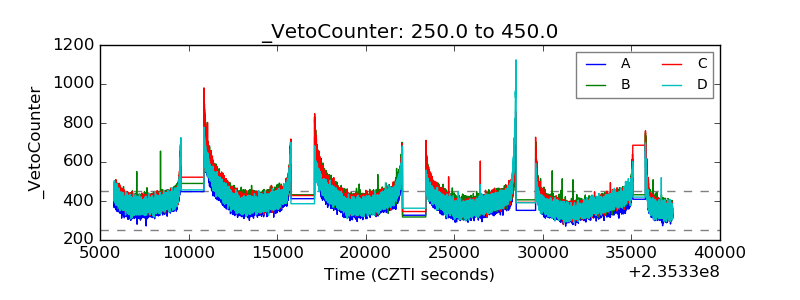 |