| Param | Original file | Final file |
|---|---|---|
| Filename | modeM0/AS1G07_077T03_9000001310_09296cztM0_level2.evt | modeM0/AS1G07_077T03_9000001310_09296cztM0_level2_quad_clean.evt |
| Size (bytes) | 566,038,080 | 104,662,080 |
| Size | 539.8 MB | 99.8 MB |
| Events in quadrant A | 4,728,861 | 649,083 |
| Events in quadrant B | 3,907,425 | 658,131 |
| Events in quadrant C | 3,752,034 | 660,749 |
| Events in quadrant D | 4,206,994 | 641,321 |
| Mode M9 | |||
|---|---|---|---|
| Quadrant | BADHDUFLAG | Total packets | Discarded packets |
| A | 0 | 10 | 0 |
| B | 0 | 10 | 0 |
| C | 0 | 10 | 0 |
| D | 0 | 10 | 0 |
| Mode M0 | |||
|---|---|---|---|
| Quadrant | BADHDUFLAG | Total packets | Discarded packets |
| A | 0 | 19608 | 294 |
| B | 0 | 17316 | 218 |
| C | 0 | 17043 | 188 |
| D | 0 | 18521 | 218 |
| Mode SS | |||
|---|---|---|---|
| Quadrant | BADHDUFLAG | Total packets | Discarded packets |
| A | 0 | 168 | 4 |
| B | 0 | 168 | 2 |
| C | 0 | 168 | 0 |
| D | 0 | 168 | 2 |
| Quadrant | Total seconds | Saturated seconds | Saturation percentage |
|---|---|---|---|
| A | 8039 | 253 | 3.147158% |
| B | 8052 | 225 | 2.794337% |
| C | 8060 | 124 | 1.538462% |
| D | 8054 | 220 | 2.731562% |
Noise dominated data is calculated using 1-second bins in cleaned event files. If a bin has >2000 counts, and if more than 50% of those come from <1% of pixels, then it is considered to be noise-dominated and hence unusable.
| Quadrant | # 1 sec bins | Bins with >0 counts | Bins with >2000 counts | High rate bins dominated by noise | Noise dominated (total time) | Noise dominated (detector-on time) | Marked lightcurve |
|---|---|---|---|---|---|---|---|
| A | 9171 | 8138 | 16 | 16 | 0.17% | 0.20% | 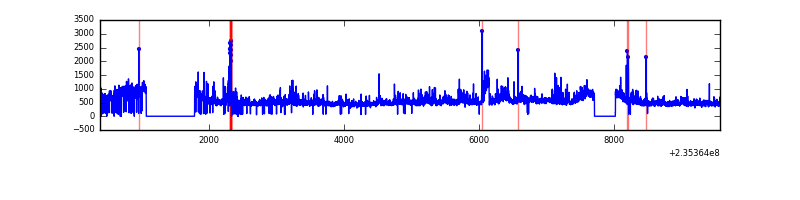 |
| B | 9171 | 8145 | 6 | 6 | 0.07% | 0.07% | 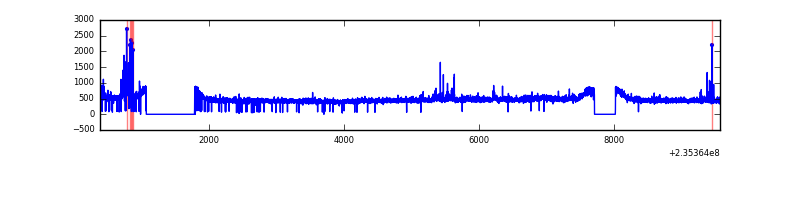 |
| C | 9171 | 8143 | 6 | 6 | 0.07% | 0.07% | 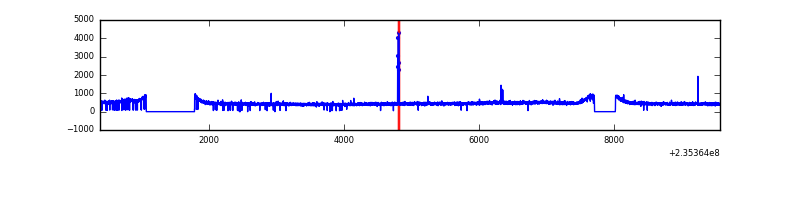 |
| D | 9171 | 8143 | 90 | 90 | 0.98% | 1.11% | 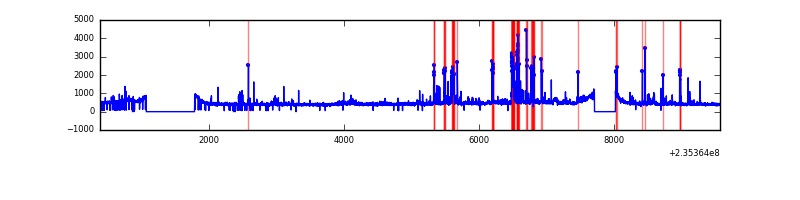 |
Top three noisy pixels from each quadrant. If the there are fewer than three noisy pixels in the level2.evt file, extra rows are filled as -1
| Pixel properties | Quadrant properties | ||||||
|---|---|---|---|---|---|---|---|
| Quadrant | DetID | PixID | Counts | Sigma | Mean | Median | Sigma |
| A | 8 | 5 | 854870 | 4327.13 | 954 | 932 | 197.3 |
| A | 15 | 239 | 157922 | 795.51 | 954 | 932 | 197.3 |
| A | 1 | 162 | 23313 | 113.41 | 954 | 932 | 197.3 |
| B | 0 | 214 | 71923 | 384.21 | 963 | 936 | 184.8 |
| B | 4 | 80 | 46744 | 247.93 | 963 | 936 | 184.8 |
| B | 12 | 111 | 20770 | 107.35 | 963 | 936 | 184.8 |
| C | 10 | 22 | 32329 | 143.72 | 944 | 948 | 218.3 |
| C | 14 | 67 | 30429 | 135.02 | 944 | 948 | 218.3 |
| C | 13 | 61 | 7027 | 27.84 | 944 | 948 | 218.3 |
| D | 12 | 227 | 204604 | 867.03 | 930 | 904 | 234.9 |
| D | 12 | 233 | 156627 | 662.82 | 930 | 904 | 234.9 |
| D | 1 | 52 | 125558 | 530.58 | 930 | 904 | 234.9 |
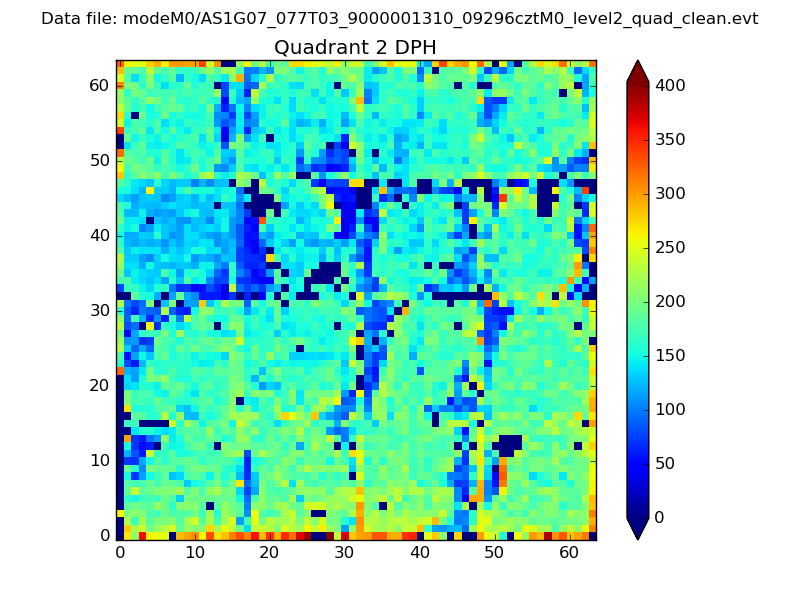
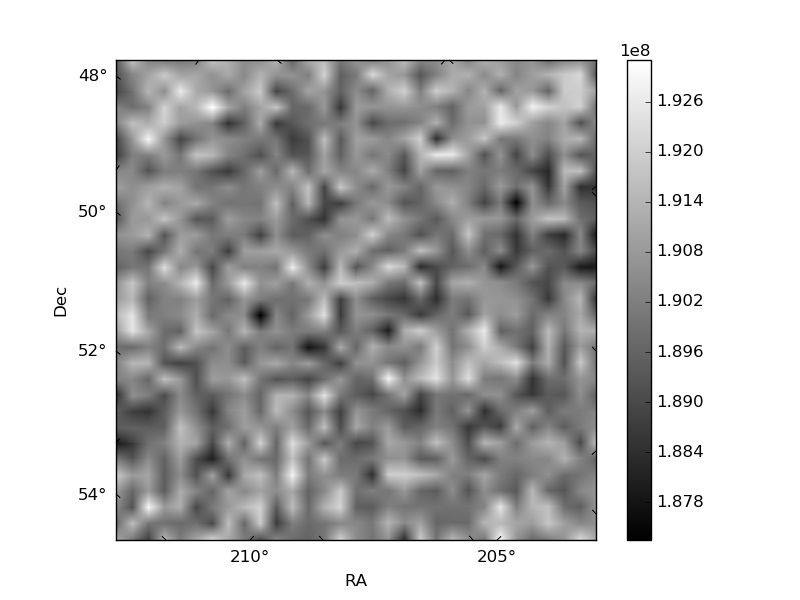
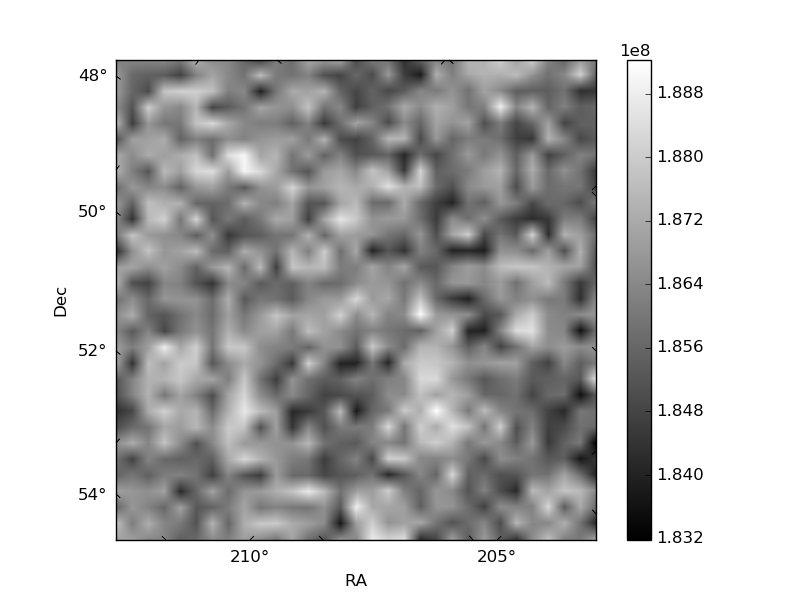
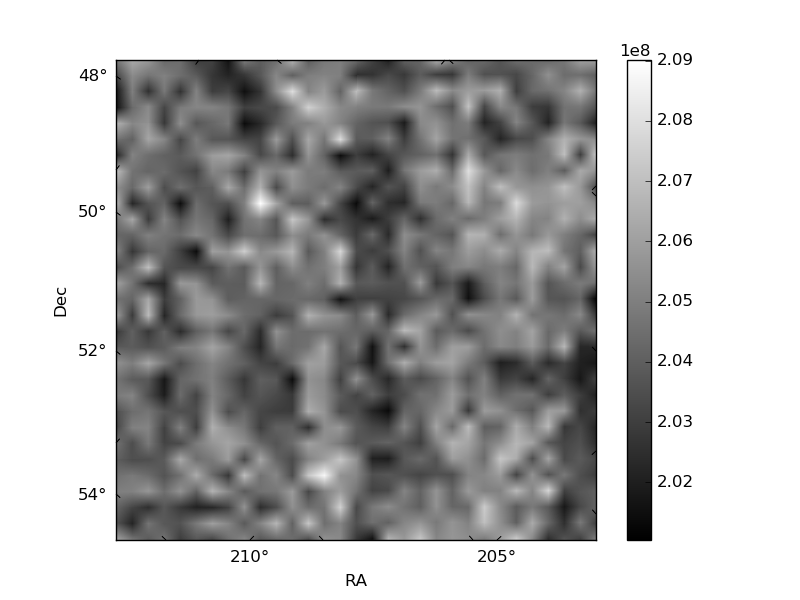
Histogram calculated using DETX and DETY for each event in the final _common_clean file
| Quadrant A | 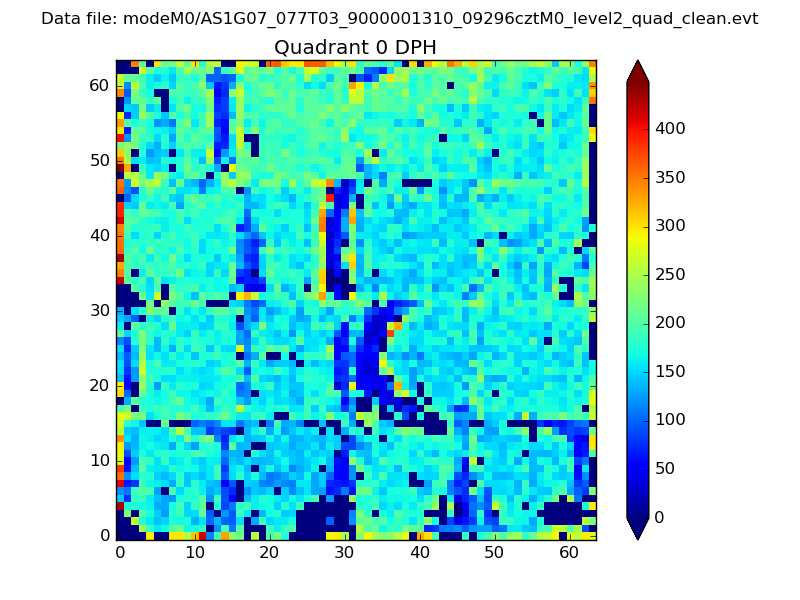 |
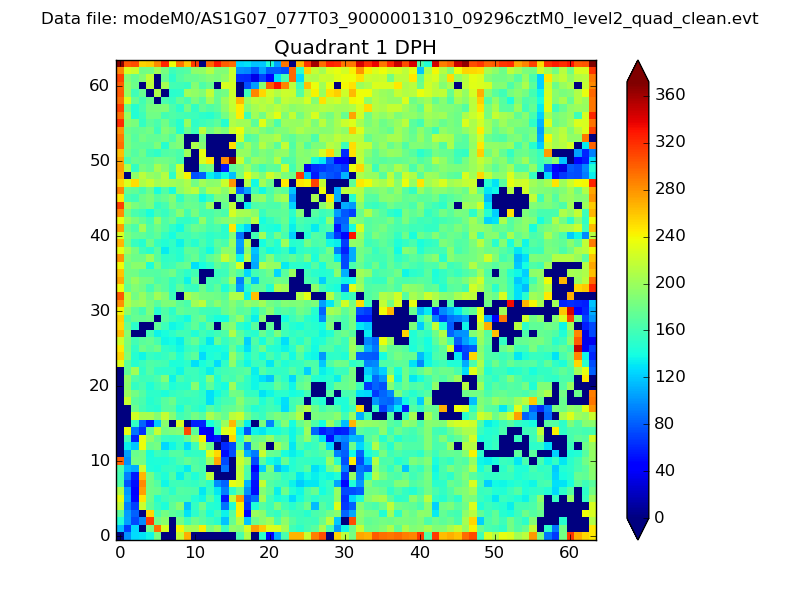 |
Quadrant B |
|---|---|---|---|
| Quadrant D | 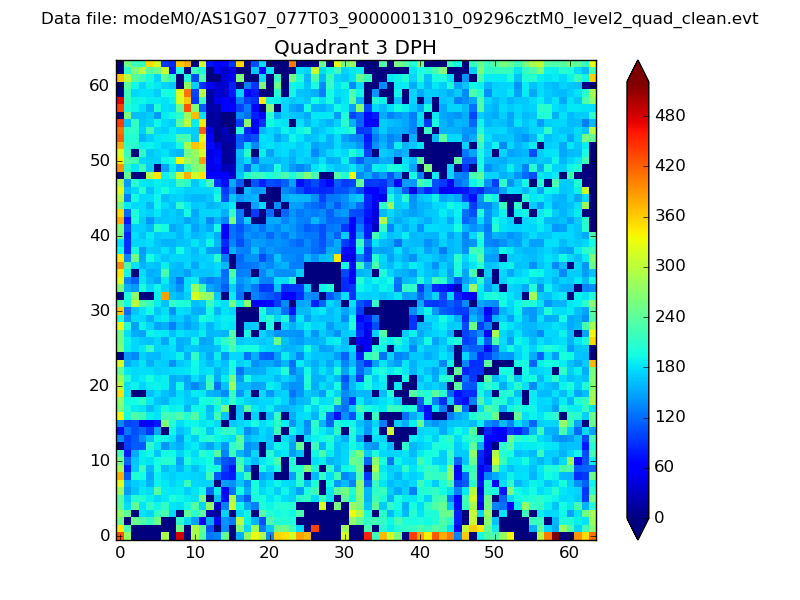 |
 |
Quadrant C |
| Plot type | Count rate plots | Images |
|---|---|---|
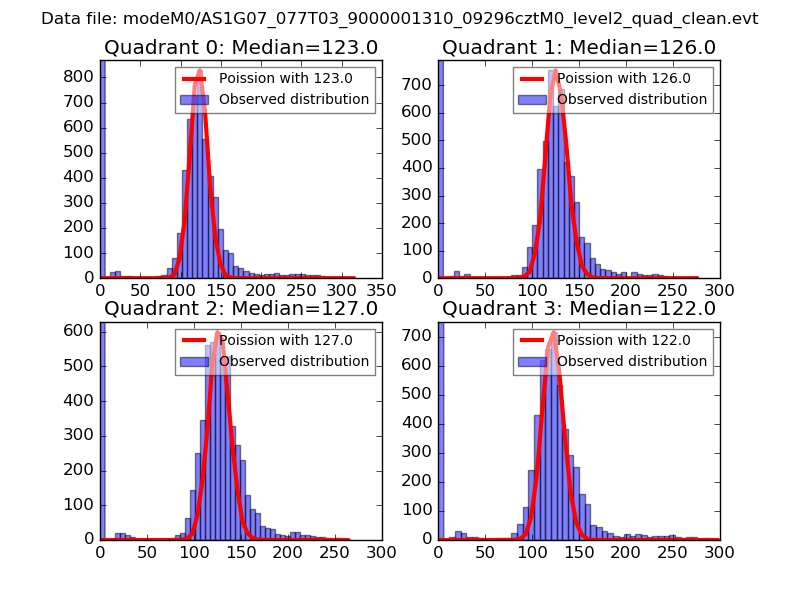
| Comparison with Poisson distribution Blue bars denote a histogram of data divided into 1 sec bins. Red curve is a Poisson curve with rate = median count rate of data. |
 |
 |
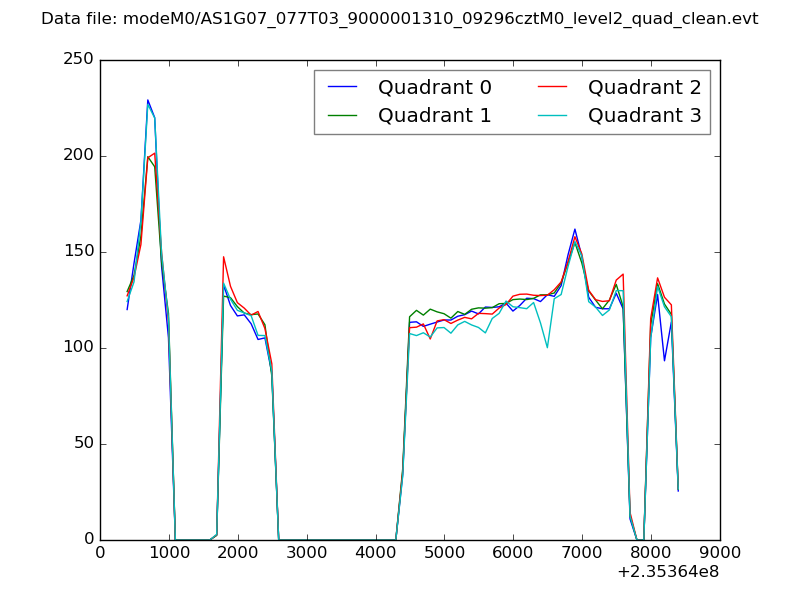
| Quadrant-wise count rates Data is divided into 100 sec bins |
 |
|
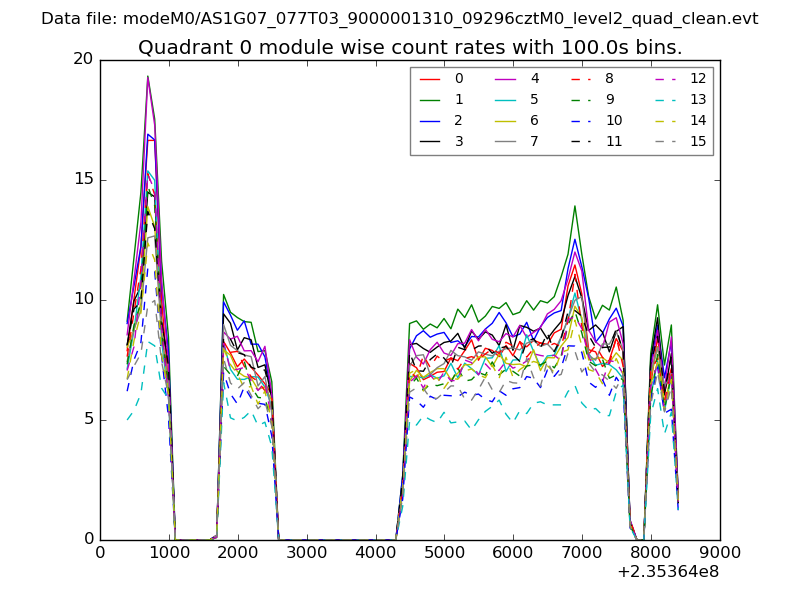
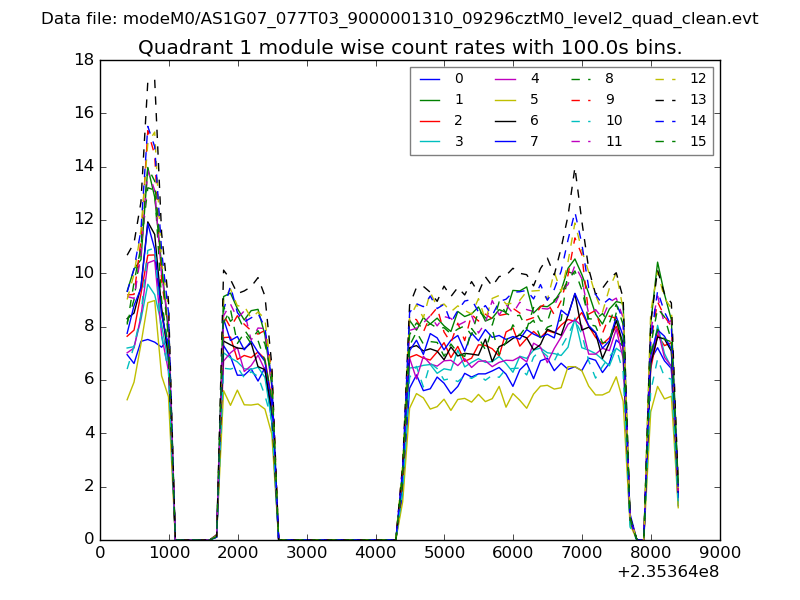
| Module-wise count rates for Quadrant A Data is divided into 100 sec bins |
 |
 |
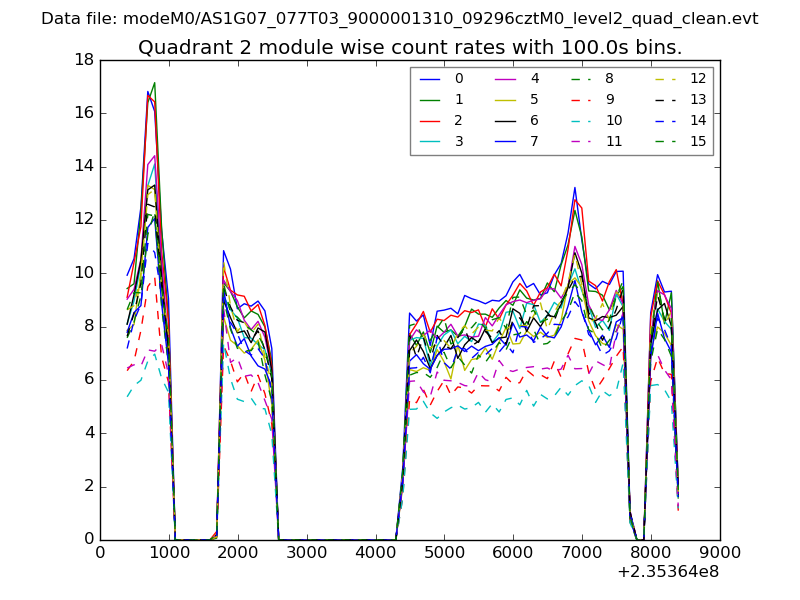
| Module-wise count rates for Quadrant B Data is divided into 100 sec bins |
 |
 |
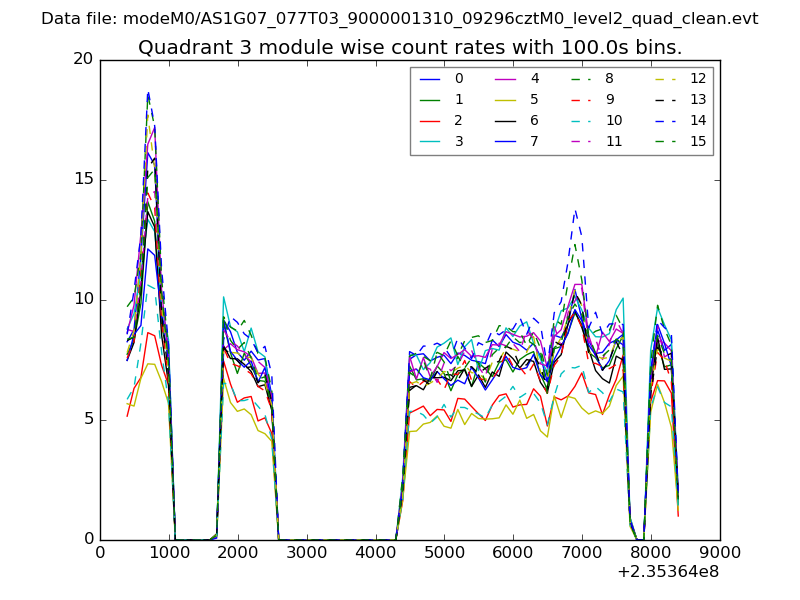
| Module-wise count rates for Quadrant C Data is divided into 100 sec bins |
 |
 |
| Module-wise count rates for Quadrant D Data is divided into 100 sec bins |
 |
 |
| Parameter | Plot |
|---|---|
| CZT HV Monitor | 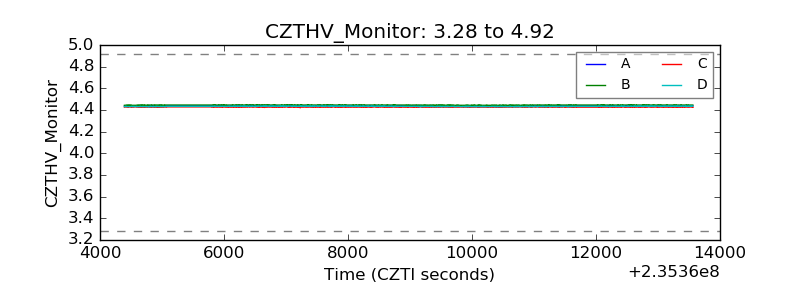 |
| D_VDD | 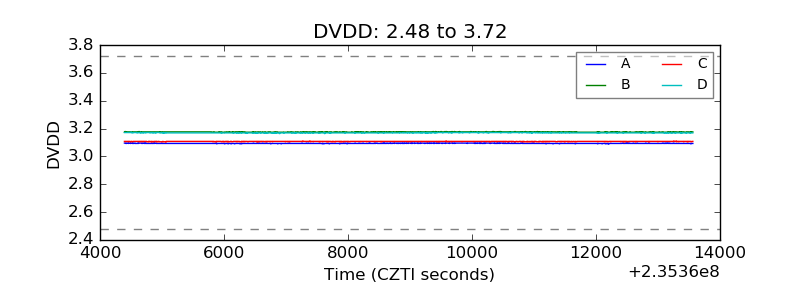 |
| Temperature 1 |  |
| Veto HV Monitor | 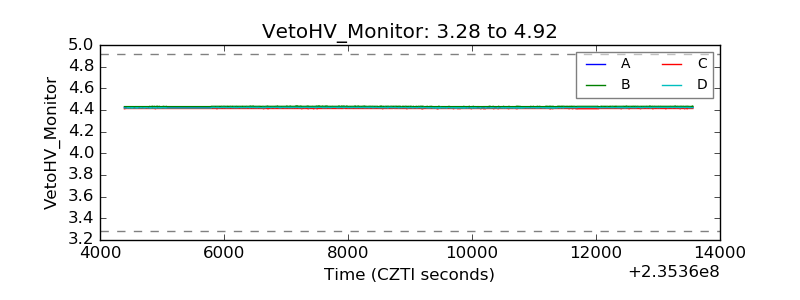 |
| Veto LLD | 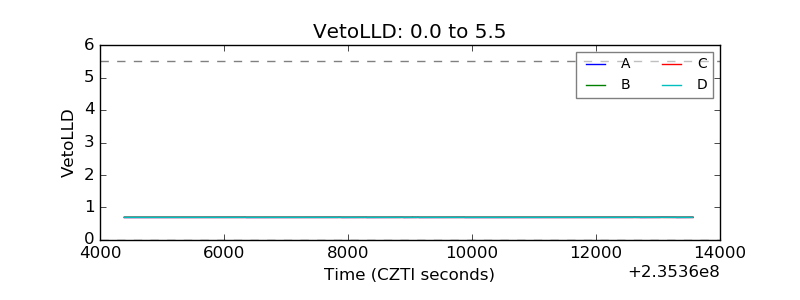 |
| Alpha Counter | 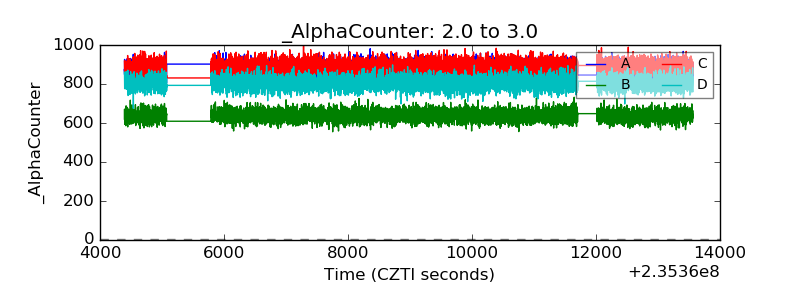 |
| _CPM_Rate | 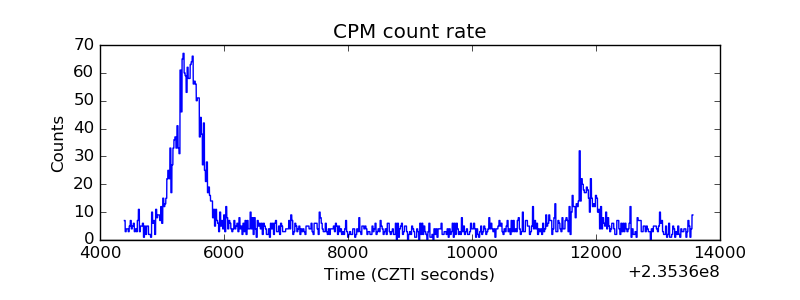 |
| CZT Counter | 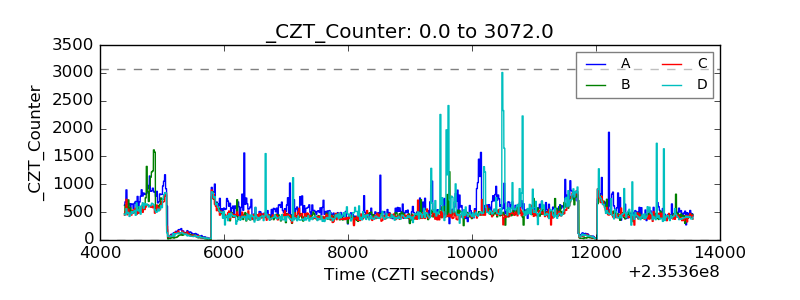 |
| +2.5 Volts monitor |  |
| +5 Volts monitor |  |
| _ROLL_ROT | 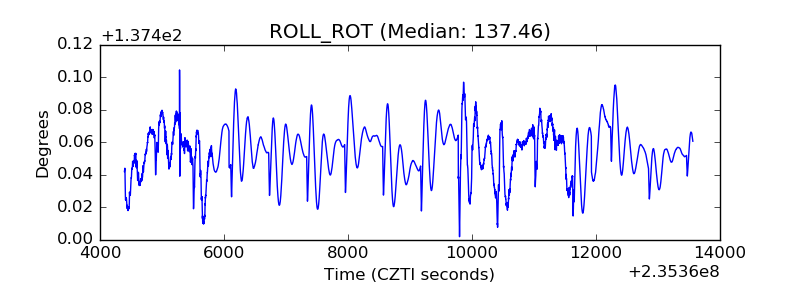 |
| _Roll_DEC | 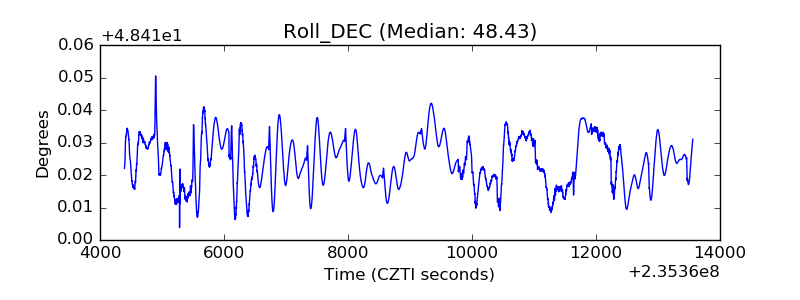 |
| _Roll_RA | 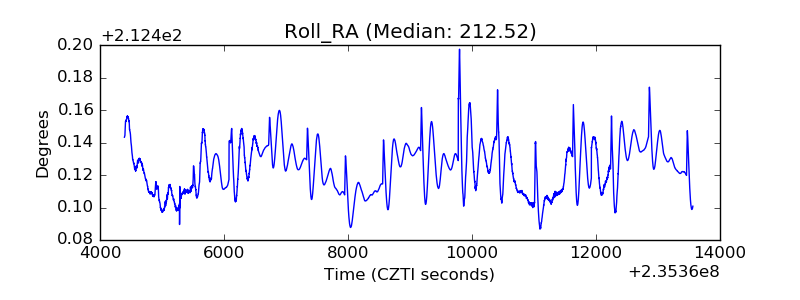 |
| Veto Counter | 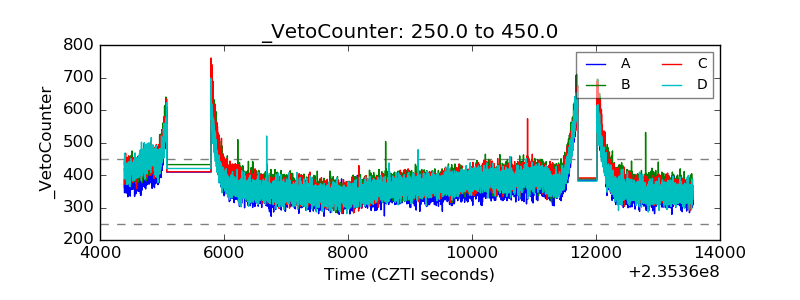 |