| Param | Original file | Final file |
|---|---|---|
| Filename | modeM0/AS1G07_077T03_9000001310_09298cztM0_level2.evt | modeM0/AS1G07_077T03_9000001310_09298cztM0_level2_quad_clean.evt |
| Size (bytes) | 536,768,640 | 82,540,800 |
| Size | 511.9 MB | 78.7 MB |
| Events in quadrant A | 4,610,860 | 490,390 |
| Events in quadrant B | 3,502,561 | 518,445 |
| Events in quadrant C | 3,366,322 | 515,008 |
| Events in quadrant D | 4,282,307 | 469,686 |
| Mode M9 | |||
|---|---|---|---|
| Quadrant | BADHDUFLAG | Total packets | Discarded packets |
| A | 0 | 5 | 0 |
| B | 0 | 5 | 0 |
| C | 0 | 5 | 0 |
| D | 0 | 5 | 0 |
| Mode M0 | |||
|---|---|---|---|
| Quadrant | BADHDUFLAG | Total packets | Discarded packets |
| A | 0 | 21548 | 3156 |
| B | 0 | 17599 | 2216 |
| C | 0 | 17387 | 2192 |
| D | 0 | 22151 | 4423 |
| Mode SS | |||
|---|---|---|---|
| Quadrant | BADHDUFLAG | Total packets | Discarded packets |
| A | 0 | 172 | 32 |
| B | 0 | 171 | 23 |
| C | 0 | 172 | 26 |
| D | 0 | 172 | 26 |
| Quadrant | Total seconds | Saturated seconds | Saturation percentage |
|---|---|---|---|
| A | 7213 | 480 | 6.654651% |
| B | 7356 | 364 | 4.948341% |
| C | 7344 | 265 | 3.608388% |
| D | 7138 | 558 | 7.817316% |
Noise dominated data is calculated using 1-second bins in cleaned event files. If a bin has >2000 counts, and if more than 50% of those come from <1% of pixels, then it is considered to be noise-dominated and hence unusable.
| Quadrant | # 1 sec bins | Bins with >0 counts | Bins with >2000 counts | High rate bins dominated by noise | Noise dominated (total time) | Noise dominated (detector-on time) | Marked lightcurve |
|---|---|---|---|---|---|---|---|
| A | 8865 | 7918 | 94 | 94 | 1.06% | 1.19% | 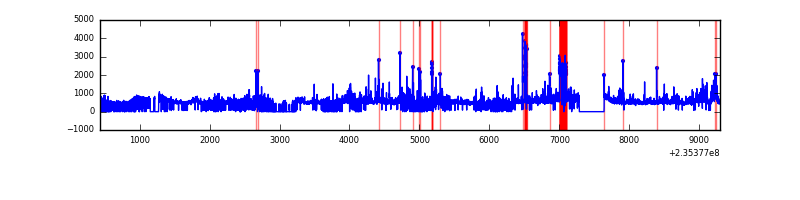 |
| B | 8865 | 7995 | 1 | 1 | 0.01% | 0.01% | 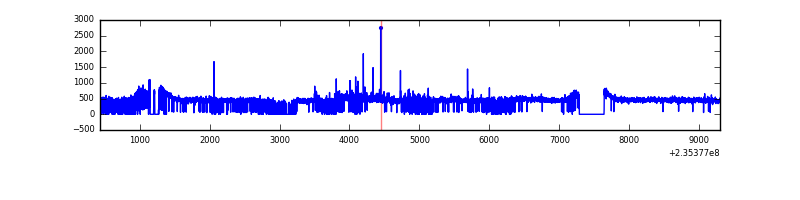 |
| C | 8865 | 7976 | 0 | 0 | 0.00% | 0.00% | 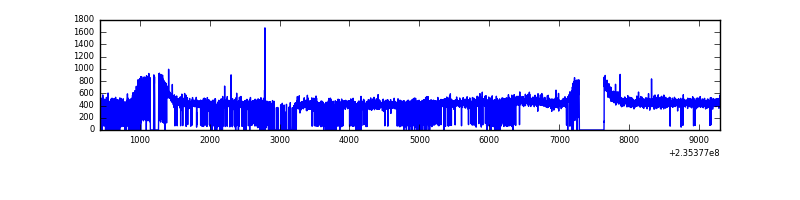 |
| D | 8865 | 7811 | 252 | 252 | 2.84% | 3.23% | 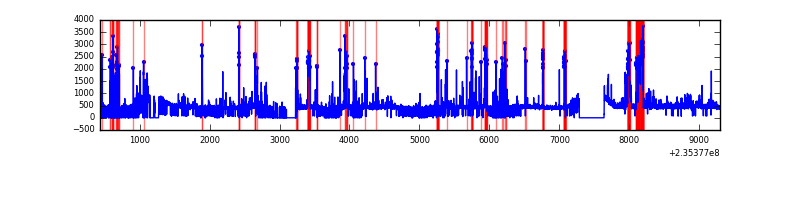 |
Top three noisy pixels from each quadrant. If the there are fewer than three noisy pixels in the level2.evt file, extra rows are filled as -1
| Pixel properties | Quadrant properties | ||||||
|---|---|---|---|---|---|---|---|
| Quadrant | DetID | PixID | Counts | Sigma | Mean | Median | Sigma |
| A | 8 | 5 | 1132156 | 6528.45 | 843 | 822 | 173.3 |
| A | 5 | 16 | 74926 | 427.62 | 843 | 822 | 173.3 |
| A | 1 | 162 | 47308 | 268.25 | 843 | 822 | 173.3 |
| B | 0 | 214 | 52462 | 306.84 | 871 | 846 | 168.2 |
| B | 4 | 80 | 34614 | 200.74 | 871 | 846 | 168.2 |
| B | 12 | 111 | 19487 | 110.81 | 871 | 846 | 168.2 |
| C | 14 | 67 | 34672 | 172.39 | 849 | 851 | 196.2 |
| C | 13 | 61 | 6584 | 29.22 | 849 | 851 | 196.2 |
| C | 8 | 128 | 5959 | 26.03 | 849 | 851 | 196.2 |
| D | 12 | 227 | 767618 | 3910.32 | 805 | 782 | 196.1 |
| D | 1 | 52 | 277646 | 1411.81 | 805 | 782 | 196.1 |
| D | 2 | 136 | 64398 | 324.4 | 805 | 782 | 196.1 |
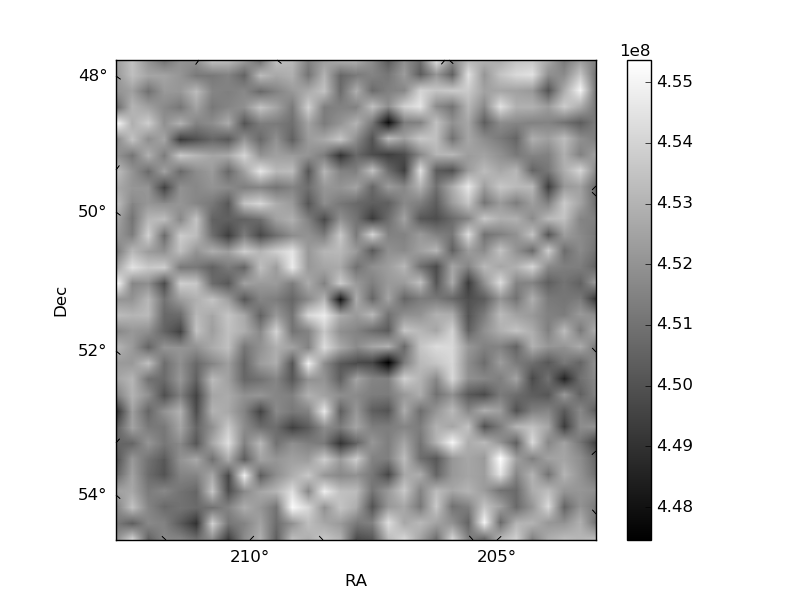
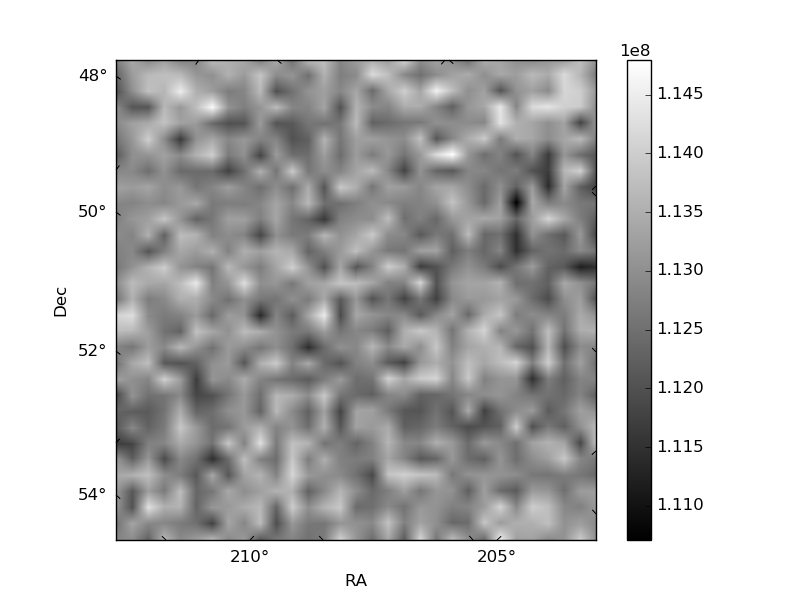
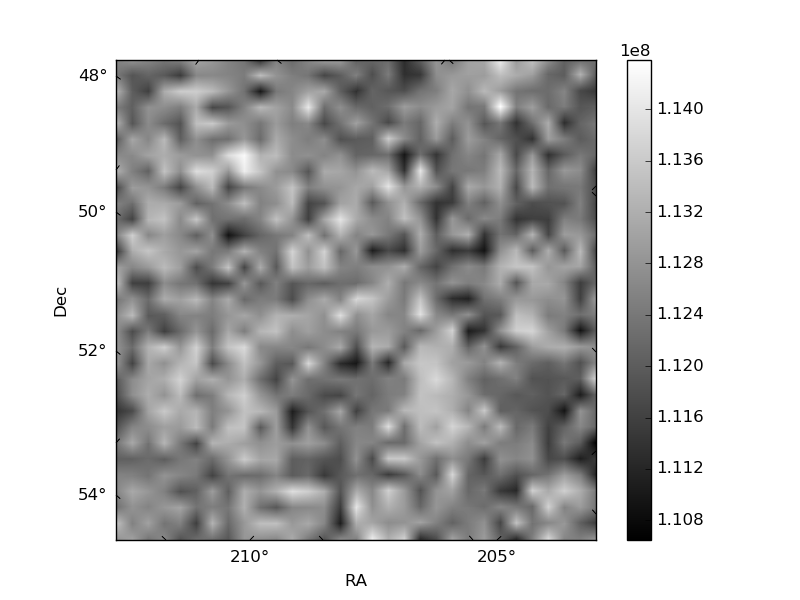
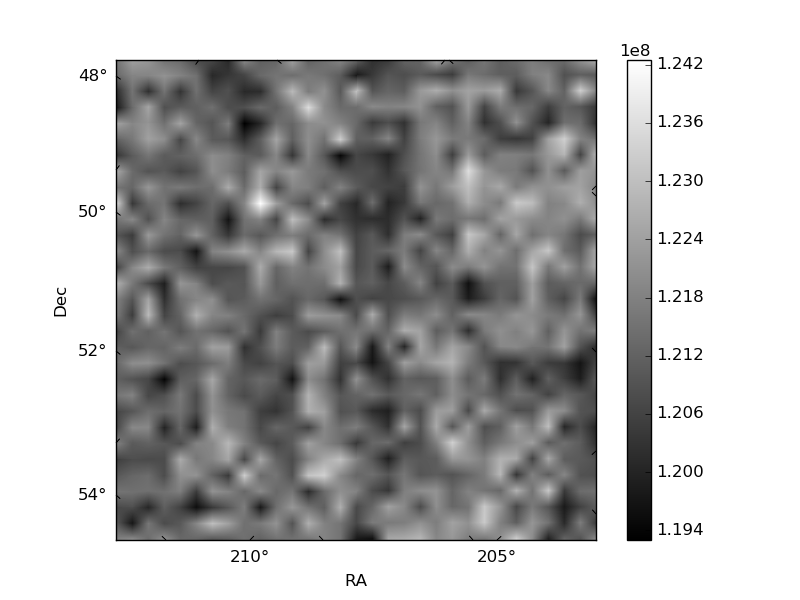
Histogram calculated using DETX and DETY for each event in the final _common_clean file
| Quadrant A | 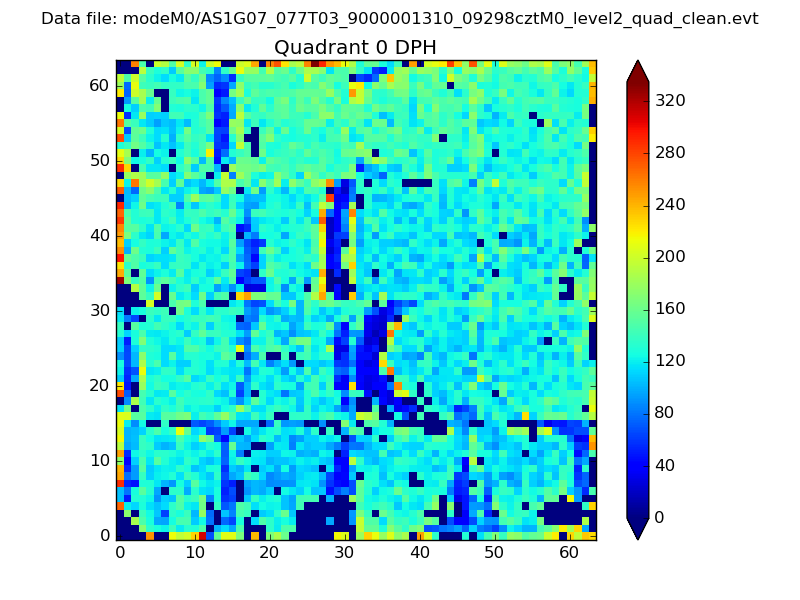 |
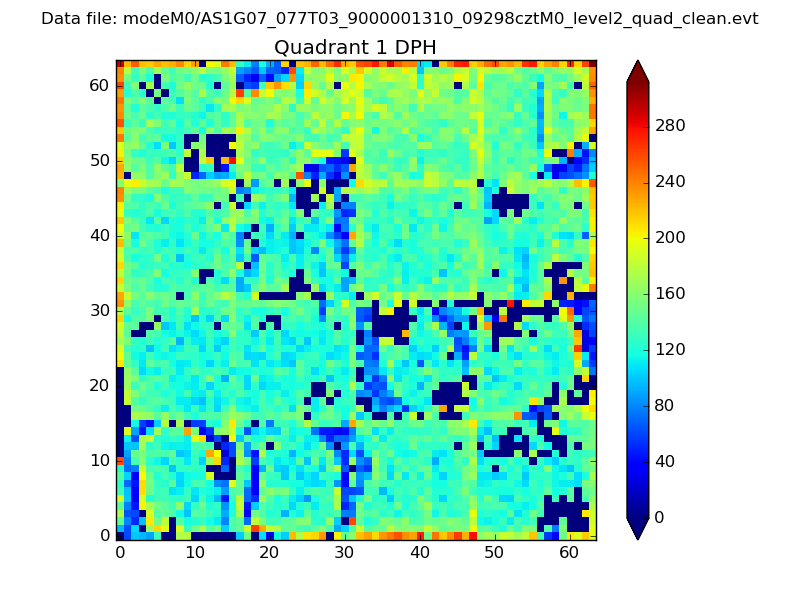 |
Quadrant B |
|---|---|---|---|
| Quadrant D | 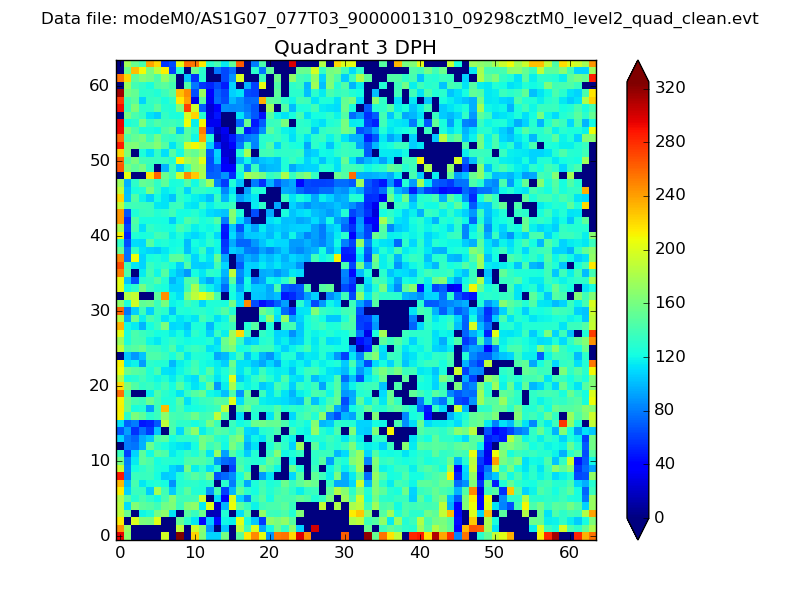 |
 |
Quadrant C |
| Plot type | Count rate plots | Images |
|---|---|---|
| Comparison with Poisson distribution Blue bars denote a histogram of data divided into 1 sec bins. Red curve is a Poisson curve with rate = median count rate of data. |
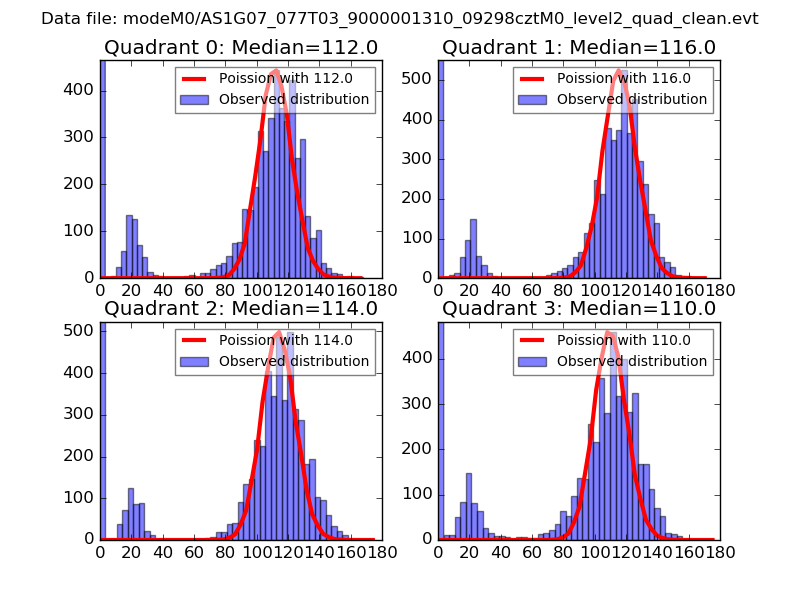 |
 |
| Quadrant-wise count rates Data is divided into 100 sec bins |
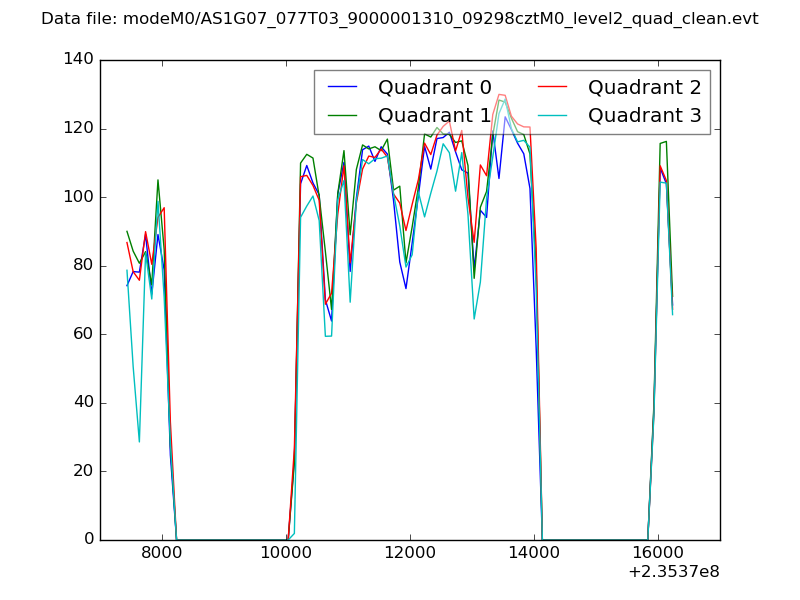 |
|
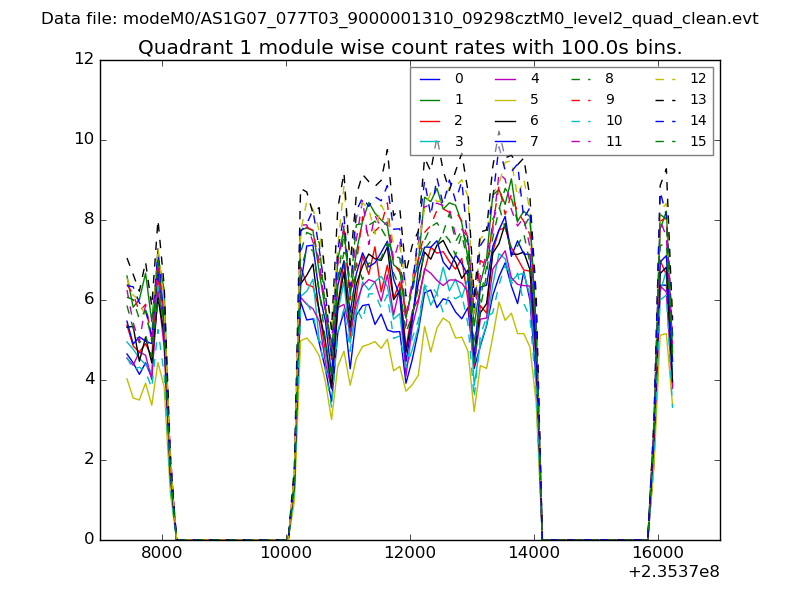
| Module-wise count rates for Quadrant A Data is divided into 100 sec bins |
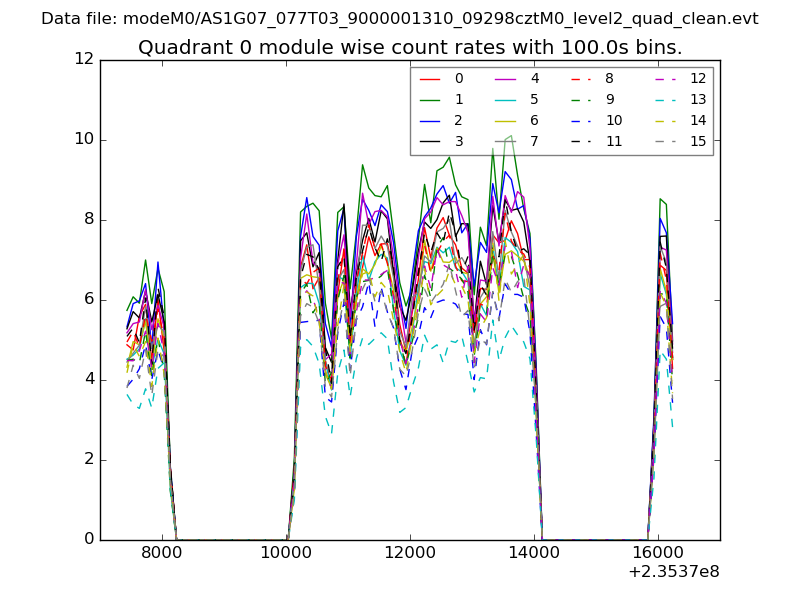 |
 |
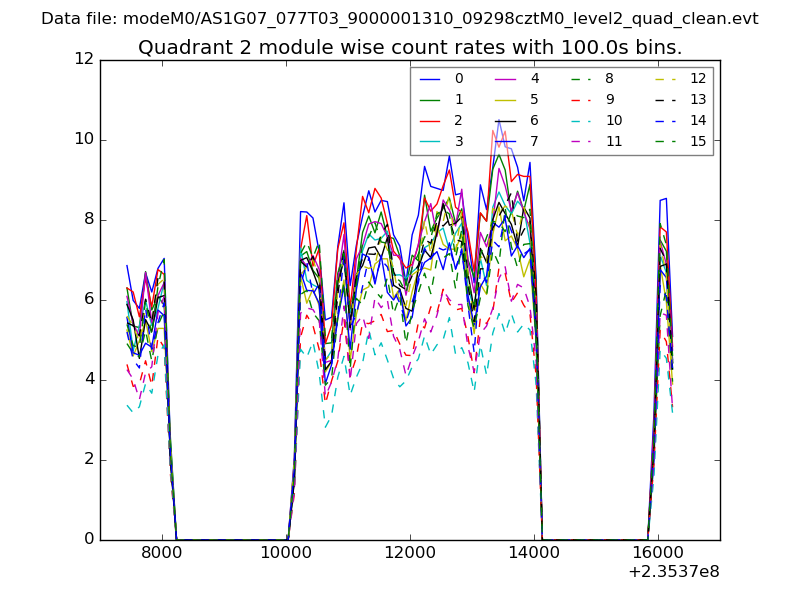
| Module-wise count rates for Quadrant B Data is divided into 100 sec bins |
 |
 |
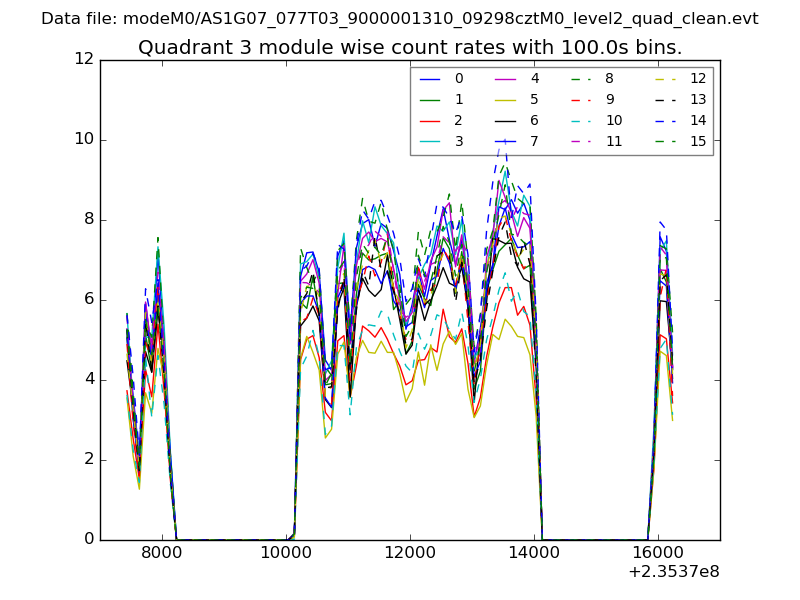
| Module-wise count rates for Quadrant C Data is divided into 100 sec bins |
 |
 |
| Module-wise count rates for Quadrant D Data is divided into 100 sec bins |
 |
 |
| Parameter | Plot |
|---|---|
| CZT HV Monitor | 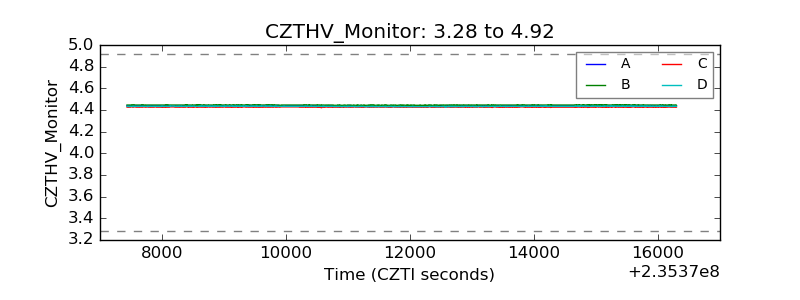 |
| D_VDD |  |
| Temperature 1 | 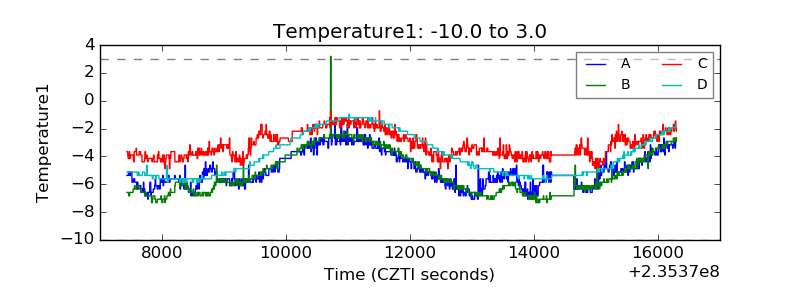 |
| Veto HV Monitor | 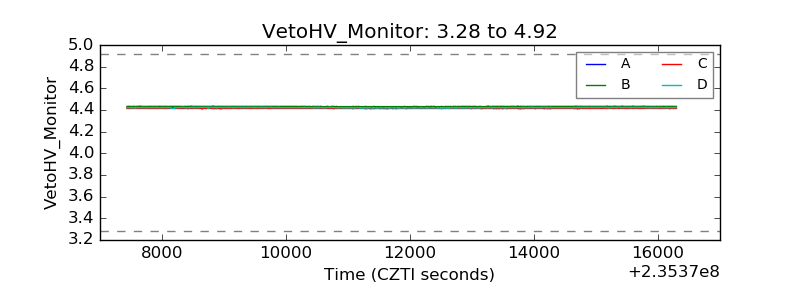 |
| Veto LLD | 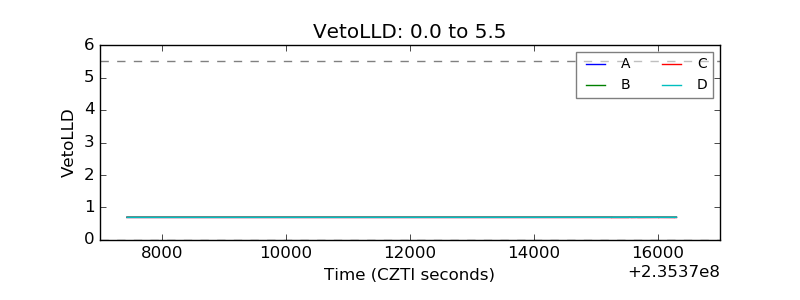 |
| Alpha Counter | 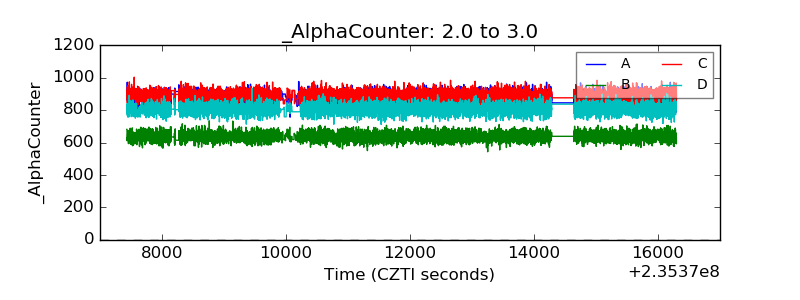 |
| _CPM_Rate | 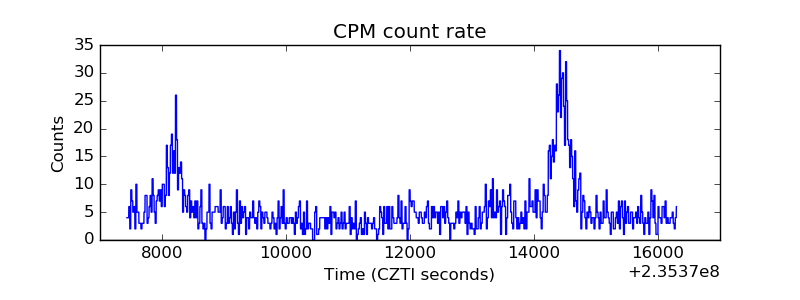 |
| CZT Counter |  |
| +2.5 Volts monitor |  |
| +5 Volts monitor |  |
| _ROLL_ROT | 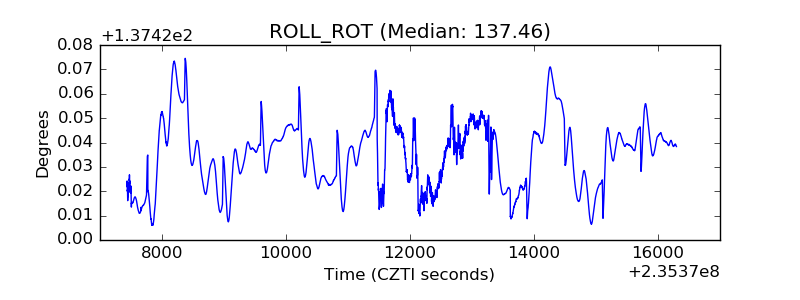 |
| _Roll_DEC | 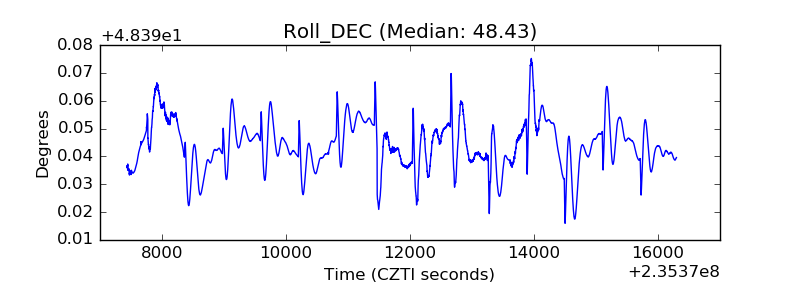 |
| _Roll_RA | 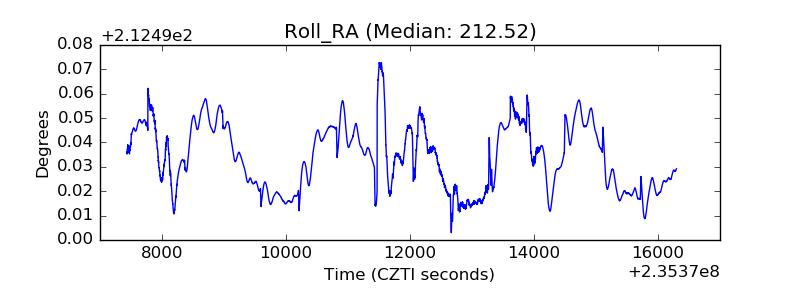 |
| Veto Counter | 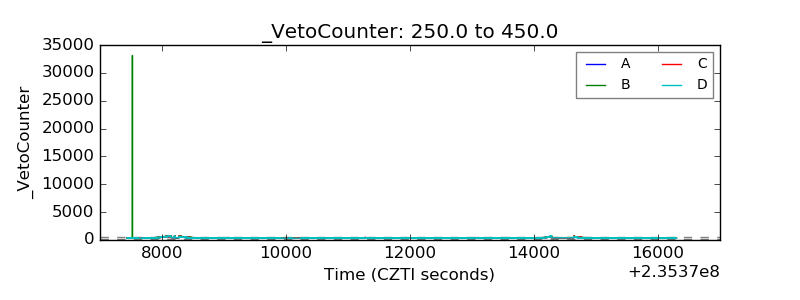 |