| Param | Original file | Final file |
|---|---|---|
| Filename | modeM0/AS1G07_077T03_9000001310_09300cztM0_level2.evt | modeM0/AS1G07_077T03_9000001310_09300cztM0_level2_quad_clean.evt |
| Size (bytes) | 386,242,560 | 60,678,720 |
| Size | 368.3 MB | 57.9 MB |
| Events in quadrant A | 4,014,710 | 355,169 |
| Events in quadrant B | 2,257,132 | 389,417 |
| Events in quadrant C | 2,173,854 | 383,521 |
| Events in quadrant D | 2,919,765 | 366,776 |
| Mode M9 | |||
|---|---|---|---|
| Quadrant | BADHDUFLAG | Total packets | Discarded packets |
| A | 0 | 4 | 0 |
| B | 0 | 4 | 0 |
| C | 0 | 4 | 0 |
| D | 0 | 4 | 0 |
| Mode M0 | |||
|---|---|---|---|
| Quadrant | BADHDUFLAG | Total packets | Discarded packets |
| A | 0 | 15313 | 7 |
| B | 0 | 10091 | 1 |
| C | 0 | 9971 | 3 |
| D | 0 | 12132 | 10 |
| Mode SS | |||
|---|---|---|---|
| Quadrant | BADHDUFLAG | Total packets | Discarded packets |
| A | 0 | 98 | 0 |
| B | 0 | 98 | 0 |
| C | 0 | 98 | 0 |
| D | 0 | 98 | 0 |
| Quadrant | Total seconds | Saturated seconds | Saturation percentage |
|---|---|---|---|
| A | 4881 | 438 | 8.973571% |
| B | 4883 | 131 | 2.682777% |
| C | 4882 | 89 | 1.823023% |
| D | 4880 | 315 | 6.454918% |
Noise dominated data is calculated using 1-second bins in cleaned event files. If a bin has >2000 counts, and if more than 50% of those come from <1% of pixels, then it is considered to be noise-dominated and hence unusable.
| Quadrant | # 1 sec bins | Bins with >0 counts | Bins with >2000 counts | High rate bins dominated by noise | Noise dominated (total time) | Noise dominated (detector-on time) | Marked lightcurve |
|---|---|---|---|---|---|---|---|
| A | 5238 | 4884 | 196 | 196 | 3.74% | 4.01% | 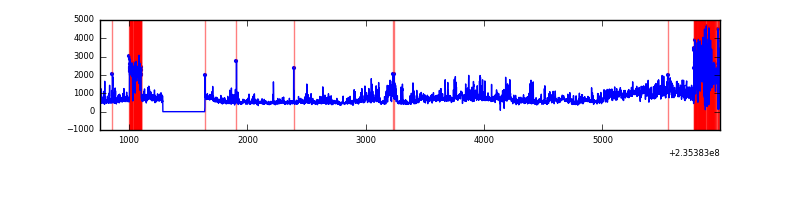 |
| B | 5238 | 4884 | 0 | 0 | 0.00% | 0.00% | 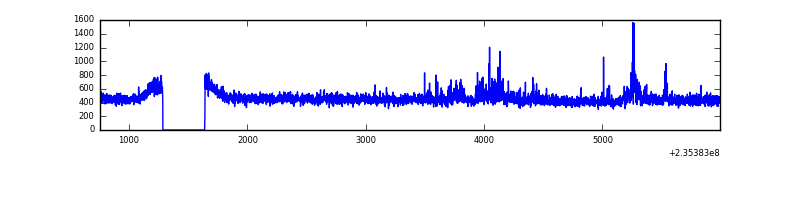 |
| C | 5238 | 4884 | 0 | 0 | 0.00% | 0.00% | 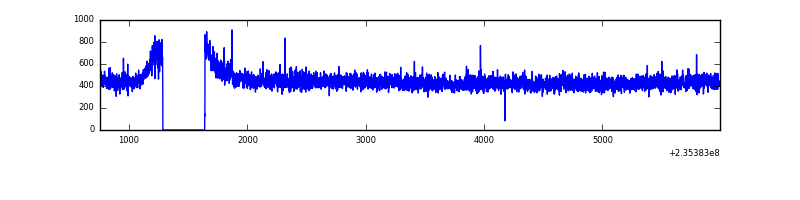 |
| D | 5238 | 4883 | 216 | 216 | 4.12% | 4.42% | 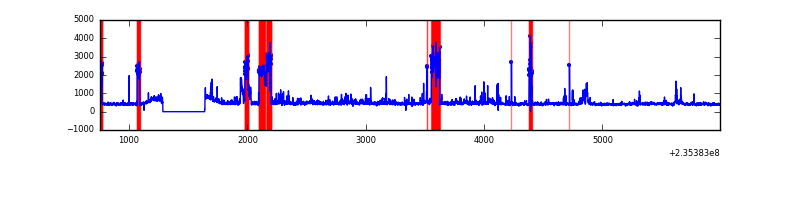 |
Top three noisy pixels from each quadrant. If the there are fewer than three noisy pixels in the level2.evt file, extra rows are filled as -1
| Pixel properties | Quadrant properties | ||||||
|---|---|---|---|---|---|---|---|
| Quadrant | DetID | PixID | Counts | Sigma | Mean | Median | Sigma |
| A | 8 | 5 | 1358012 | 12289.1 | 533 | 520 | 110.5 |
| A | 15 | 223 | 365130 | 3300.74 | 533 | 520 | 110.5 |
| A | 15 | 239 | 110373 | 994.48 | 533 | 520 | 110.5 |
| B | 0 | 214 | 47464 | 430.99 | 556 | 541 | 108.9 |
| B | 0 | 213 | 22510 | 201.79 | 556 | 541 | 108.9 |
| B | 4 | 80 | 16846 | 149.76 | 556 | 541 | 108.9 |
| C | 14 | 67 | 35217 | 274.77 | 542 | 544 | 126.2 |
| C | 8 | 128 | 10940 | 82.38 | 542 | 544 | 126.2 |
| C | 8 | 112 | 5225 | 37.1 | 542 | 544 | 126.2 |
| D | 12 | 227 | 604695 | 4632.35 | 526 | 511 | 130.4 |
| D | 1 | 52 | 115221 | 879.49 | 526 | 511 | 130.4 |
| D | 7 | 71 | 105966 | 808.54 | 526 | 511 | 130.4 |
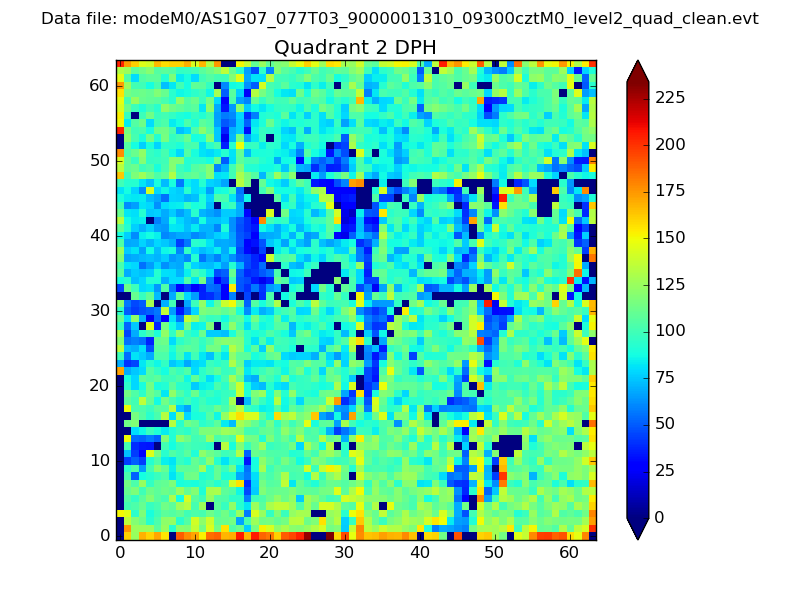
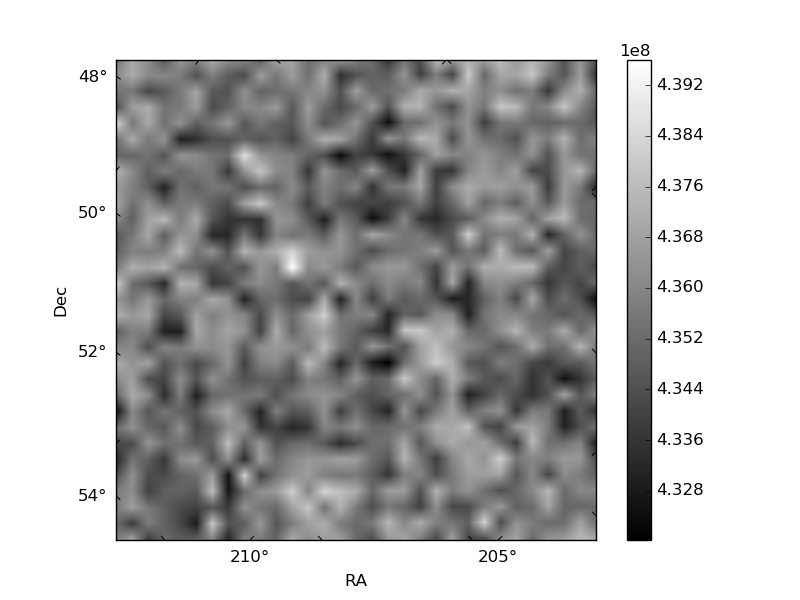
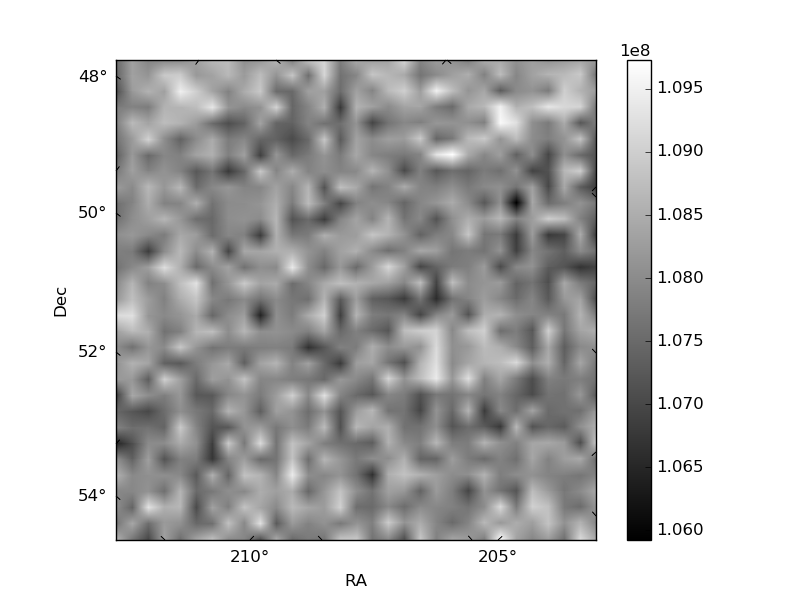
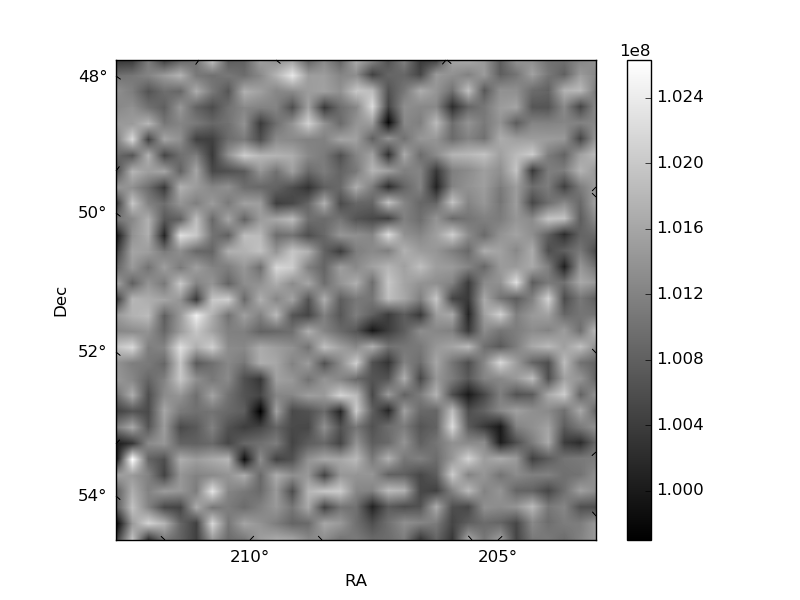
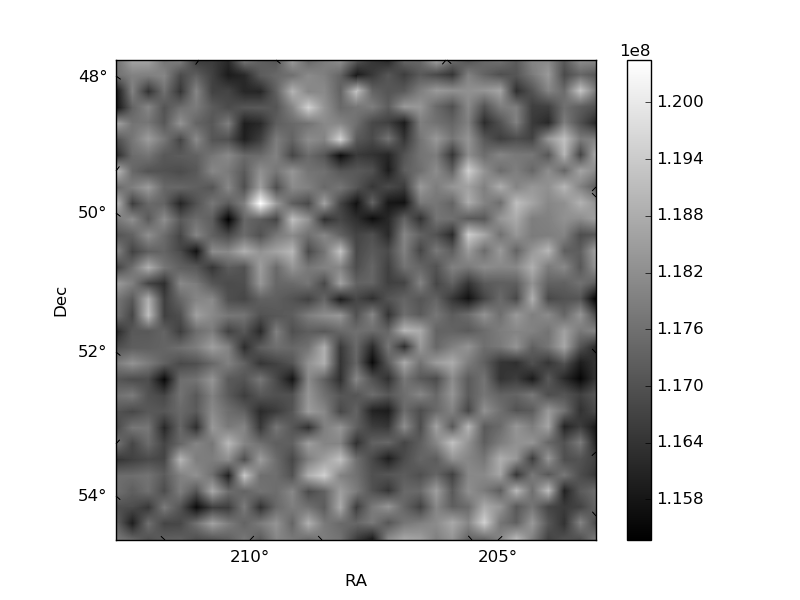
Histogram calculated using DETX and DETY for each event in the final _common_clean file
| Quadrant A | 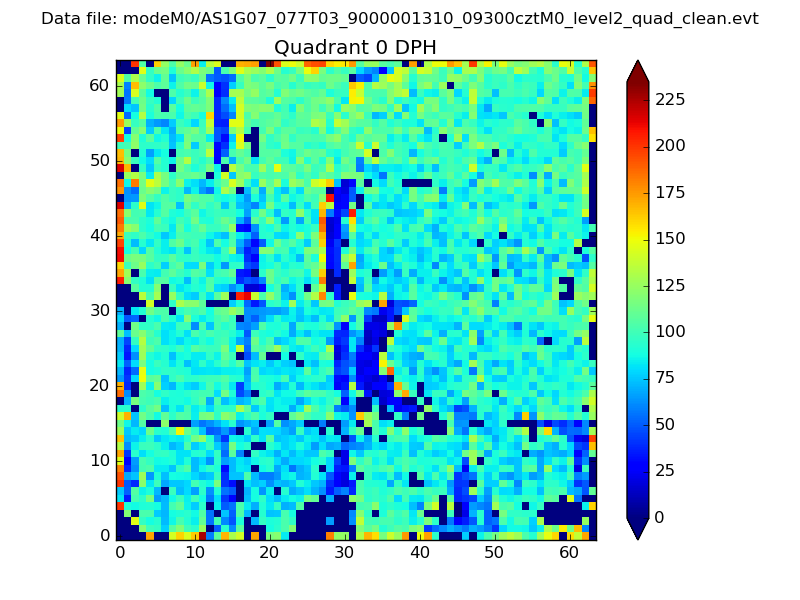 |
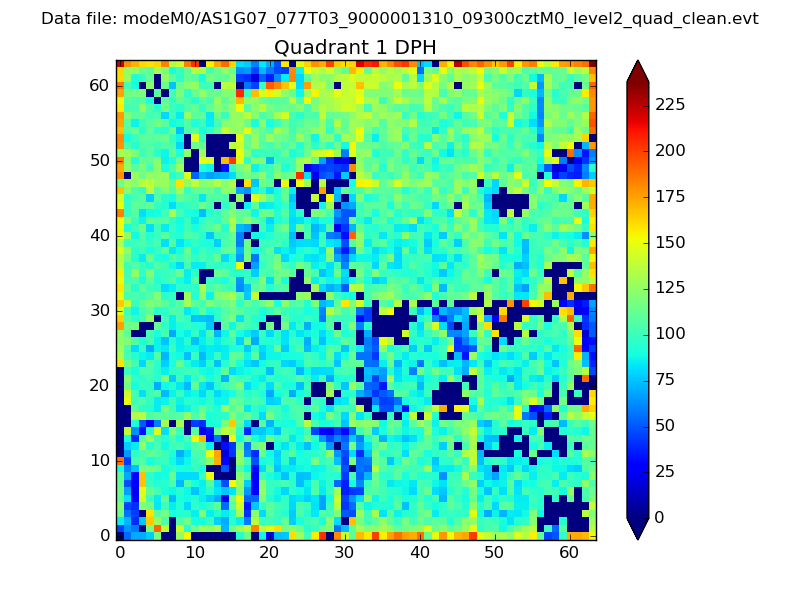 |
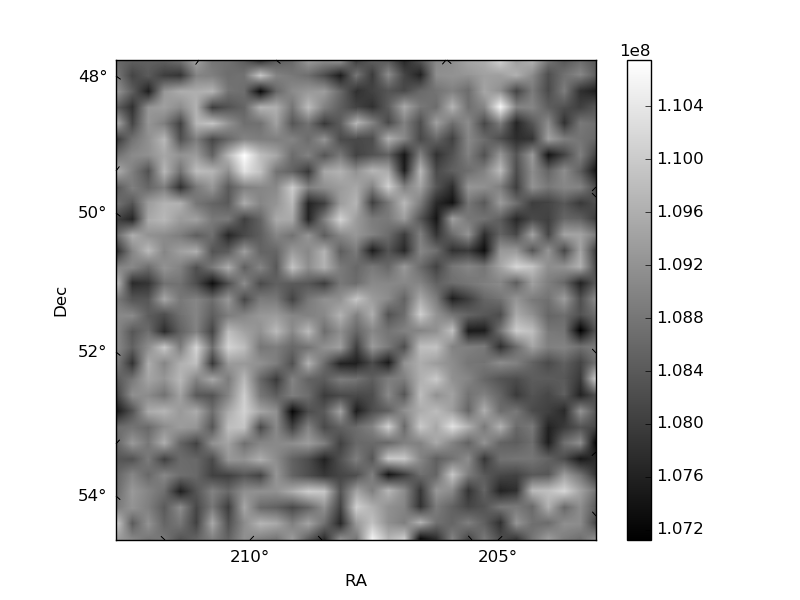
Quadrant B |
|---|---|---|---|
| Quadrant D | 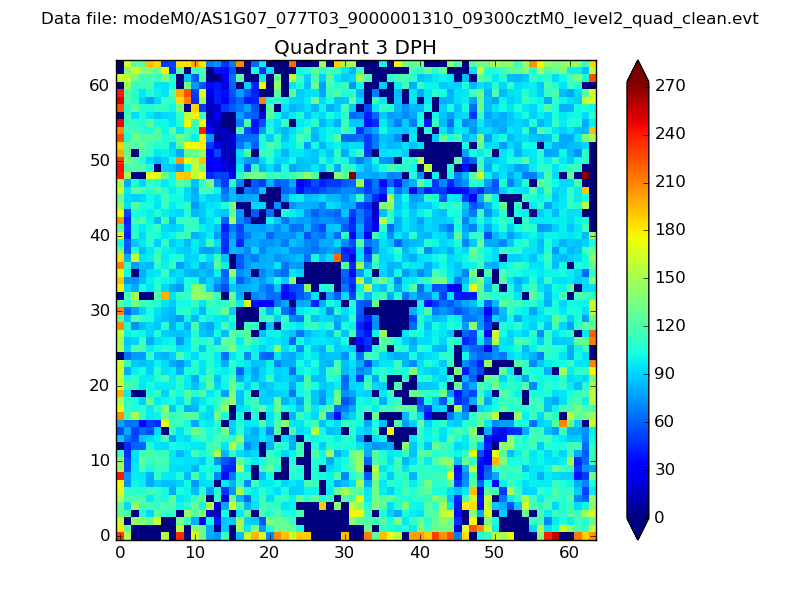 |
 |
Quadrant C |
| Plot type | Count rate plots | Images |
|---|---|---|
| Comparison with Poisson distribution Blue bars denote a histogram of data divided into 1 sec bins. Red curve is a Poisson curve with rate = median count rate of data. |
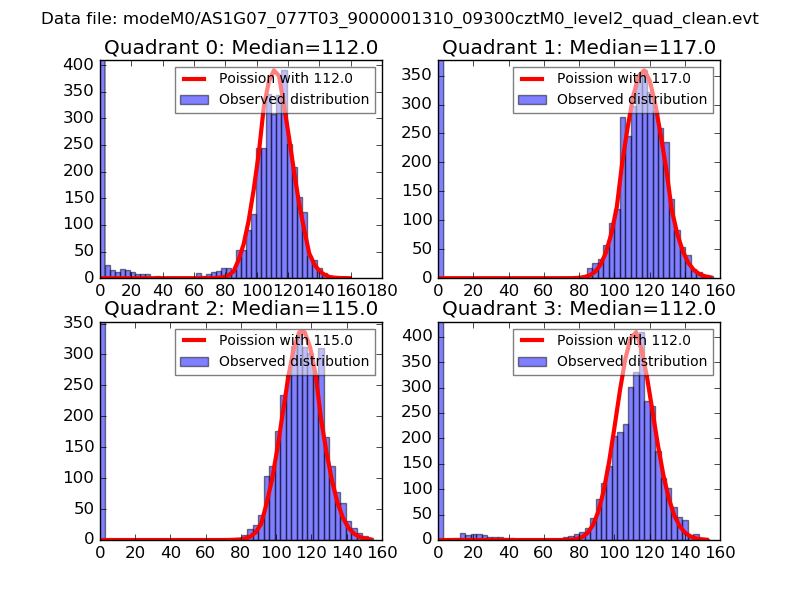 |
 |
| Quadrant-wise count rates Data is divided into 100 sec bins |
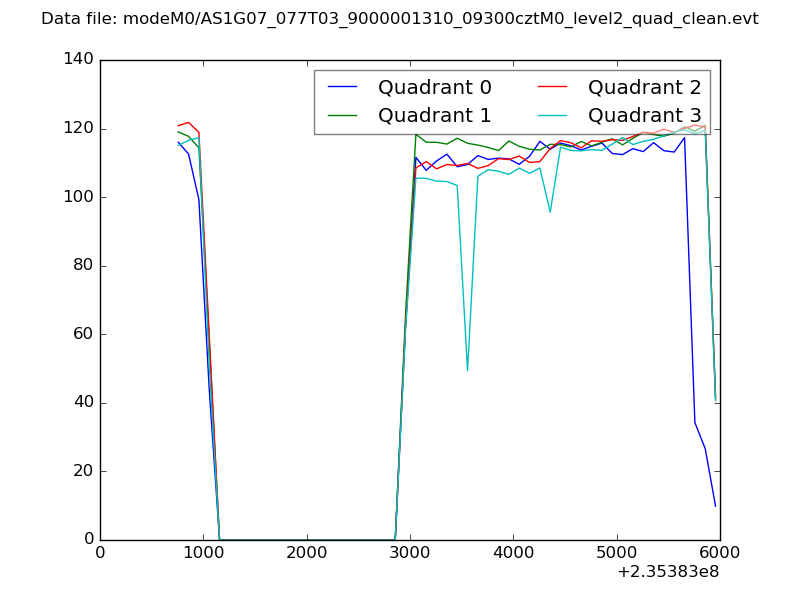 |
|
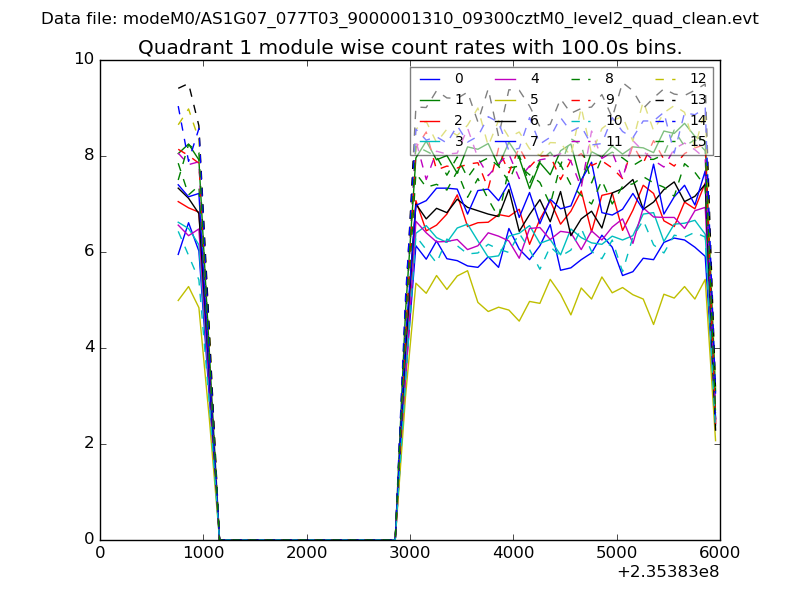
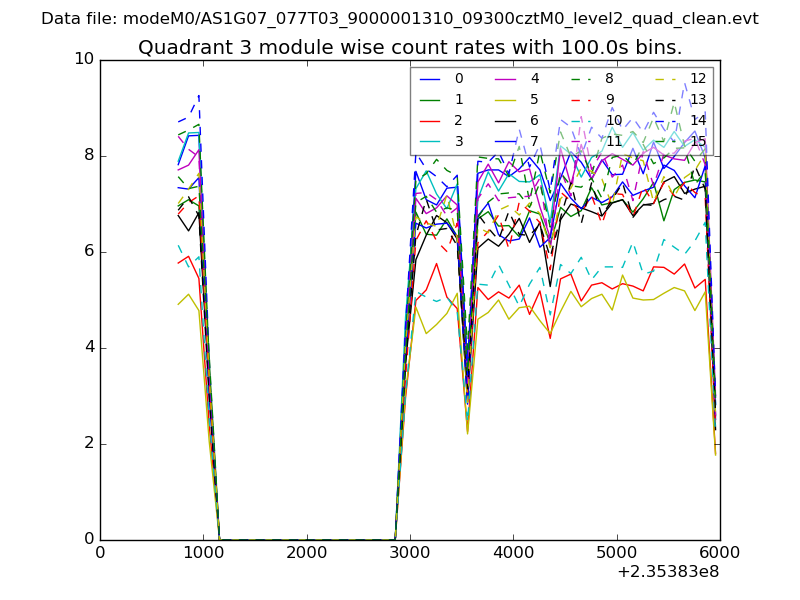
| Module-wise count rates for Quadrant A Data is divided into 100 sec bins |
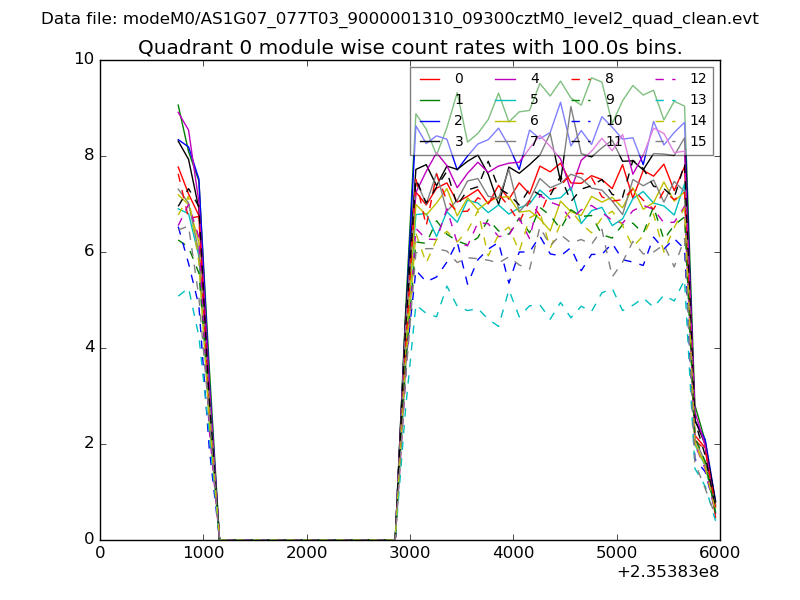 |
 |
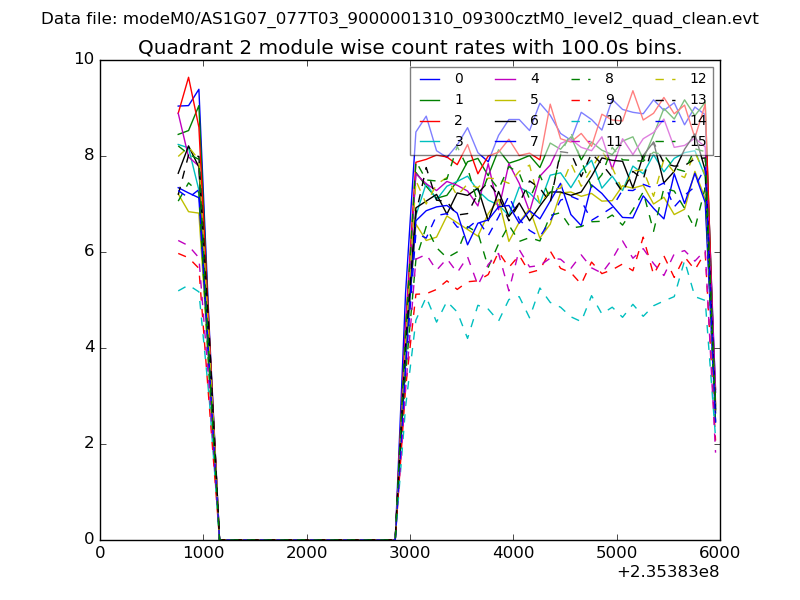
| Module-wise count rates for Quadrant B Data is divided into 100 sec bins |
 |
 |
| Module-wise count rates for Quadrant C Data is divided into 100 sec bins |
 |
 |
| Module-wise count rates for Quadrant D Data is divided into 100 sec bins |
 |
 |
| Parameter | Plot |
|---|---|
| CZT HV Monitor | 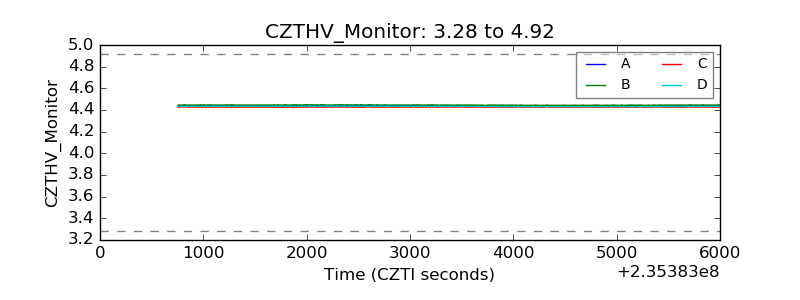 |
| D_VDD | 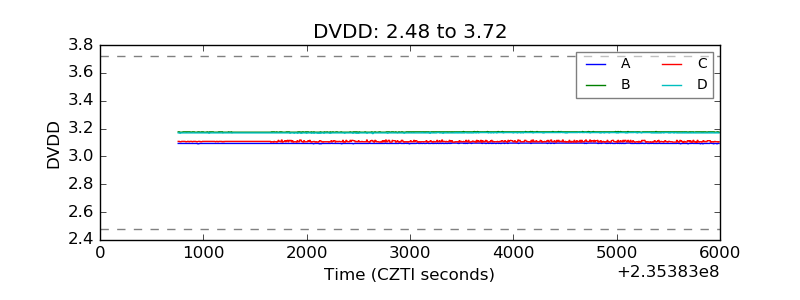 |
| Temperature 1 | 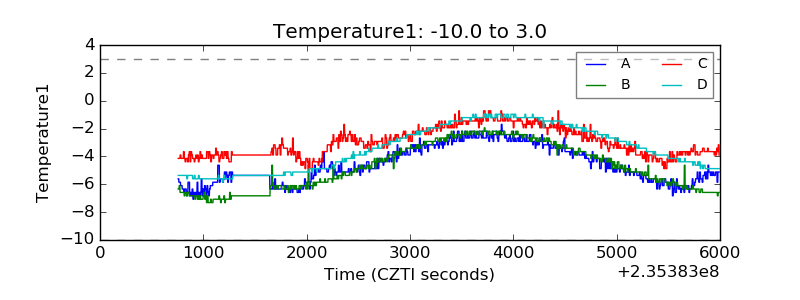 |
| Veto HV Monitor | 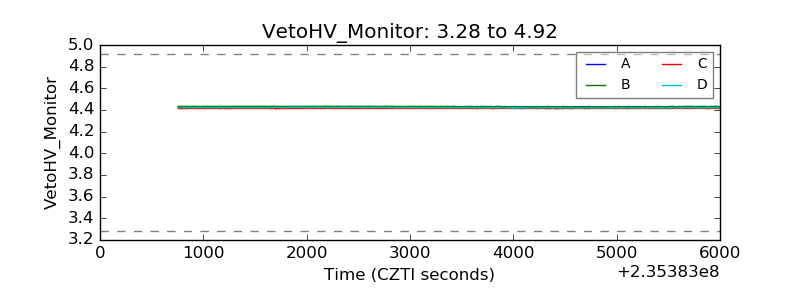 |
| Veto LLD | 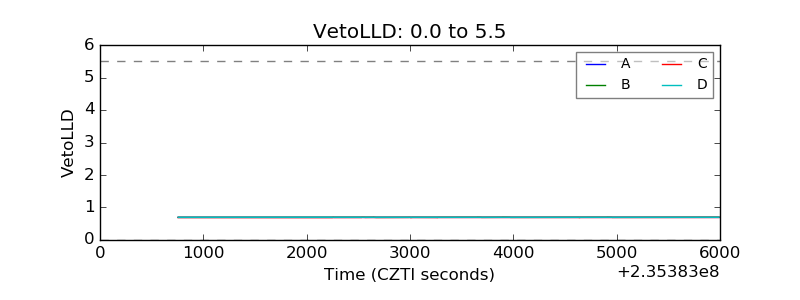 |
| Alpha Counter | 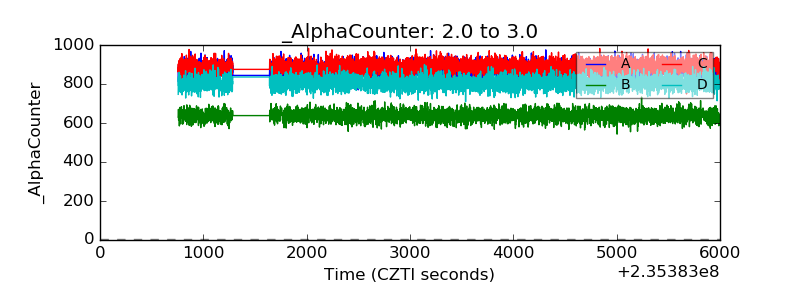 |
| _CPM_Rate | 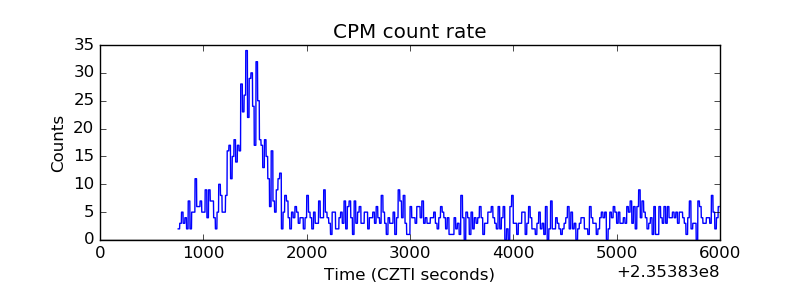 |
| CZT Counter | 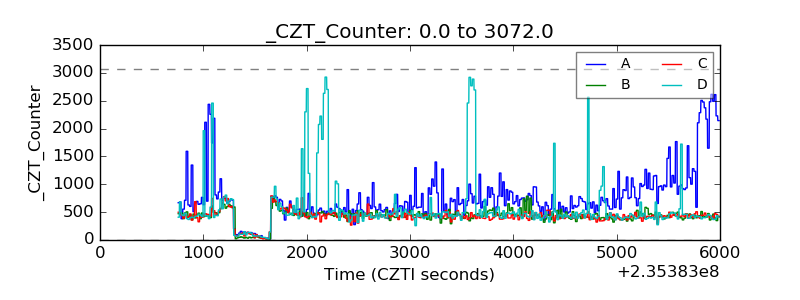 |
| +2.5 Volts monitor |  |
| +5 Volts monitor |  |
| _ROLL_ROT | 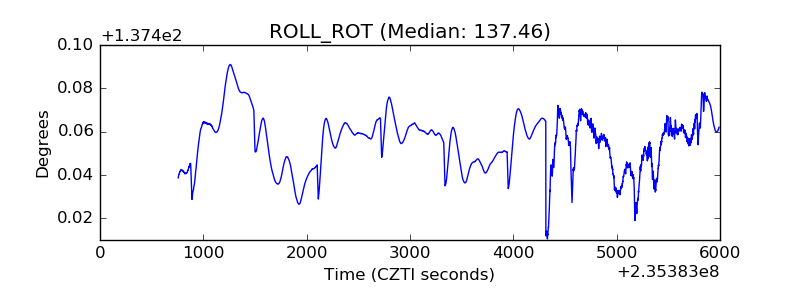 |
| _Roll_DEC | 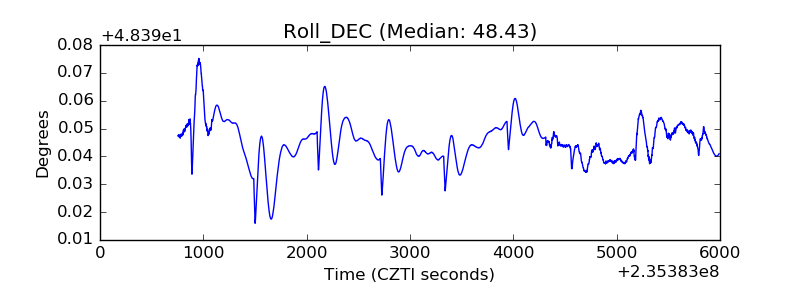 |
| _Roll_RA | 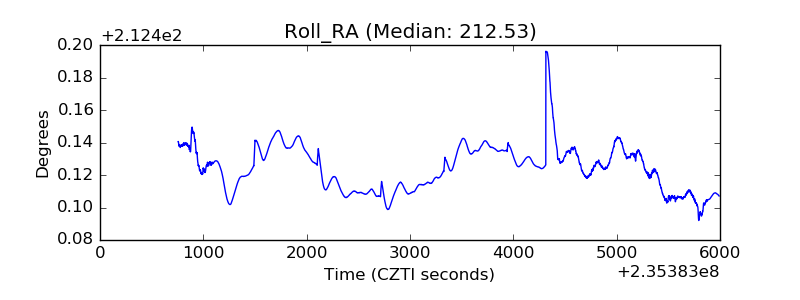 |
| Veto Counter | 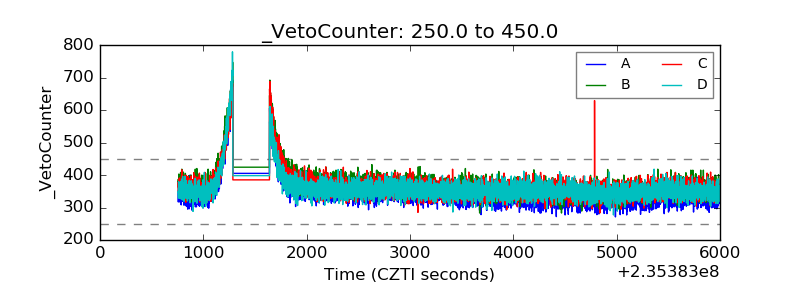 |