| Param | Original file | Final file |
|---|---|---|
| Filename | modeM0/AS1G07_076T03_9000001314cztM0_level2.fits | modeM0/AS1G07_076T03_9000001314cztM0_level2_quad_clean.evt |
| Size (bytes) | 269,205,120 | 204,595,200 |
| Size | 256.7 MB | 195.1 MB |
| Events in quadrant A | 1,604,664 | 1,090,203 |
| Events in quadrant B | 1,589,184 | 1,106,604 |
| Events in quadrant C | 1,608,870 | 1,062,822 |
| Events in quadrant D | 1,405,480 | 990,845 |
| Mode SS | |||
|---|---|---|---|
| Quadrant | BADHDUFLAG | Total packets | Discarded packets |
| A | 0 | 572 | 0 |
| B | 0 | 576 | 0 |
| C | 0 | 578 | 0 |
| D | 0 | 578 | 0 |
| Mode M9 | |||
|---|---|---|---|
| Quadrant | BADHDUFLAG | Total packets | Discarded packets |
| A | 0 | 51 | 0 |
| B | 0 | 51 | 0 |
| C | 0 | 51 | 0 |
| D | 0 | 51 | 0 |
| Mode M0 | |||
|---|---|---|---|
| Quadrant | BADHDUFLAG | Total packets | Discarded packets |
| A | 0 | 67476 | 0 |
| B | 0 | 58564 | 0 |
| C | 0 | 59007 | 0 |
| D | 0 | 59485 | 0 |
| Quadrant | Total seconds | Saturated seconds | Saturation percentage |
|---|---|---|---|
| A | 28253 | 668 | 2.364351% |
| B | 28299 | 340 | 1.201456% |
| C | 28271 | 179 | 0.633158% |
| D | 28294 | 210 | 0.742207% |
Noise dominated data is calculated using 1-second bins in cleaned event files. If a bin has >2000 counts, and if more than 50% of those come from <1% of pixels, then it is considered to be noise-dominated and hence unusable.
| Quadrant | # 1 sec bins | Bins with >0 counts | Bins with >2000 counts | High rate bins dominated by noise | Noise dominated (total time) | Noise dominated (detector-on time) | Marked lightcurve |
|---|---|---|---|---|---|---|---|
| A | 33720 | 28563 | 0 | 0 | 0.00% | 0.00% | 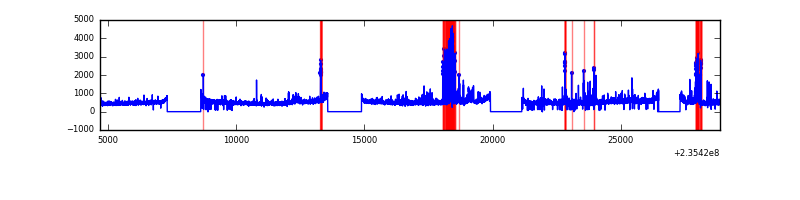 |
| B | 33720 | 28578 | 0 | 0 | 0.00% | 0.00% |  |
| C | 33720 | 28573 | 0 | 0 | 0.00% | 0.00% | 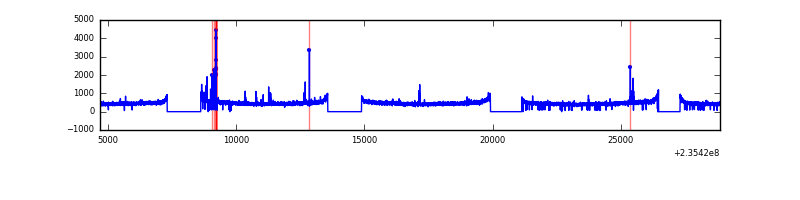 |
| D | 33720 | 28567 | 0 | 0 | 0.00% | 0.00% |  |
Top three noisy pixels from each quadrant. If the there are fewer than three noisy pixels in the level2.evt file, extra rows are filled as -1
| Pixel properties | Quadrant properties | ||||||
|---|---|---|---|---|---|---|---|
| Quadrant | DetID | PixID | Counts | Sigma | Mean | Median | Sigma |
| A | 0 | 29 | 1531 | 10.67 | 417 | 389 | 107.0 |
| A | 7 | 110 | 1384 | 9.3 | 417 | 389 | 107.0 |
| A | 9 | 19 | 1218 | 7.75 | 417 | 389 | 107.0 |
| B | 2 | 9 | 1368 | 11.32 | 418 | 397 | 85.8 |
| B | 12 | 226 | 1115 | 8.37 | 418 | 397 | 85.8 |
| B | 5 | 225 | 1050 | 7.61 | 418 | 397 | 85.8 |
| C | 1 | 80 | 1165 | 6.81 | 425 | 395 | 113.1 |
| C | 1 | 81 | 1119 | 6.4 | 425 | 395 | 113.1 |
| C | 2 | 191 | 1106 | 6.28 | 425 | 395 | 113.1 |
| D | 3 | 14 | 1051 | 6.32 | 399 | 361 | 109.2 |
| D | 7 | 5 | 1016 | 6.0 | 399 | 361 | 109.2 |
| D | 6 | 231 | 994 | 5.8 | 399 | 361 | 109.2 |
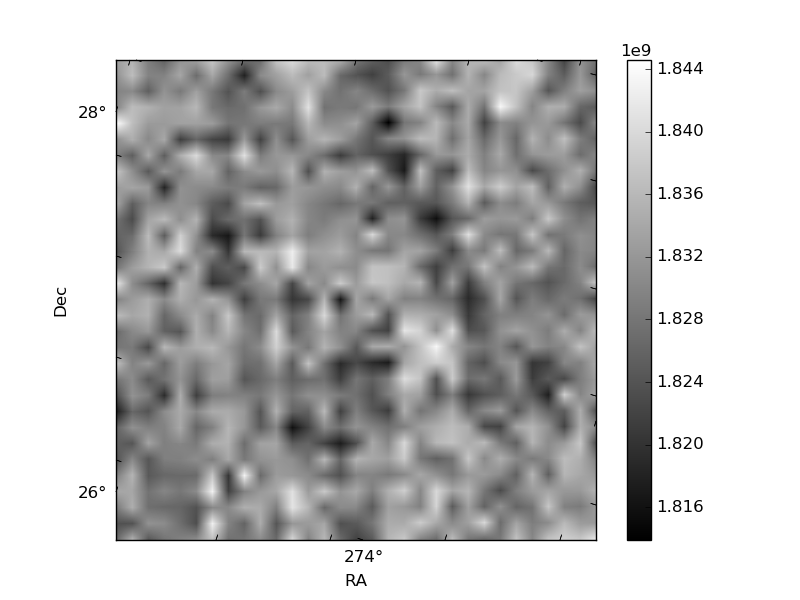
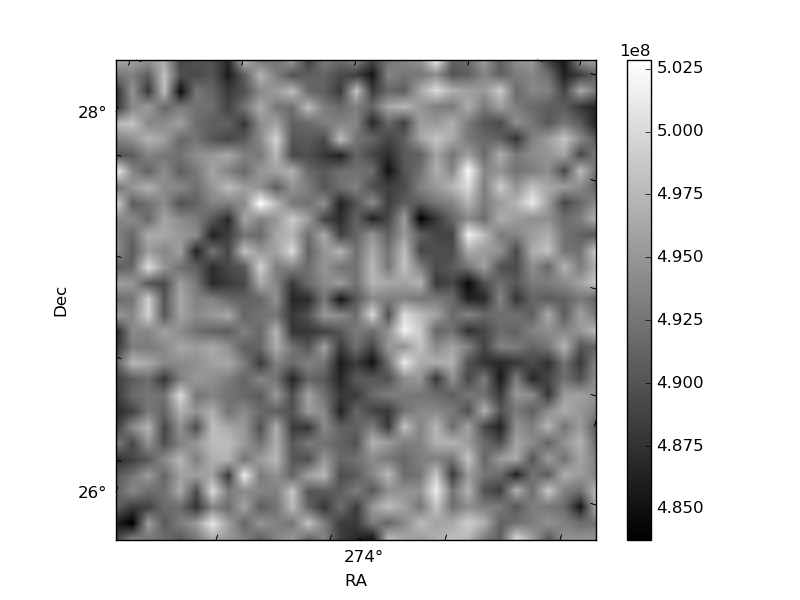
Histogram calculated using DETX and DETY for each event in the final _common_clean file
| Quadrant A | 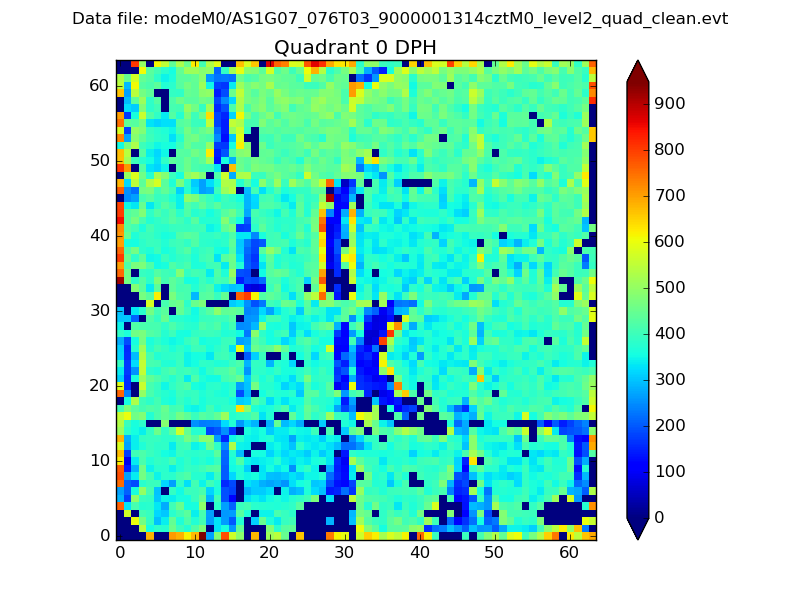 |
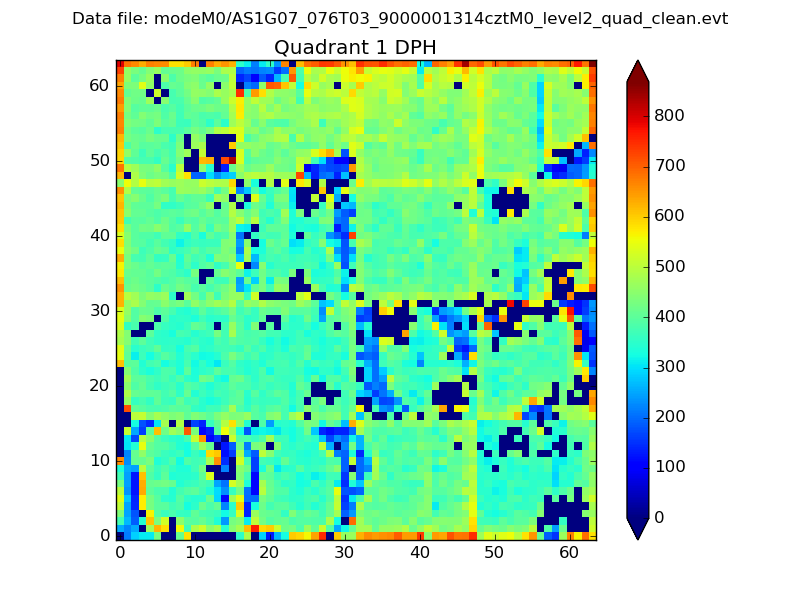 |
Quadrant B |
|---|---|---|---|
| Quadrant D |  |
 |
Quadrant C |
| Plot type | Count rate plots | Images |
|---|---|---|
| Comparison with Poisson distribution Blue bars denote a histogram of data divided into 1 sec bins. Red curve is a Poisson curve with rate = median count rate of data. |
 |
 |
| Quadrant-wise count rates Data is divided into 100 sec bins |
 |
|
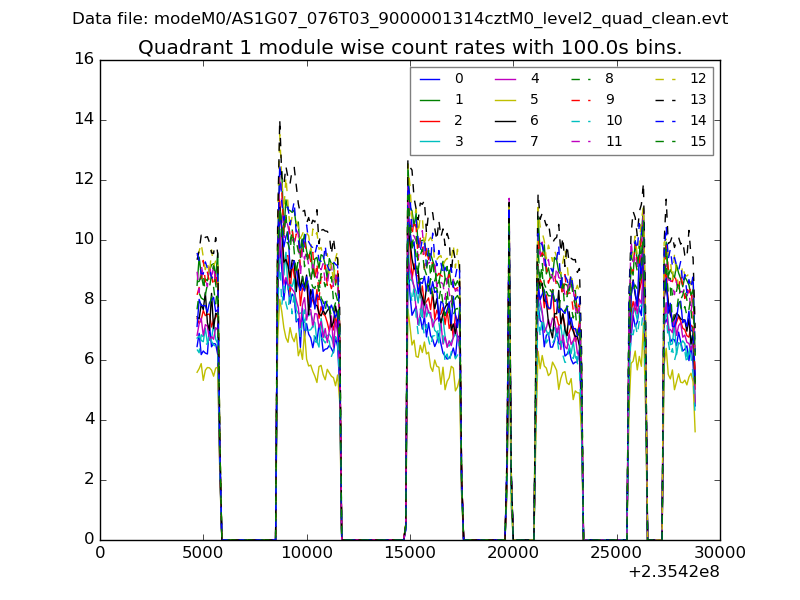
| Module-wise count rates for Quadrant A Data is divided into 100 sec bins |
 |
 |
| Module-wise count rates for Quadrant B Data is divided into 100 sec bins |
 |
 |
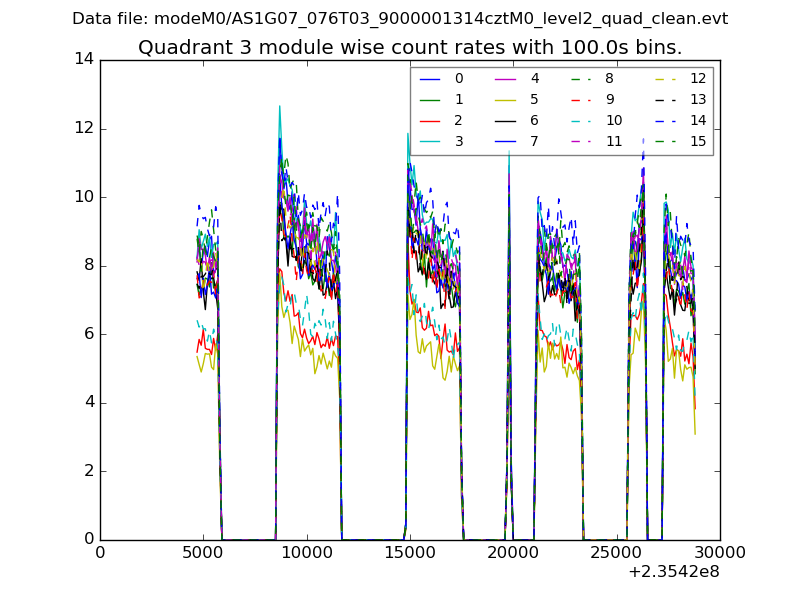
| Module-wise count rates for Quadrant C Data is divided into 100 sec bins |
 |
 |
| Module-wise count rates for Quadrant D Data is divided into 100 sec bins |
 |
 |
| Parameter | Plot |
|---|---|
| CZT HV Monitor |  |
| D_VDD | 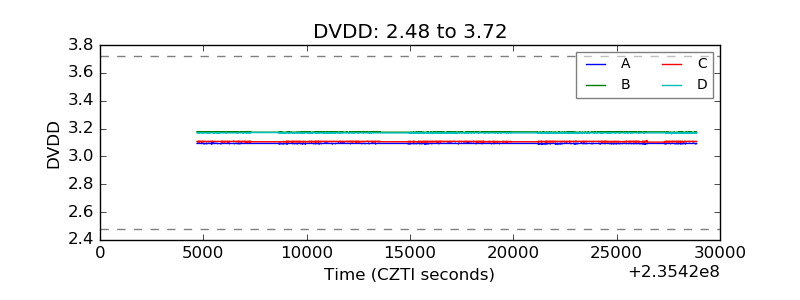 |
| Temperature 1 |  |
| Veto HV Monitor | 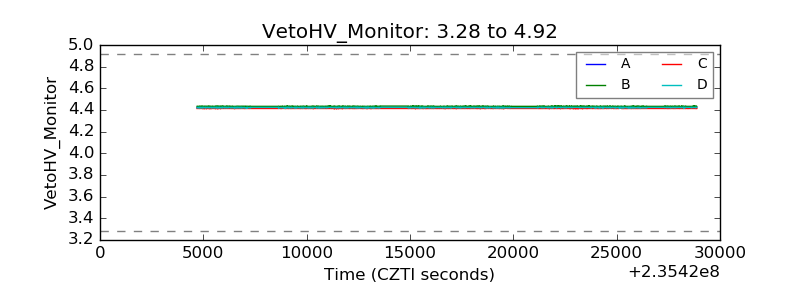 |
| Veto LLD |  |
| Alpha Counter |  |
| _CPM_Rate | 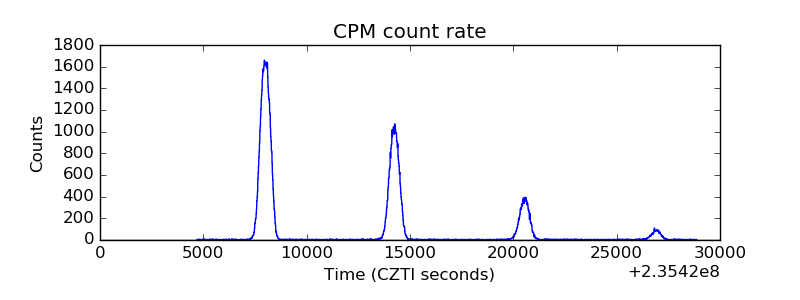 |
| CZT Counter |  |
| +2.5 Volts monitor |  |
| +5 Volts monitor | 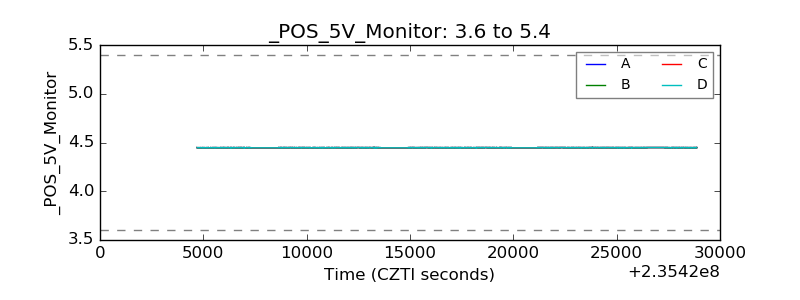 |
| _ROLL_ROT |  |
| _Roll_DEC |  |
| _Roll_RA |  |
| Veto Counter |  |