| Param | Original file | Final file |
|---|---|---|
| Filename | modeM0/AS1G07_076T03_9000001314_09309cztM0_level2.evt | modeM0/AS1G07_076T03_9000001314_09309cztM0_level2_quad_clean.evt |
| Size (bytes) | 1,307,586,240 | 244,753,920 |
| Size | 1.2 GB | 233.4 MB |
| Events in quadrant A | 10,884,875 | 1,509,484 |
| Events in quadrant B | 9,233,167 | 1,550,135 |
| Events in quadrant C | 9,128,682 | 1,531,984 |
| Events in quadrant D | 9,041,766 | 1,485,356 |
| Mode SS | |||
|---|---|---|---|
| Quadrant | BADHDUFLAG | Total packets | Discarded packets |
| A | 0 | 396 | 2 |
| B | 0 | 396 | 2 |
| C | 0 | 396 | 4 |
| D | 0 | 396 | 0 |
| Mode M9 | |||
|---|---|---|---|
| Quadrant | BADHDUFLAG | Total packets | Discarded packets |
| A | 0 | 47 | 0 |
| B | 0 | 47 | 0 |
| C | 0 | 47 | 0 |
| D | 0 | 47 | 0 |
| Mode M0 | |||
|---|---|---|---|
| Quadrant | BADHDUFLAG | Total packets | Discarded packets |
| A | 0 | 44931 | 166 |
| B | 0 | 40522 | 130 |
| C | 0 | 40666 | 141 |
| D | 0 | 41043 | 131 |
| Quadrant | Total seconds | Saturated seconds | Saturation percentage |
|---|---|---|---|
| A | 19399 | 388 | 2.000103% |
| B | 19405 | 187 | 0.963669% |
| C | 19400 | 120 | 0.618557% |
| D | 19405 | 122 | 0.628704% |
Noise dominated data is calculated using 1-second bins in cleaned event files. If a bin has >2000 counts, and if more than 50% of those come from <1% of pixels, then it is considered to be noise-dominated and hence unusable.
| Quadrant | # 1 sec bins | Bins with >0 counts | Bins with >2000 counts | High rate bins dominated by noise | Noise dominated (total time) | Noise dominated (detector-on time) | Marked lightcurve |
|---|---|---|---|---|---|---|---|
| A | 24177 | 19468 | 164 | 164 | 0.68% | 0.84% | 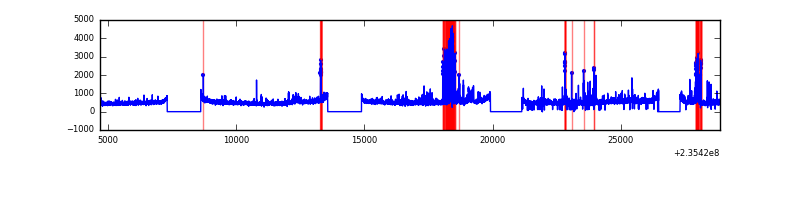 |
| B | 24177 | 19470 | 5 | 5 | 0.02% | 0.03% | 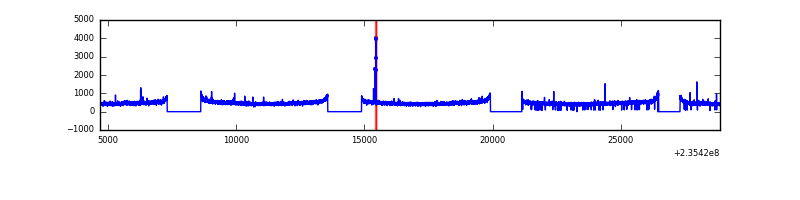 |
| C | 24177 | 19469 | 13 | 13 | 0.05% | 0.07% | 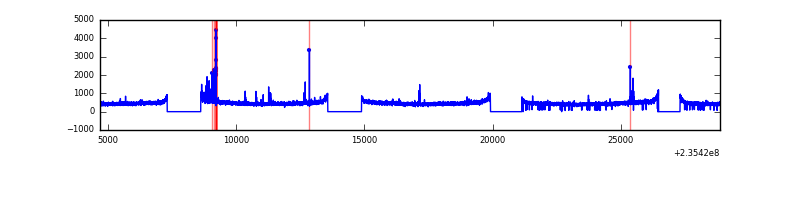 |
| D | 24177 | 19470 | 38 | 38 | 0.16% | 0.20% | 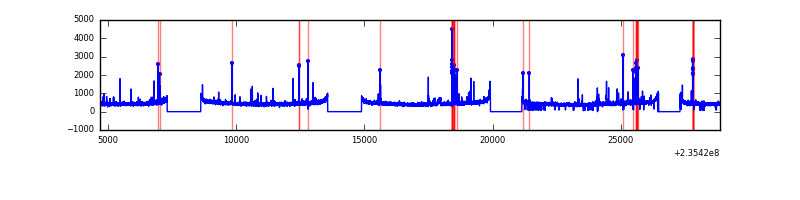 |
Top three noisy pixels from each quadrant. If the there are fewer than three noisy pixels in the level2.evt file, extra rows are filled as -1
| Pixel properties | Quadrant properties | ||||||
|---|---|---|---|---|---|---|---|
| Quadrant | DetID | PixID | Counts | Sigma | Mean | Median | Sigma |
| A | 8 | 5 | 886198 | 1899.62 | 2333 | 2289 | 465.3 |
| A | 5 | 16 | 745956 | 1598.22 | 2333 | 2289 | 465.3 |
| A | 1 | 162 | 163093 | 345.59 | 2333 | 2289 | 465.3 |
| B | 12 | 111 | 51893 | 111.45 | 2358 | 2303 | 444.9 |
| B | 11 | 111 | 41841 | 88.86 | 2358 | 2303 | 444.9 |
| B | 14 | 111 | 32988 | 68.96 | 2358 | 2303 | 444.9 |
| C | 14 | 234 | 105961 | 197.69 | 2286 | 2302 | 524.4 |
| C | 9 | 68 | 54798 | 100.11 | 2286 | 2302 | 524.4 |
| C | 14 | 67 | 18741 | 31.35 | 2286 | 2302 | 524.4 |
| D | 1 | 52 | 334208 | 581.7 | 2260 | 2207 | 570.7 |
| D | 2 | 14 | 74793 | 127.18 | 2260 | 2207 | 570.7 |
| D | 2 | 234 | 62580 | 105.78 | 2260 | 2207 | 570.7 |
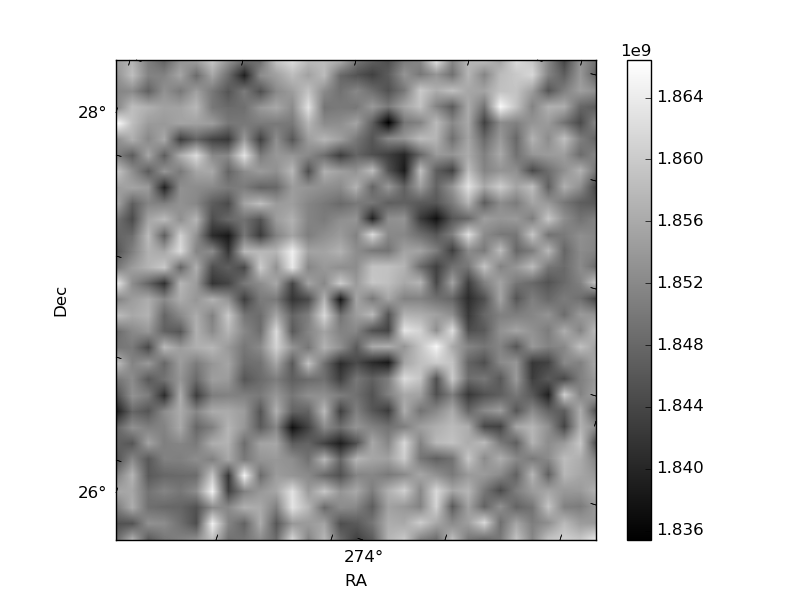
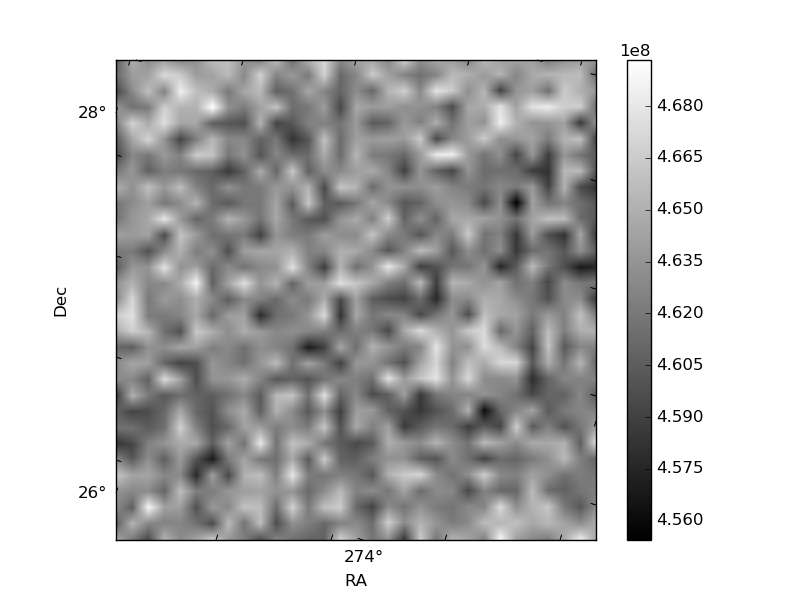
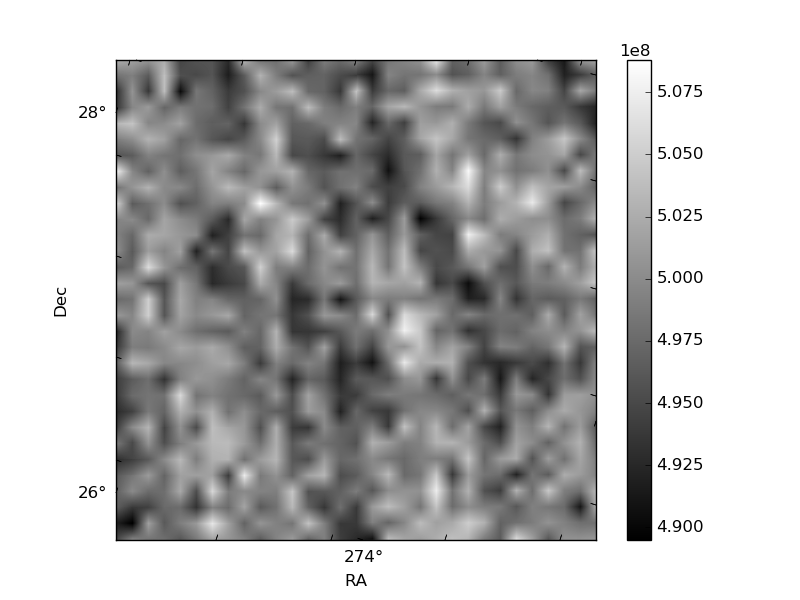
Histogram calculated using DETX and DETY for each event in the final _common_clean file
| Quadrant A | 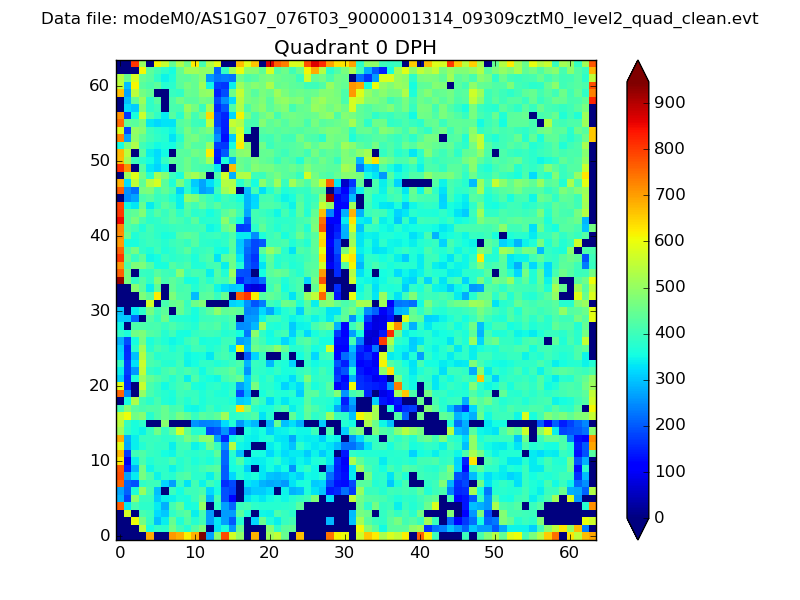 |
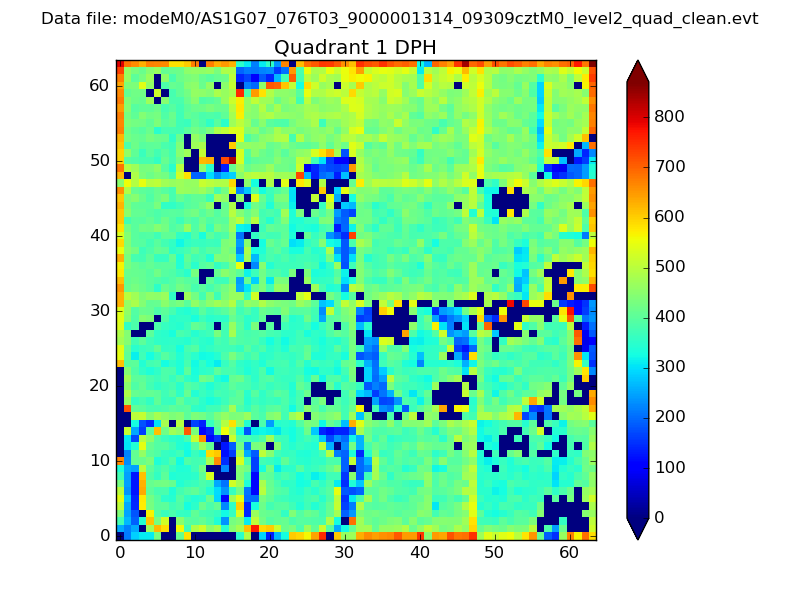 |
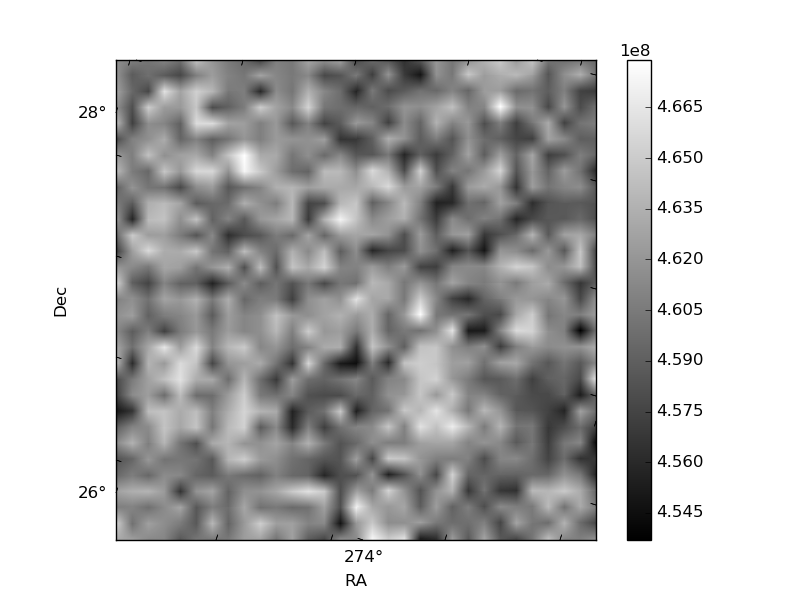
Quadrant B |
|---|---|---|---|
| Quadrant D | 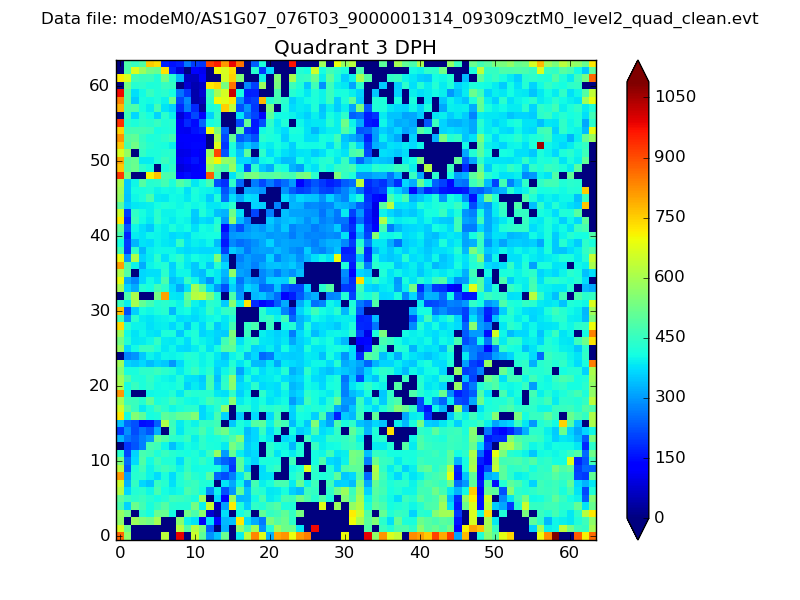 |
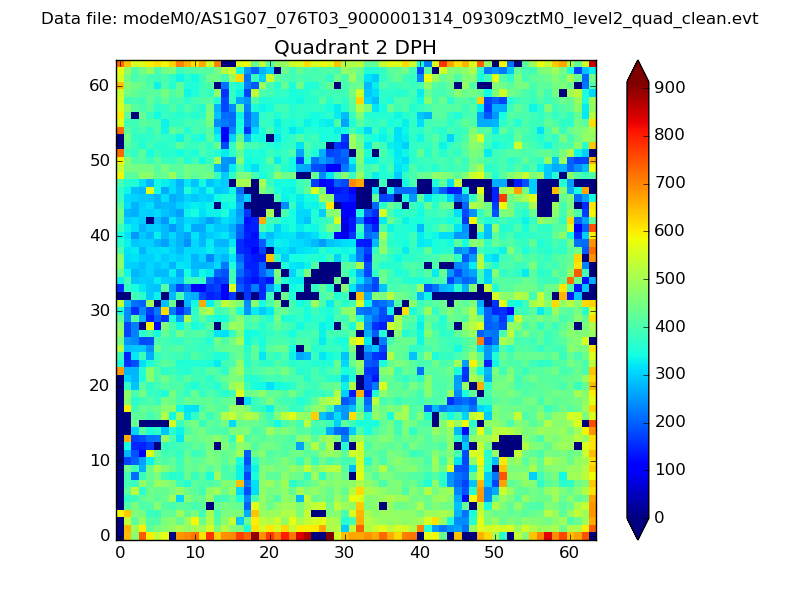 |
Quadrant C |
| Plot type | Count rate plots | Images |
|---|---|---|
| Comparison with Poisson distribution Blue bars denote a histogram of data divided into 1 sec bins. Red curve is a Poisson curve with rate = median count rate of data. |
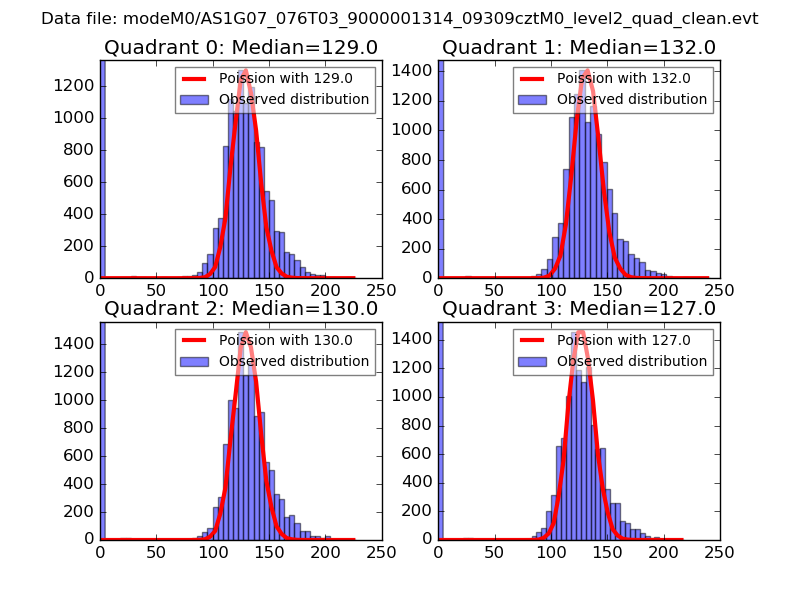 |
 |
| Quadrant-wise count rates Data is divided into 100 sec bins |
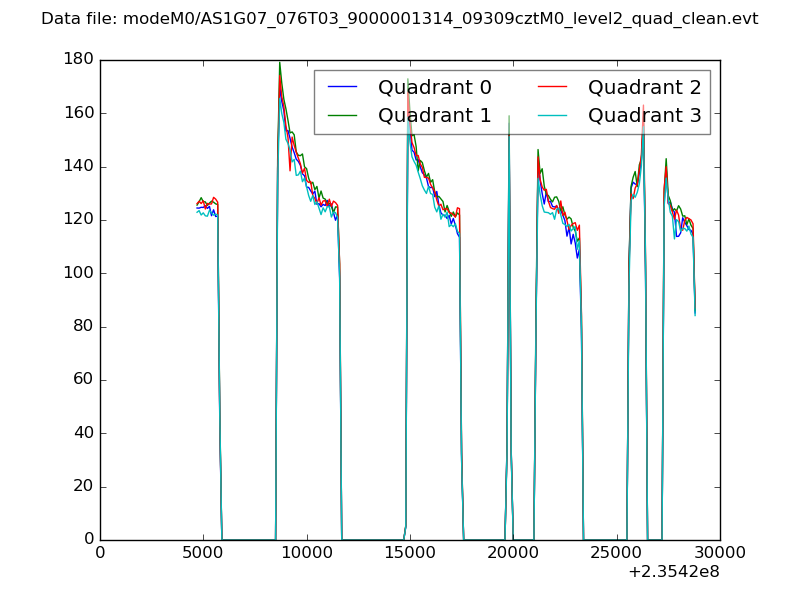 |
|
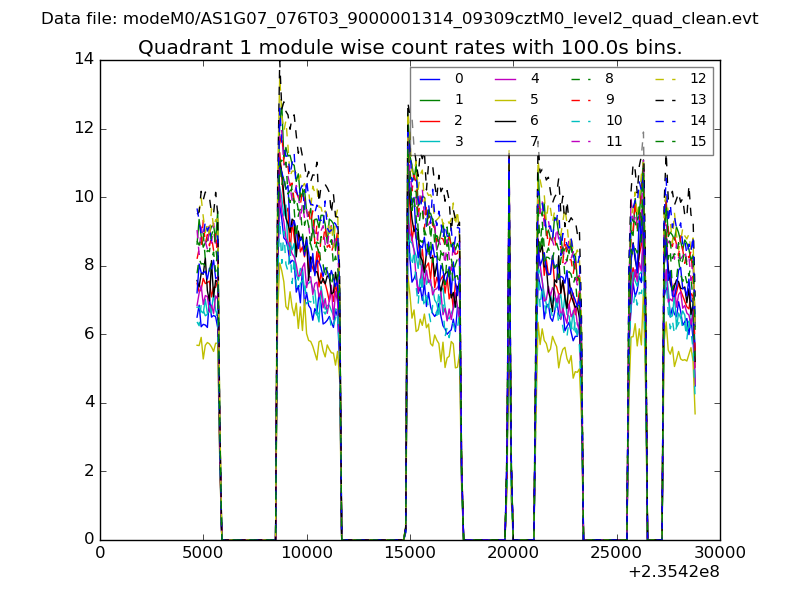
| Module-wise count rates for Quadrant A Data is divided into 100 sec bins |
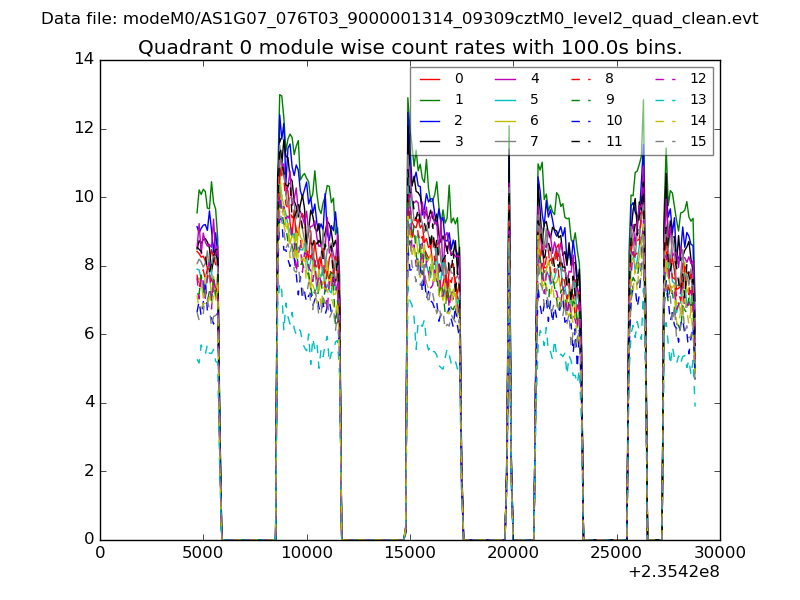 |
 |
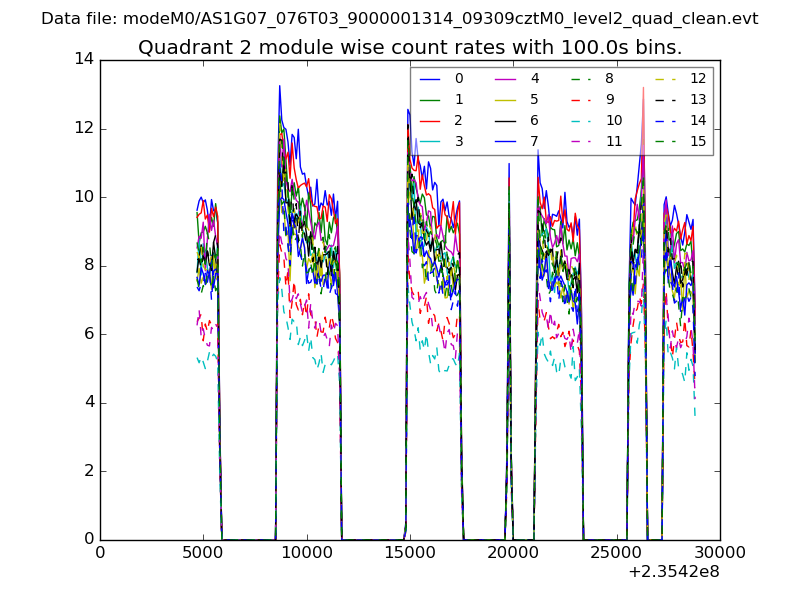
| Module-wise count rates for Quadrant B Data is divided into 100 sec bins |
 |
 |
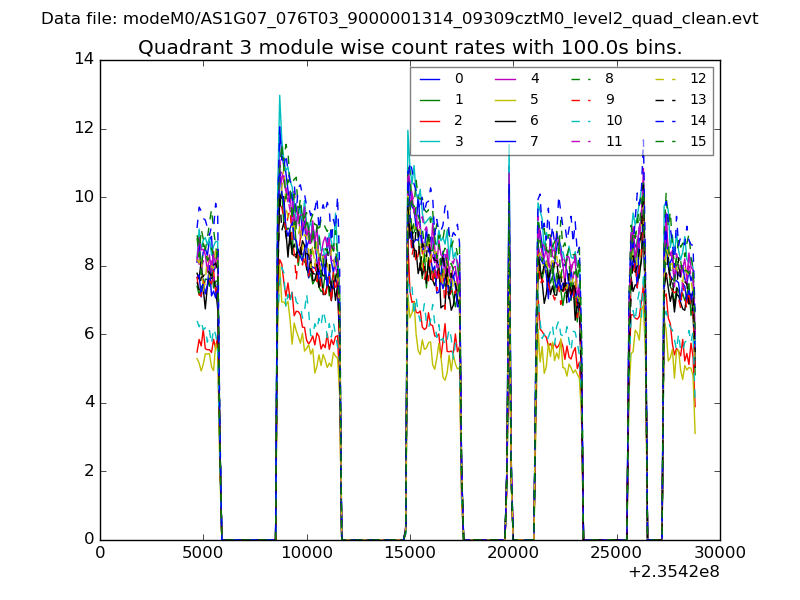
| Module-wise count rates for Quadrant C Data is divided into 100 sec bins |
 |
 |
| Module-wise count rates for Quadrant D Data is divided into 100 sec bins |
 |
 |
| Parameter | Plot |
|---|---|
| CZT HV Monitor | 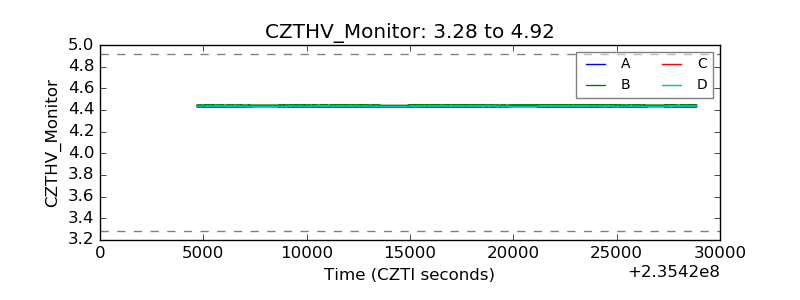 |
| D_VDD | 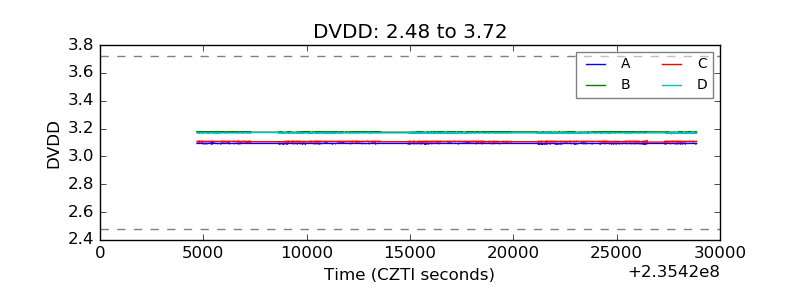 |
| Temperature 1 | 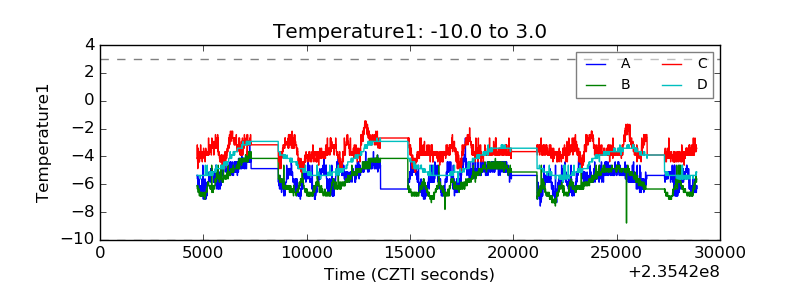 |
| Veto HV Monitor | 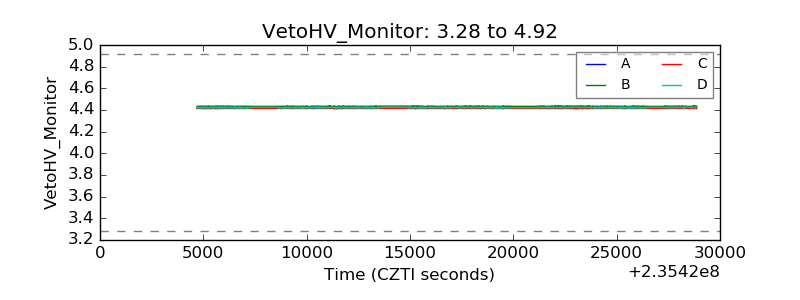 |
| Veto LLD | 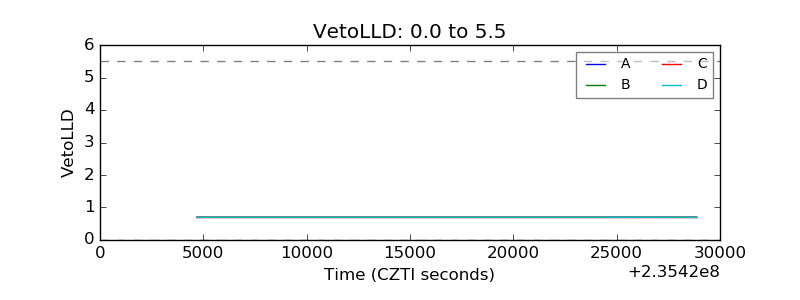 |
| Alpha Counter | 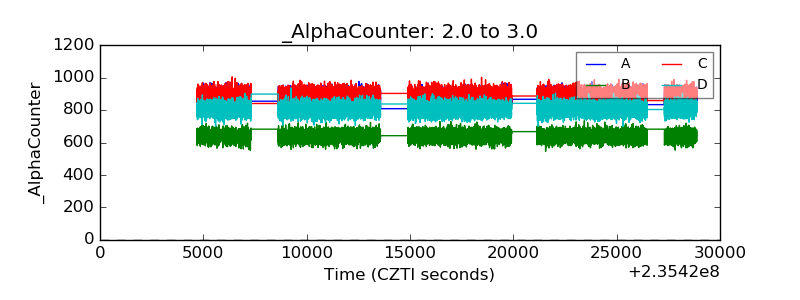 |
| _CPM_Rate | 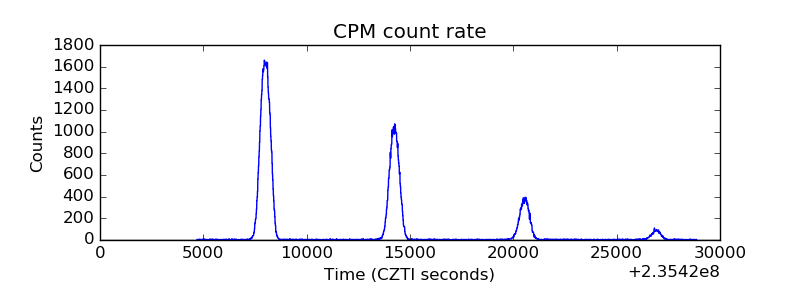 |
| CZT Counter | 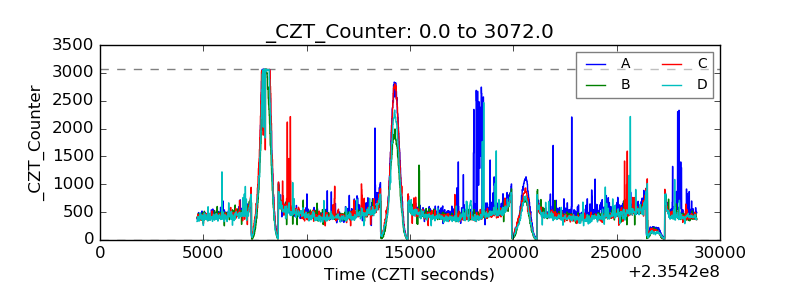 |
| +2.5 Volts monitor |  |
| +5 Volts monitor |  |
| _ROLL_ROT | 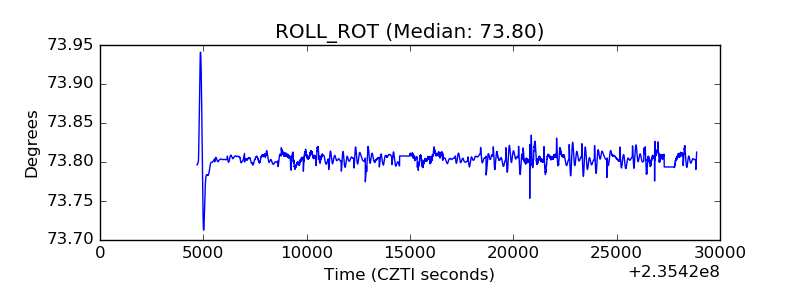 |
| _Roll_DEC | 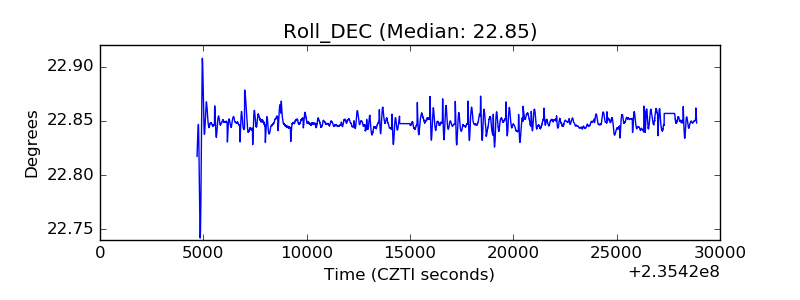 |
| _Roll_RA | 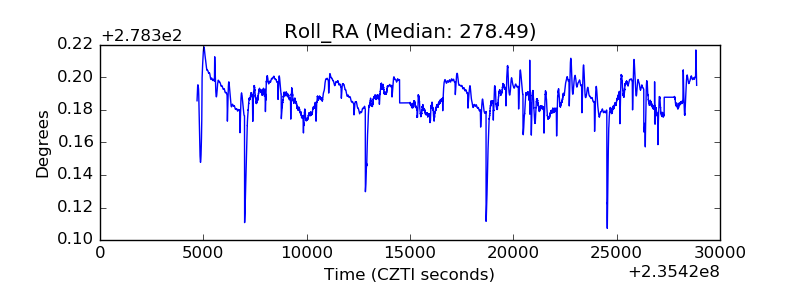 |
| Veto Counter | 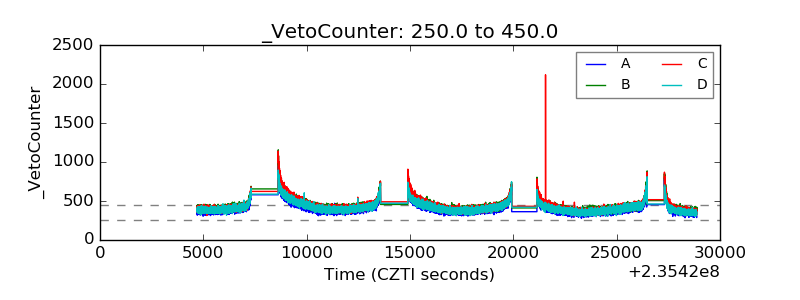 |