| Param | Original file | Final file |
|---|---|---|
| Filename | modeM0/AS1G07_077T04_9000001312cztM0_level2.fits | modeM0/AS1G07_077T04_9000001312cztM0_level2_quad_clean.evt |
| Size (bytes) | 270,852,480 | 257,143,680 |
| Size | 258.3 MB | 245.2 MB |
| Events in quadrant A | 1,617,852 | 1,493,432 |
| Events in quadrant B | 1,571,942 | 1,493,605 |
| Events in quadrant C | 1,617,802 | 1,450,362 |
| Events in quadrant D | 1,394,004 | 1,348,380 |
| Mode M9 | |||
|---|---|---|---|
| Quadrant | BADHDUFLAG | Total packets | Discarded packets |
| A | 0 | 54 | 0 |
| B | 0 | 54 | 0 |
| C | 0 | 54 | 0 |
| D | 0 | 54 | 0 |
| Mode SS | |||
|---|---|---|---|
| Quadrant | BADHDUFLAG | Total packets | Discarded packets |
| A | 0 | 594 | 0 |
| B | 0 | 594 | 0 |
| C | 0 | 594 | 0 |
| D | 0 | 594 | 0 |
| Mode M0 | |||
|---|---|---|---|
| Quadrant | BADHDUFLAG | Total packets | Discarded packets |
| A | 0 | 67223 | 0 |
| B | 0 | 61321 | 0 |
| C | 0 | 60590 | 0 |
| D | 0 | 63082 | 0 |
| Quadrant | Total seconds | Saturated seconds | Saturation percentage |
|---|---|---|---|
| A | 29119 | 578 | 1.984958% |
| B | 29112 | 352 | 1.209123% |
| C | 29112 | 279 | 0.958368% |
| D | 29109 | 509 | 1.748600% |
Noise dominated data is calculated using 1-second bins in cleaned event files. If a bin has >2000 counts, and if more than 50% of those come from <1% of pixels, then it is considered to be noise-dominated and hence unusable.
| Quadrant | # 1 sec bins | Bins with >0 counts | Bins with >2000 counts | High rate bins dominated by noise | Noise dominated (total time) | Noise dominated (detector-on time) | Marked lightcurve |
|---|---|---|---|---|---|---|---|
| A | 34573 | 29122 | 0 | 0 | 0.00% | 0.00% | 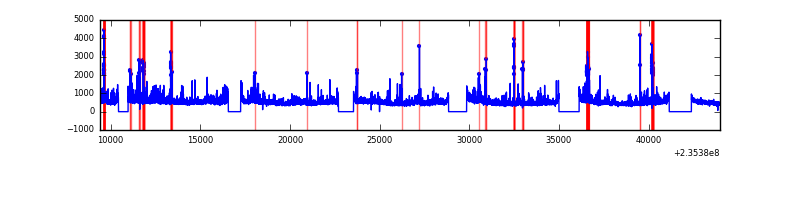 |
| B | 34573 | 29121 | 0 | 0 | 0.00% | 0.00% |  |
| C | 34573 | 29122 | 0 | 0 | 0.00% | 0.00% |  |
| D | 34573 | 29121 | 0 | 0 | 0.00% | 0.00% |  |
Top three noisy pixels from each quadrant. If the there are fewer than three noisy pixels in the level2.evt file, extra rows are filled as -1
| Pixel properties | Quadrant properties | ||||||
|---|---|---|---|---|---|---|---|
| Quadrant | DetID | PixID | Counts | Sigma | Mean | Median | Sigma |
| A | 0 | 29 | 1646 | 11.8 | 419 | 392 | 106.3 |
| A | 14 | 188 | 1621 | 11.57 | 419 | 392 | 106.3 |
| A | 14 | 204 | 1398 | 9.47 | 419 | 392 | 106.3 |
| B | 2 | 9 | 1363 | 11.41 | 414 | 394 | 84.9 |
| B | 14 | 254 | 1059 | 7.83 | 414 | 394 | 84.9 |
| B | 3 | 17 | 1054 | 7.77 | 414 | 394 | 84.9 |
| C | 1 | 81 | 1219 | 7.3 | 426 | 396 | 112.7 |
| C | 1 | 80 | 1179 | 6.95 | 426 | 396 | 112.7 |
| C | 12 | 241 | 1124 | 6.46 | 426 | 396 | 112.7 |
| D | 6 | 231 | 1083 | 6.71 | 397 | 360 | 107.7 |
| D | 3 | 31 | 996 | 5.91 | 397 | 360 | 107.7 |
| D | 10 | 189 | 985 | 5.8 | 397 | 360 | 107.7 |
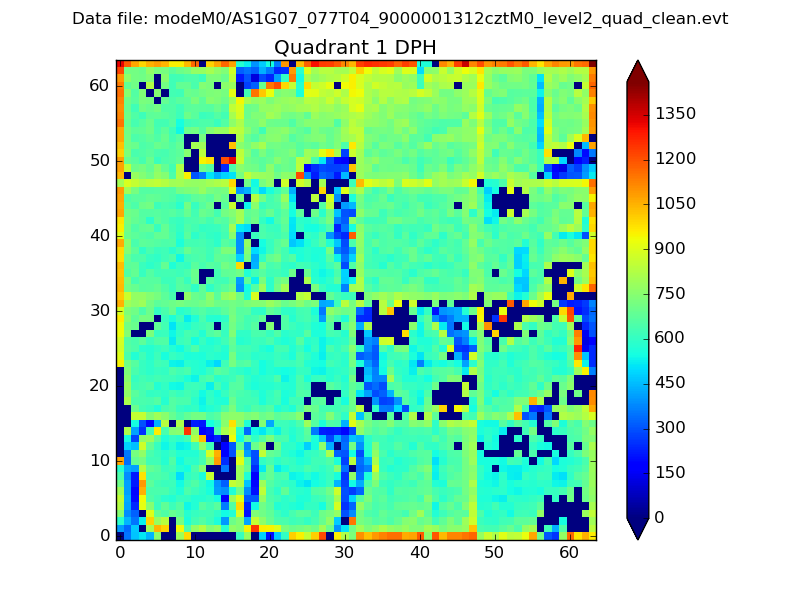
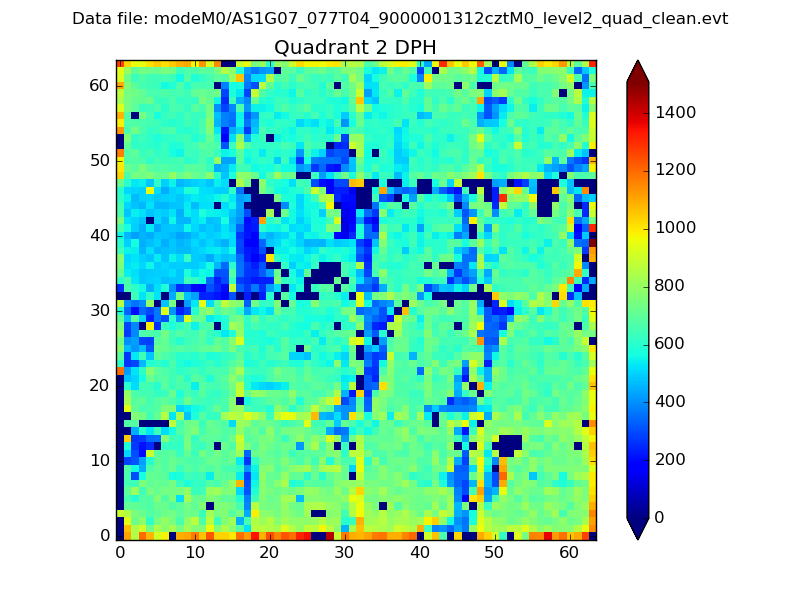
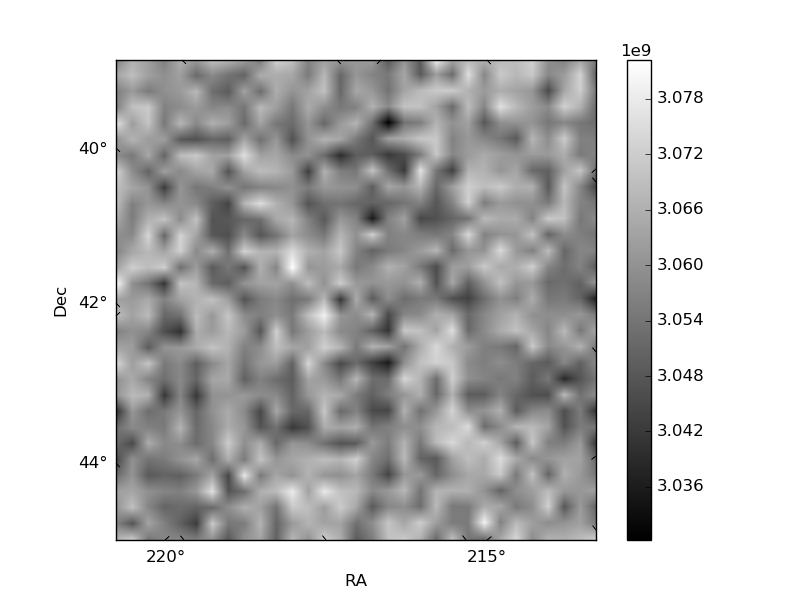
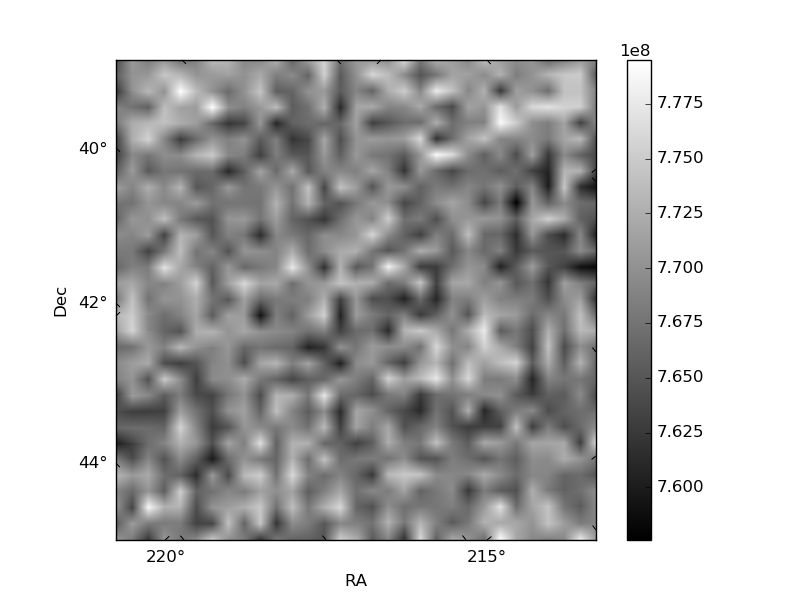
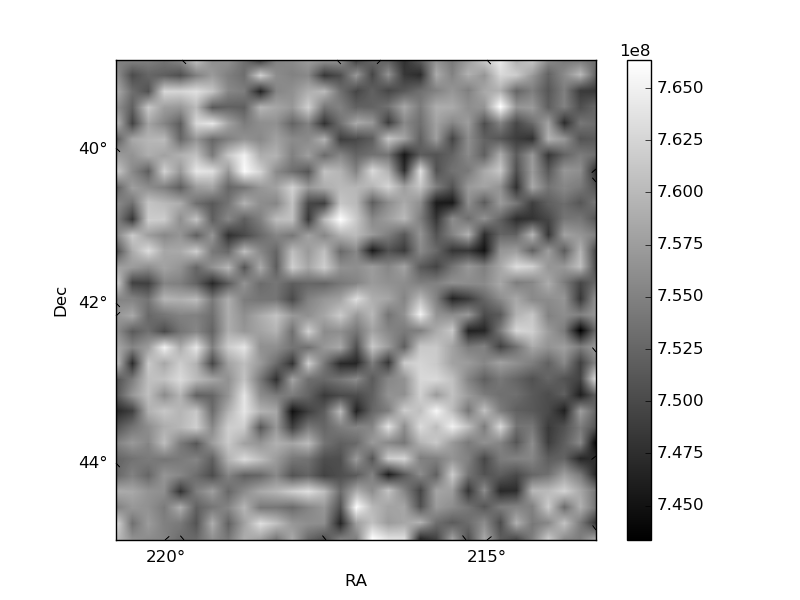
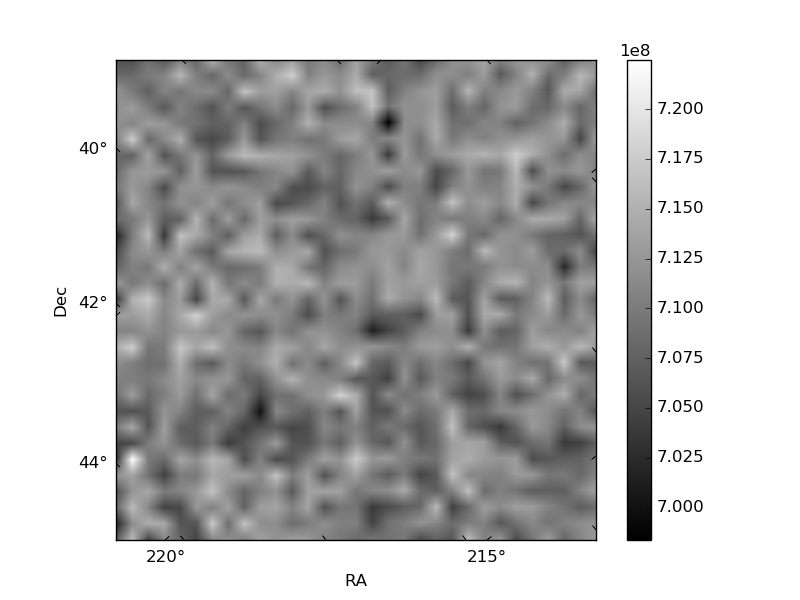
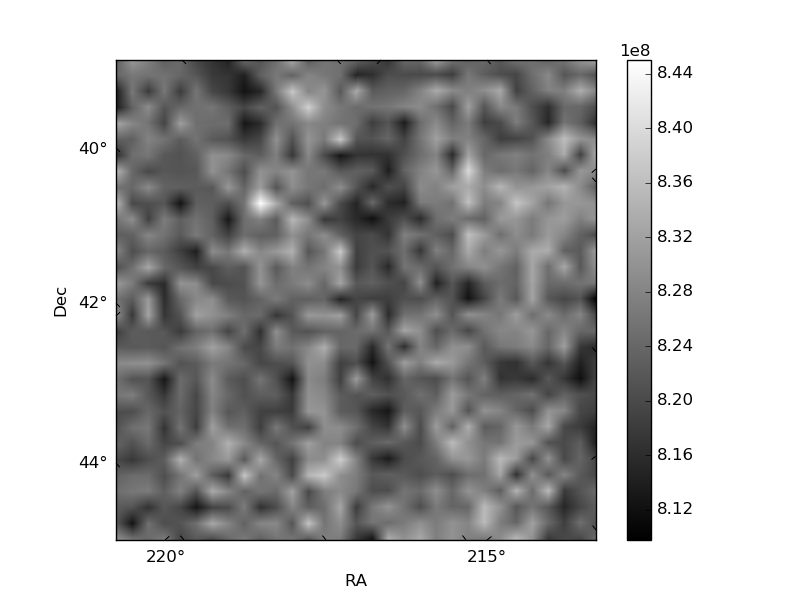
Histogram calculated using DETX and DETY for each event in the final _common_clean file
| Quadrant A |  |
 |
Quadrant B |
|---|---|---|---|
| Quadrant D | 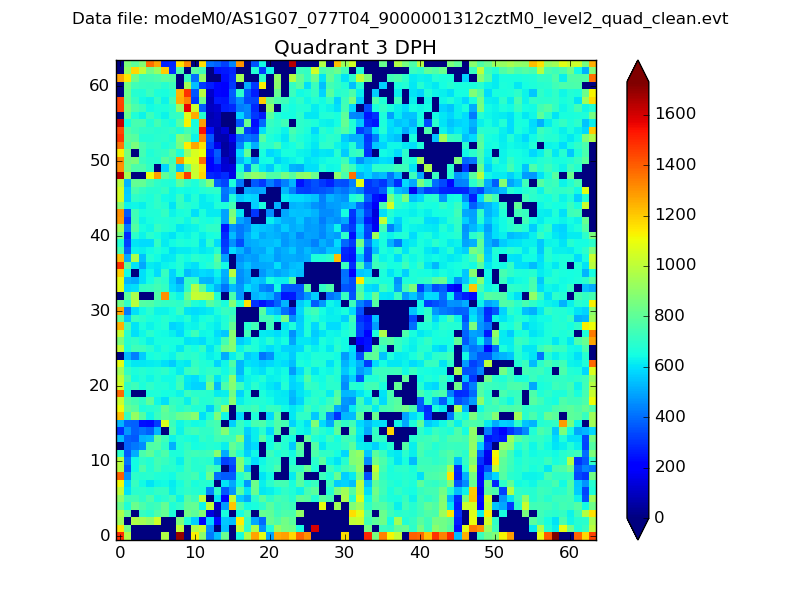 |
 |
Quadrant C |
| Plot type | Count rate plots | Images |
|---|---|---|
| Comparison with Poisson distribution Blue bars denote a histogram of data divided into 1 sec bins. Red curve is a Poisson curve with rate = median count rate of data. |
 |
 |
| Quadrant-wise count rates Data is divided into 100 sec bins |
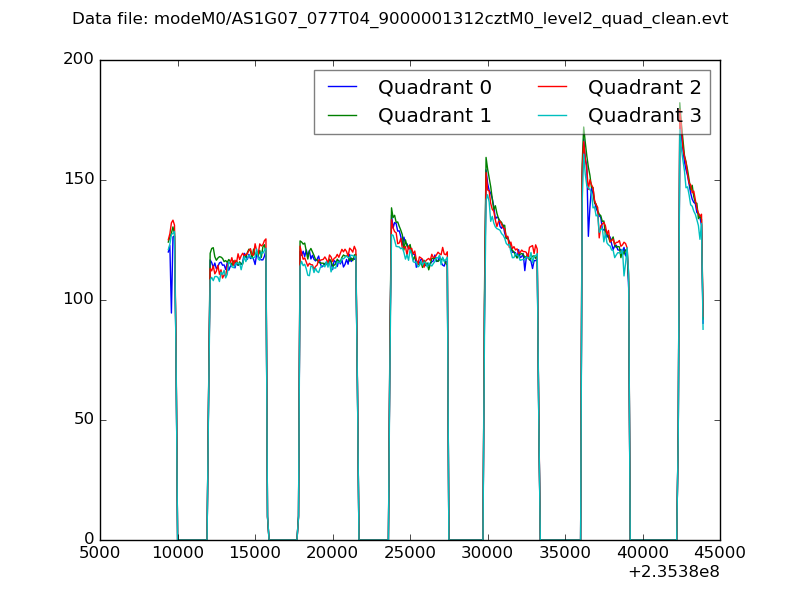 |
|
| Module-wise count rates for Quadrant A Data is divided into 100 sec bins |
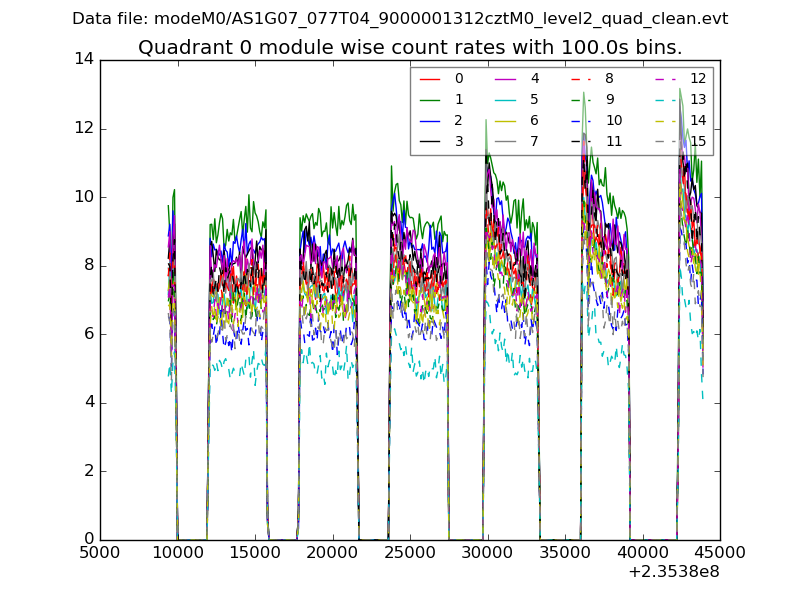 |
 |
| Module-wise count rates for Quadrant B Data is divided into 100 sec bins |
 |
 |
| Module-wise count rates for Quadrant C Data is divided into 100 sec bins |
 |
 |
| Module-wise count rates for Quadrant D Data is divided into 100 sec bins |
 |
 |
| Parameter | Plot |
|---|---|
| CZT HV Monitor |  |
| D_VDD |  |
| Temperature 1 |  |
| Veto HV Monitor |  |
| Veto LLD | 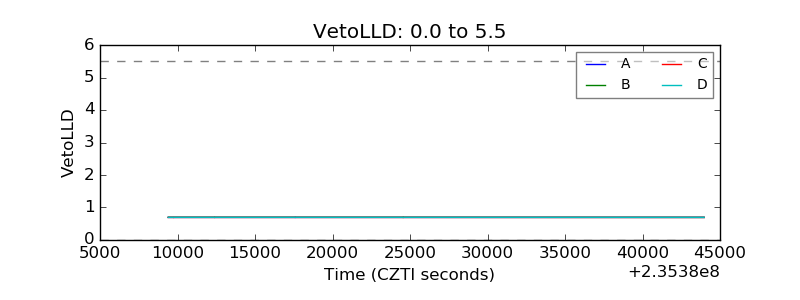 |
| Alpha Counter |  |
| _CPM_Rate |  |
| CZT Counter |  |
| +2.5 Volts monitor |  |
| +5 Volts monitor |  |
| _ROLL_ROT |  |
| _Roll_DEC |  |
| _Roll_RA |  |
| Veto Counter |  |