| Param | Original file | Final file |
|---|---|---|
| Filename | modeM0/AS1G07_077T04_9000001312_09301cztM0_level2.evt | modeM0/AS1G07_077T04_9000001312_09301cztM0_level2_quad_clean.evt |
| Size (bytes) | 463,469,760 | 96,036,480 |
| Size | 442.0 MB | 91.6 MB |
| Events in quadrant A | 3,751,319 | 607,167 |
| Events in quadrant B | 3,312,744 | 617,228 |
| Events in quadrant C | 3,134,558 | 610,563 |
| Events in quadrant D | 3,368,863 | 592,823 |
| Mode M9 | |||
|---|---|---|---|
| Quadrant | BADHDUFLAG | Total packets | Discarded packets |
| A | 0 | 8 | 0 |
| B | 0 | 8 | 0 |
| C | 0 | 8 | 0 |
| D | 0 | 8 | 0 |
| Mode SS | |||
|---|---|---|---|
| Quadrant | BADHDUFLAG | Total packets | Discarded packets |
| A | 0 | 140 | 0 |
| B | 0 | 140 | 0 |
| C | 0 | 140 | 0 |
| D | 0 | 140 | 0 |
| Mode M0 | |||
|---|---|---|---|
| Quadrant | BADHDUFLAG | Total packets | Discarded packets |
| A | 0 | 15510 | 7 |
| B | 0 | 14350 | 3 |
| C | 0 | 14026 | 5 |
| D | 0 | 14877 | 4 |
| Quadrant | Total seconds | Saturated seconds | Saturation percentage |
|---|---|---|---|
| A | 6896 | 75 | 1.087587% |
| B | 6897 | 75 | 1.087429% |
| C | 6896 | 56 | 0.812065% |
| D | 6897 | 119 | 1.725388% |
Noise dominated data is calculated using 1-second bins in cleaned event files. If a bin has >2000 counts, and if more than 50% of those come from <1% of pixels, then it is considered to be noise-dominated and hence unusable.
| Quadrant | # 1 sec bins | Bins with >0 counts | Bins with >2000 counts | High rate bins dominated by noise | Noise dominated (total time) | Noise dominated (detector-on time) | Marked lightcurve |
|---|---|---|---|---|---|---|---|
| A | 7738 | 6898 | 4 | 4 | 0.05% | 0.06% | 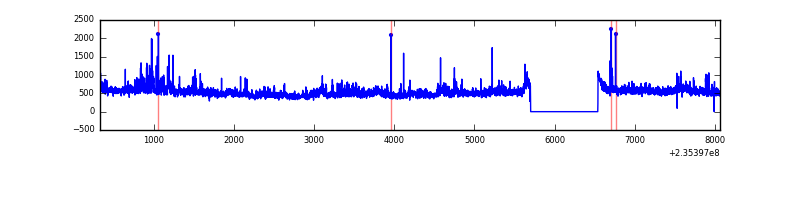 |
| B | 7738 | 6899 | 7 | 7 | 0.09% | 0.10% | 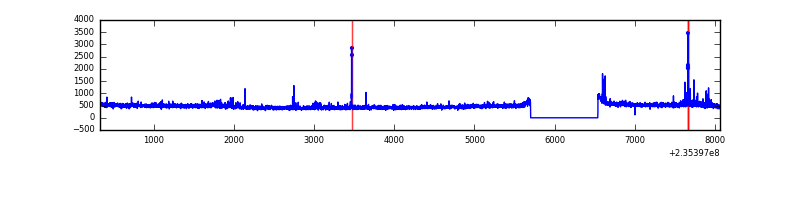 |
| C | 7738 | 6899 | 0 | 0 | 0.00% | 0.00% | 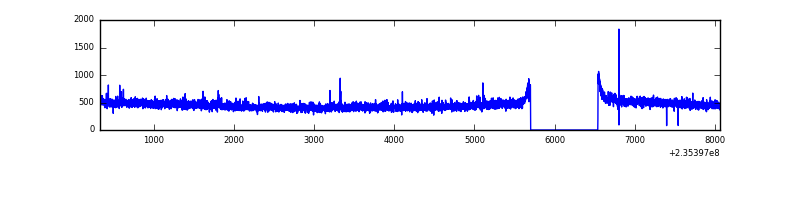 |
| D | 7738 | 6899 | 53 | 53 | 0.68% | 0.77% | 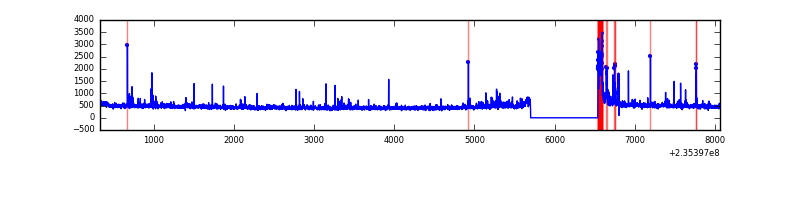 |
Top three noisy pixels from each quadrant. If the there are fewer than three noisy pixels in the level2.evt file, extra rows are filled as -1
| Pixel properties | Quadrant properties | ||||||
|---|---|---|---|---|---|---|---|
| Quadrant | DetID | PixID | Counts | Sigma | Mean | Median | Sigma |
| A | 8 | 5 | 484521 | 2903.61 | 817 | 799 | 166.6 |
| A | 1 | 162 | 47412 | 279.8 | 817 | 799 | 166.6 |
| A | 12 | 236 | 39170 | 230.33 | 817 | 799 | 166.6 |
| B | 0 | 214 | 84833 | 532.65 | 817 | 796 | 157.8 |
| B | 4 | 80 | 17745 | 107.42 | 817 | 796 | 157.8 |
| B | 12 | 111 | 17607 | 106.55 | 817 | 796 | 157.8 |
| C | 14 | 67 | 13183 | 66.62 | 798 | 799 | 185.9 |
| C | 13 | 61 | 6004 | 28.0 | 798 | 799 | 185.9 |
| C | 8 | 222 | 4360 | 19.16 | 798 | 799 | 185.9 |
| D | 2 | 136 | 166696 | 857.3 | 787 | 768 | 193.5 |
| D | 1 | 52 | 100415 | 514.85 | 787 | 768 | 193.5 |
| D | 7 | 71 | 37781 | 191.24 | 787 | 768 | 193.5 |
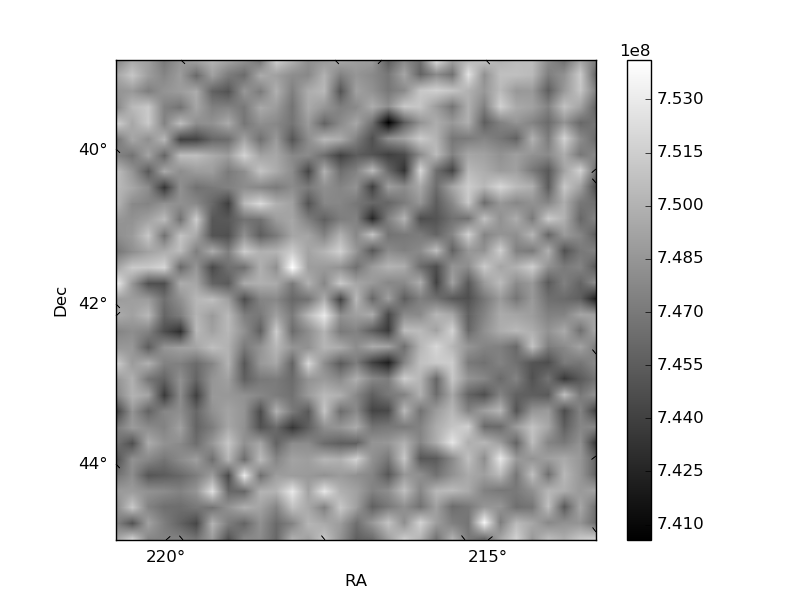
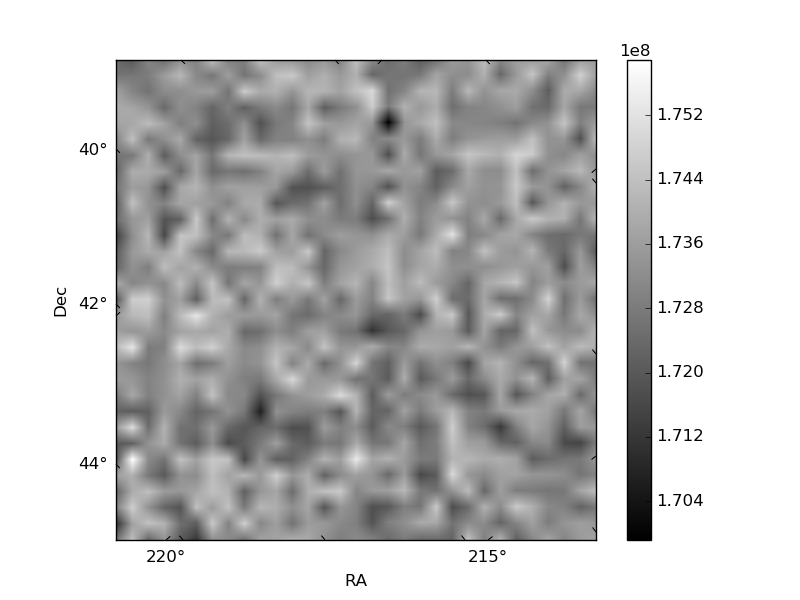
Histogram calculated using DETX and DETY for each event in the final _common_clean file
| Quadrant A | 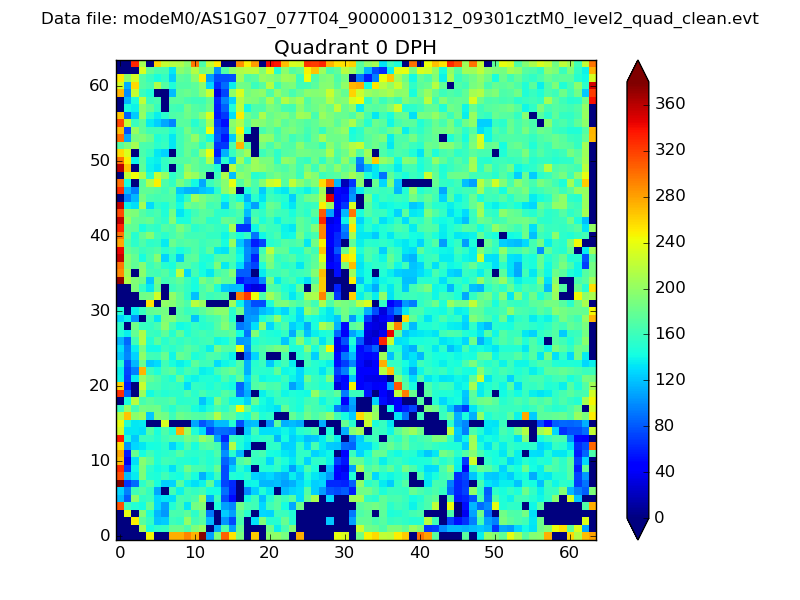 |
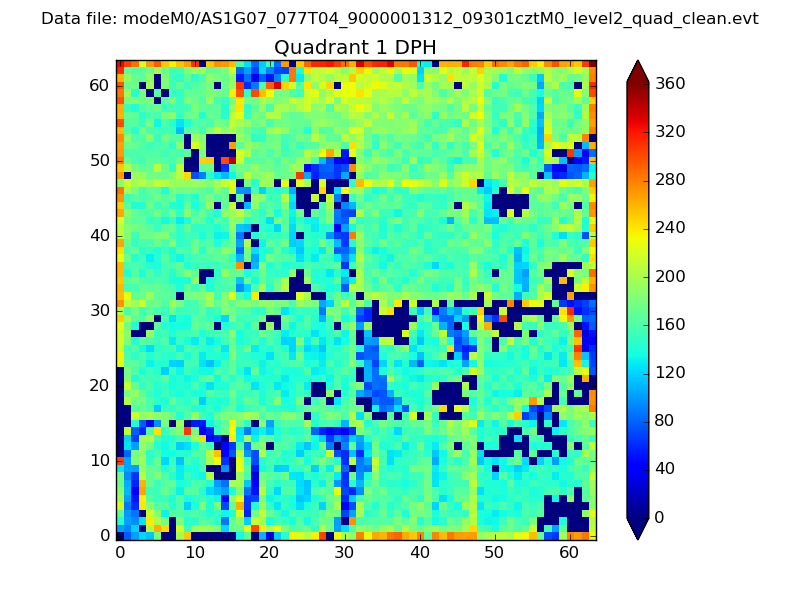 |
Quadrant B |
|---|---|---|---|
| Quadrant D |  |
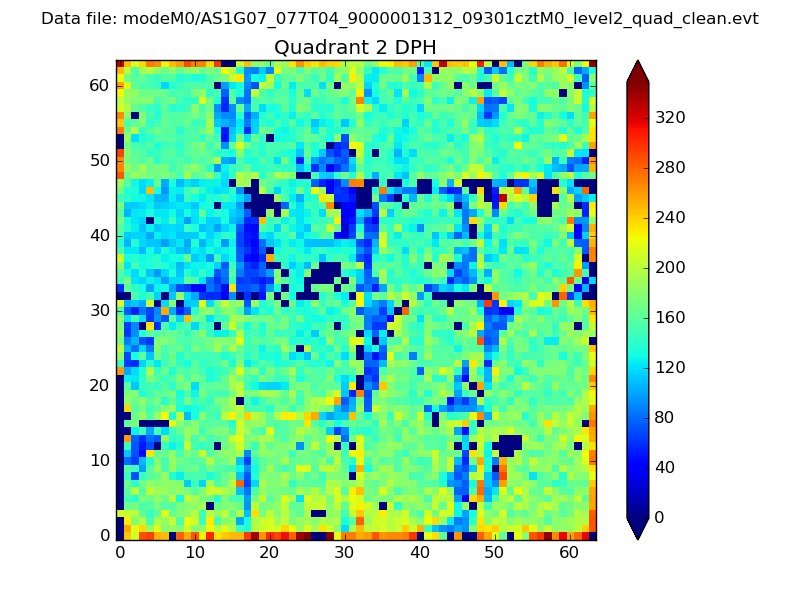 |
Quadrant C |
| Plot type | Count rate plots | Images |
|---|---|---|
| Comparison with Poisson distribution Blue bars denote a histogram of data divided into 1 sec bins. Red curve is a Poisson curve with rate = median count rate of data. |
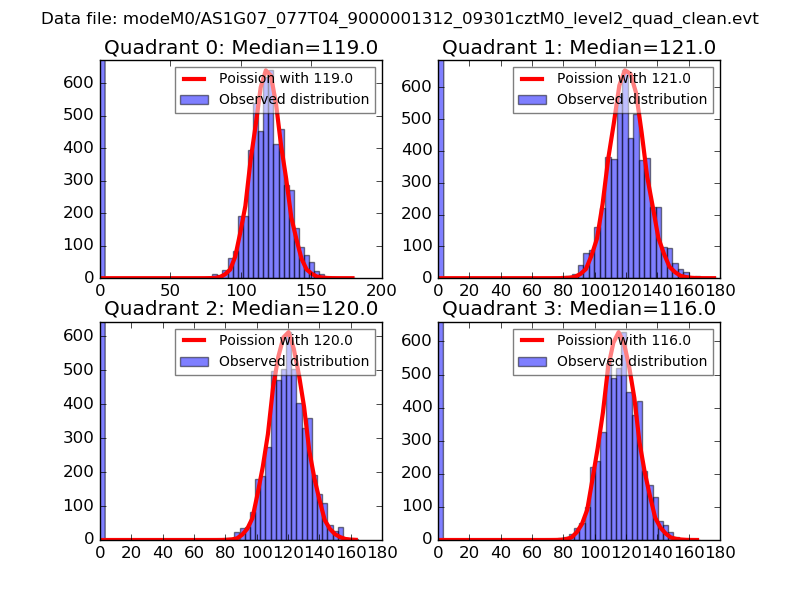 |
 |
| Quadrant-wise count rates Data is divided into 100 sec bins |
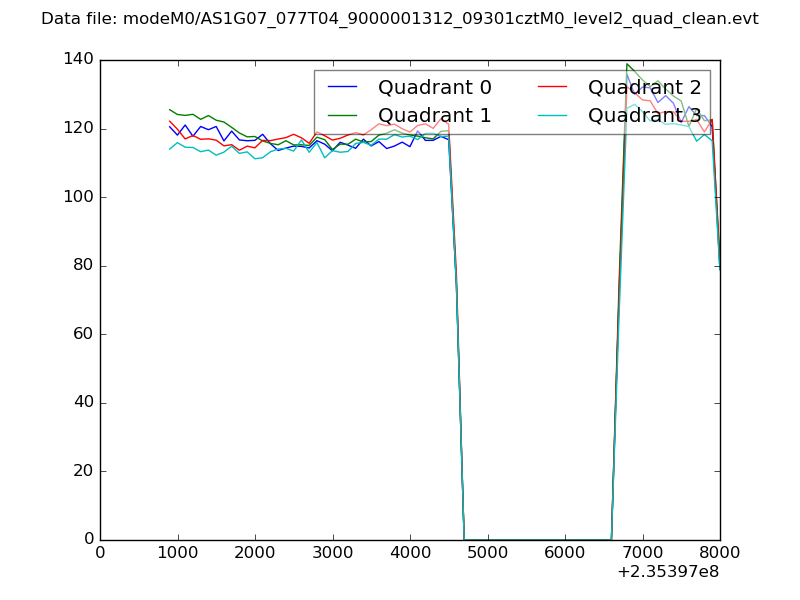 |
|
| Module-wise count rates for Quadrant A Data is divided into 100 sec bins |
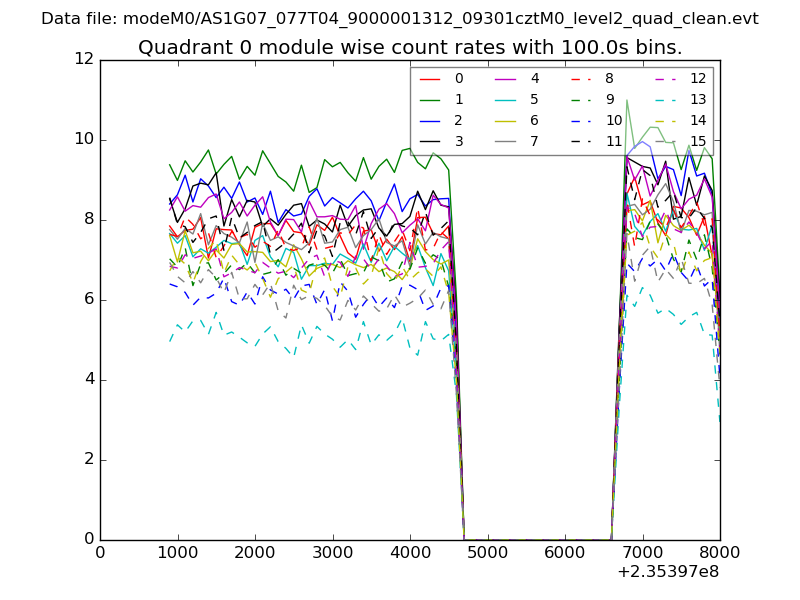 |
 |
| Module-wise count rates for Quadrant B Data is divided into 100 sec bins |
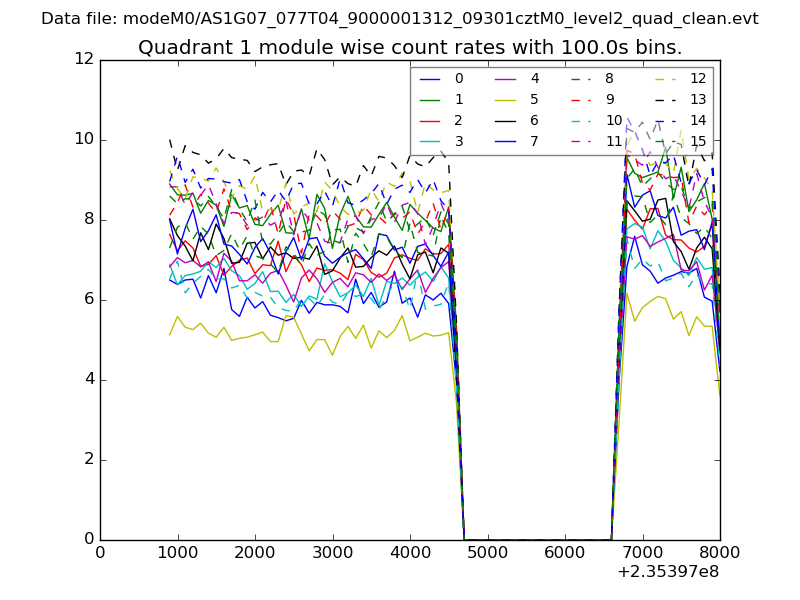 |
 |
| Module-wise count rates for Quadrant C Data is divided into 100 sec bins |
 |
 |
| Module-wise count rates for Quadrant D Data is divided into 100 sec bins |
 |
 |
| Parameter | Plot |
|---|---|
| CZT HV Monitor | 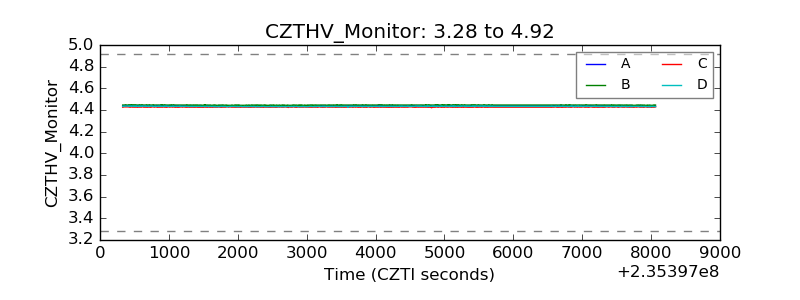 |
| D_VDD | 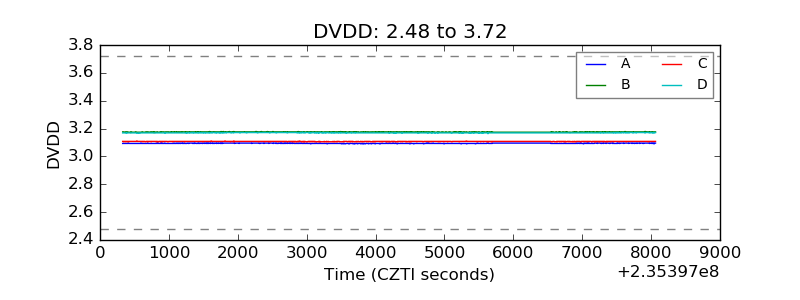 |
| Temperature 1 | 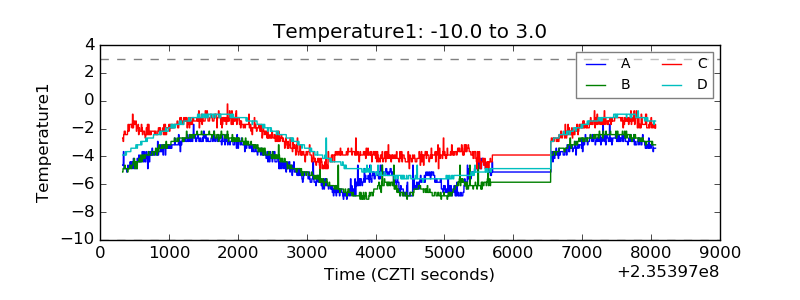 |
| Veto HV Monitor | 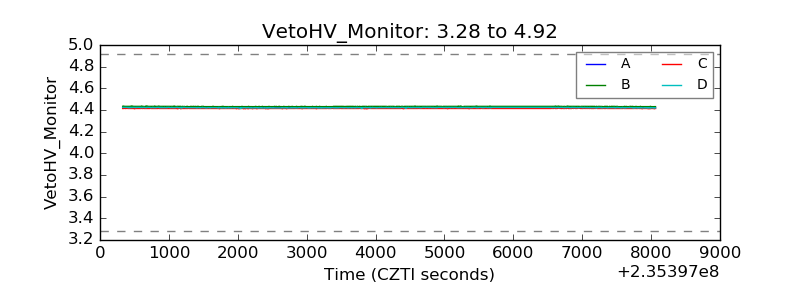 |
| Veto LLD | 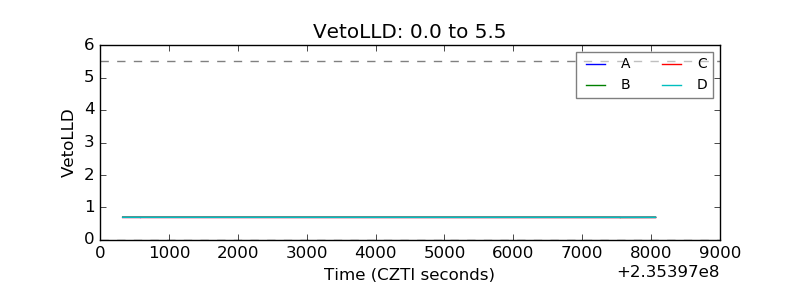 |
| Alpha Counter | 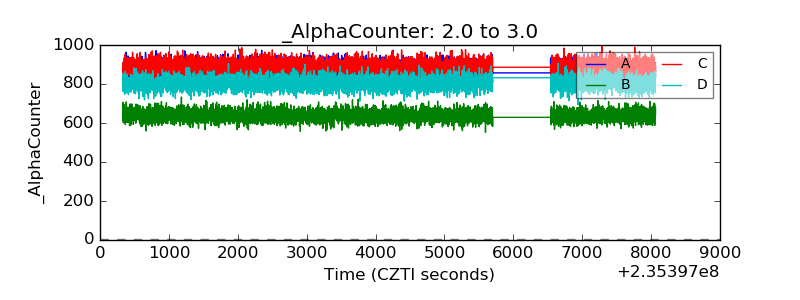 |
| _CPM_Rate | 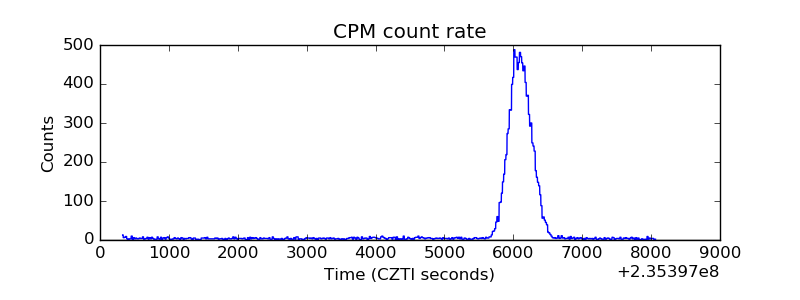 |
| CZT Counter | 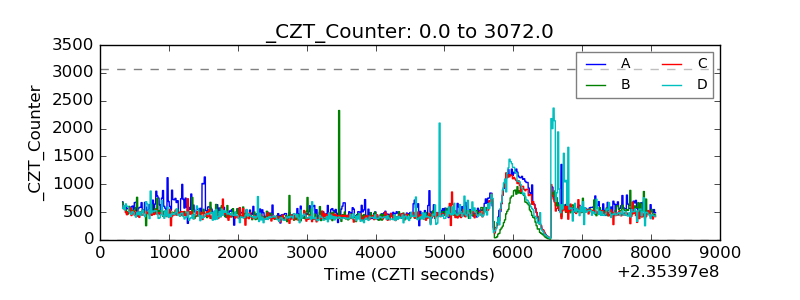 |
| +2.5 Volts monitor | 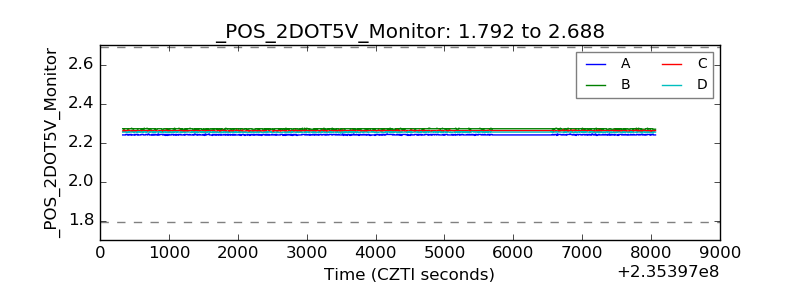 |
| +5 Volts monitor | 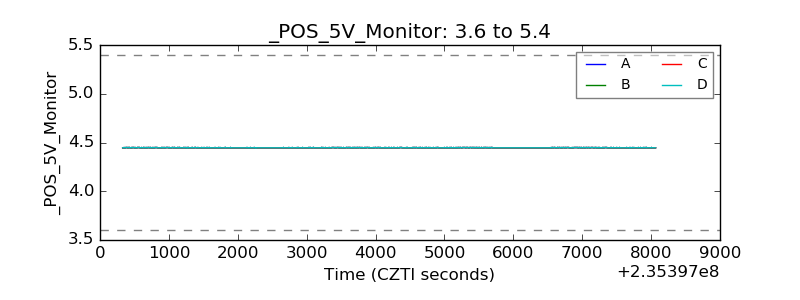 |
| _ROLL_ROT | 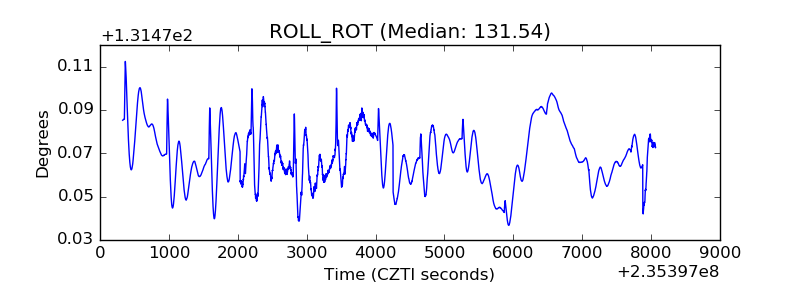 |
| _Roll_DEC | 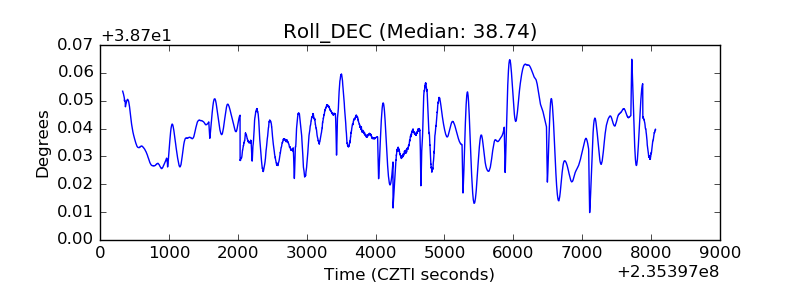 |
| _Roll_RA | 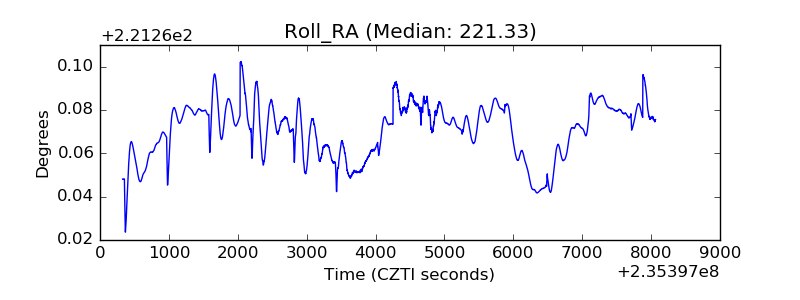 |
| Veto Counter | 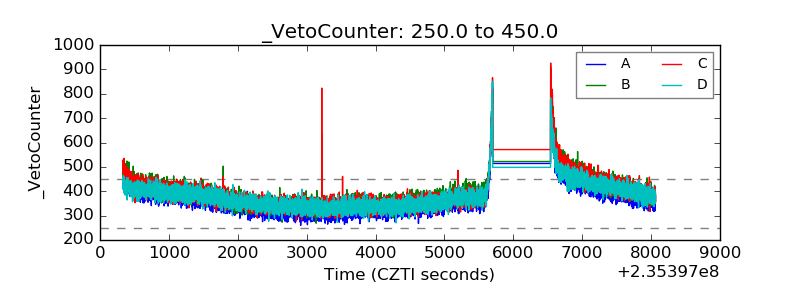 |