| Param | Original file | Final file |
|---|---|---|
| Filename | modeM0/AS1G07_077T04_9000001312_09302cztM0_level2.evt | modeM0/AS1G07_077T04_9000001312_09302cztM0_level2_quad_clean.evt |
| Size (bytes) | 404,087,040 | 90,406,080 |
| Size | 385.4 MB | 86.2 MB |
| Events in quadrant A | 3,275,146 | 581,142 |
| Events in quadrant B | 2,942,209 | 586,016 |
| Events in quadrant C | 2,754,943 | 582,669 |
| Events in quadrant D | 2,857,646 | 569,361 |
| Mode M9 | |||
|---|---|---|---|
| Quadrant | BADHDUFLAG | Total packets | Discarded packets |
| A | 0 | 10 | 0 |
| B | 0 | 10 | 0 |
| C | 0 | 10 | 0 |
| D | 0 | 10 | 0 |
| Mode SS | |||
|---|---|---|---|
| Quadrant | BADHDUFLAG | Total packets | Discarded packets |
| A | 0 | 122 | 0 |
| B | 0 | 122 | 0 |
| C | 0 | 122 | 0 |
| D | 0 | 122 | 0 |
| Mode M0 | |||
|---|---|---|---|
| Quadrant | BADHDUFLAG | Total packets | Discarded packets |
| A | 0 | 13682 | 2 |
| B | 0 | 12835 | 1 |
| C | 0 | 12305 | 1 |
| D | 0 | 12770 | 1 |
| Quadrant | Total seconds | Saturated seconds | Saturation percentage |
|---|---|---|---|
| A | 5995 | 69 | 1.150959% |
| B | 5995 | 55 | 0.917431% |
| C | 5995 | 37 | 0.617181% |
| D | 5995 | 71 | 1.184320% |
Noise dominated data is calculated using 1-second bins in cleaned event files. If a bin has >2000 counts, and if more than 50% of those come from <1% of pixels, then it is considered to be noise-dominated and hence unusable.
| Quadrant | # 1 sec bins | Bins with >0 counts | Bins with >2000 counts | High rate bins dominated by noise | Noise dominated (total time) | Noise dominated (detector-on time) | Marked lightcurve |
|---|---|---|---|---|---|---|---|
| A | 7005 | 5996 | 6 | 6 | 0.09% | 0.10% | 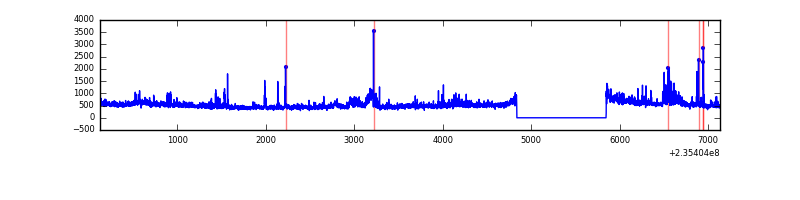 |
| B | 7005 | 5996 | 13 | 13 | 0.19% | 0.22% |  |
| C | 7005 | 5996 | 0 | 0 | 0.00% | 0.00% | 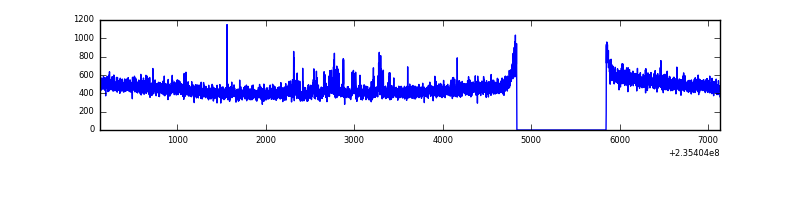 |
| D | 7005 | 5996 | 26 | 26 | 0.37% | 0.43% | 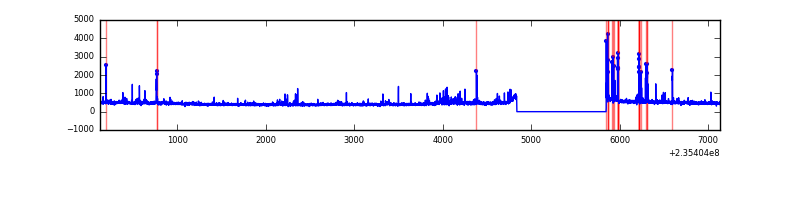 |
Top three noisy pixels from each quadrant. If the there are fewer than three noisy pixels in the level2.evt file, extra rows are filled as -1
| Pixel properties | Quadrant properties | ||||||
|---|---|---|---|---|---|---|---|
| Quadrant | DetID | PixID | Counts | Sigma | Mean | Median | Sigma |
| A | 8 | 5 | 466751 | 3234.53 | 705 | 689 | 144.1 |
| A | 1 | 162 | 45744 | 312.69 | 705 | 689 | 144.1 |
| A | 5 | 16 | 15160 | 100.43 | 705 | 689 | 144.1 |
| B | 0 | 214 | 130561 | 957.96 | 705 | 688 | 135.6 |
| B | 4 | 80 | 31502 | 227.29 | 705 | 688 | 135.6 |
| B | 3 | 209 | 20145 | 143.52 | 705 | 688 | 135.6 |
| C | 9 | 68 | 45821 | 282.61 | 691 | 694 | 159.7 |
| C | 14 | 67 | 9382 | 54.41 | 691 | 694 | 159.7 |
| C | 13 | 61 | 5105 | 27.62 | 691 | 694 | 159.7 |
| D | 1 | 52 | 127415 | 740.33 | 686 | 669 | 171.2 |
| D | 2 | 136 | 47466 | 273.34 | 686 | 669 | 171.2 |
| D | 7 | 71 | 34083 | 195.17 | 686 | 669 | 171.2 |
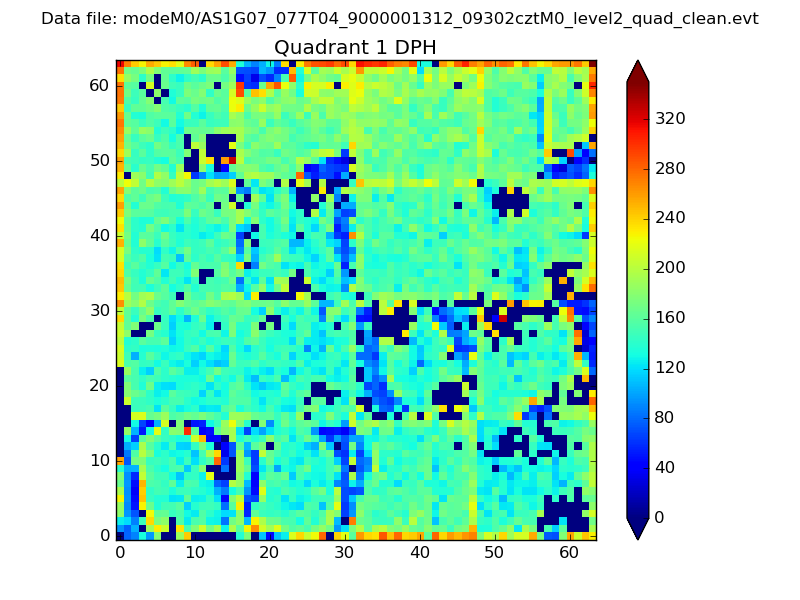
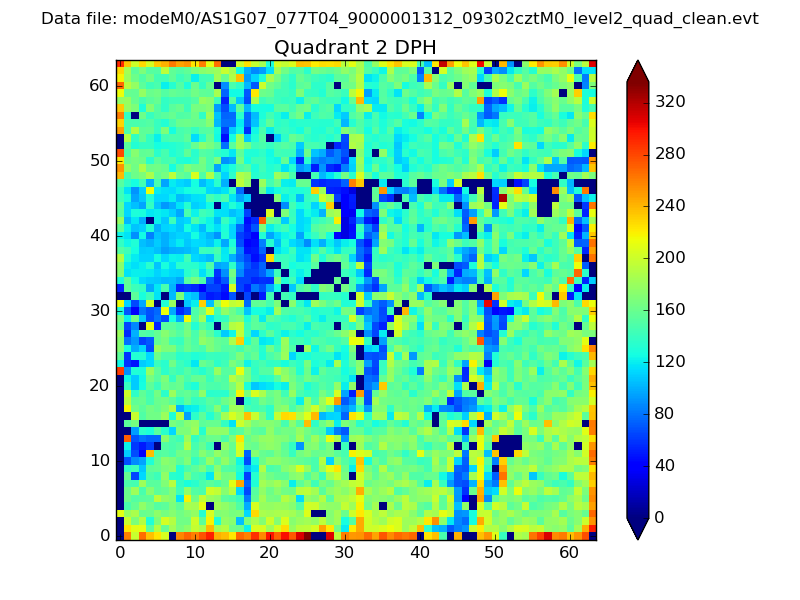
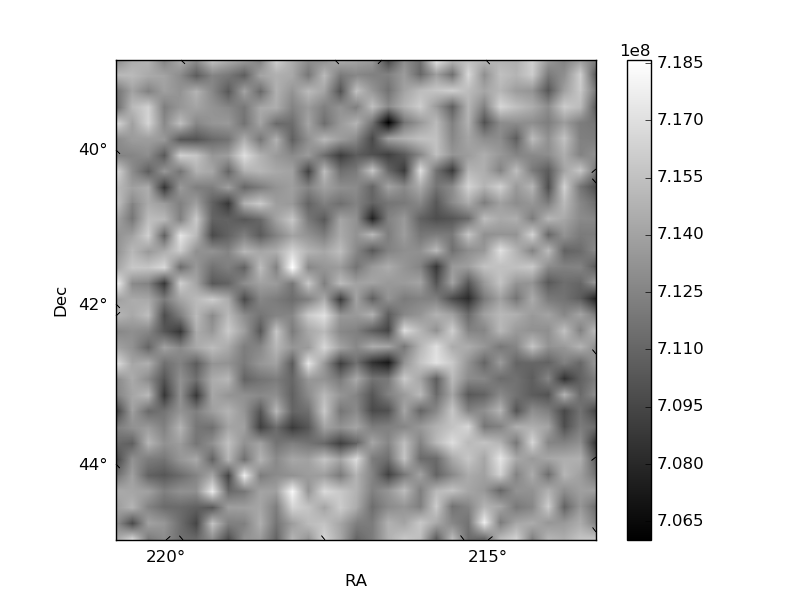
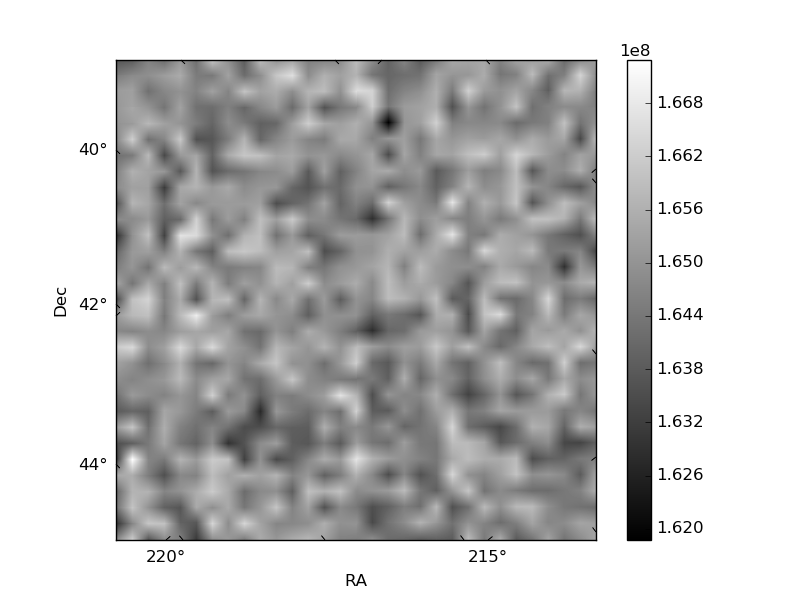
Histogram calculated using DETX and DETY for each event in the final _common_clean file
| Quadrant A | 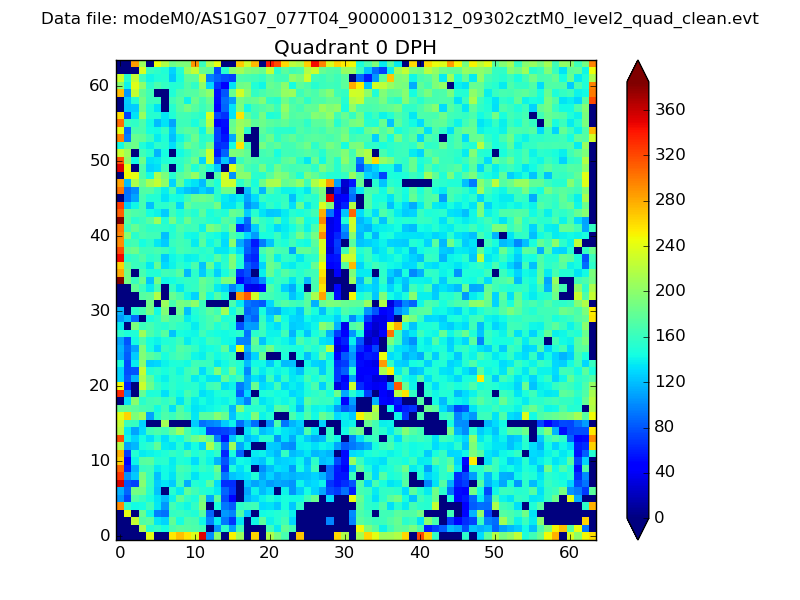 |
 |
Quadrant B |
|---|---|---|---|
| Quadrant D | 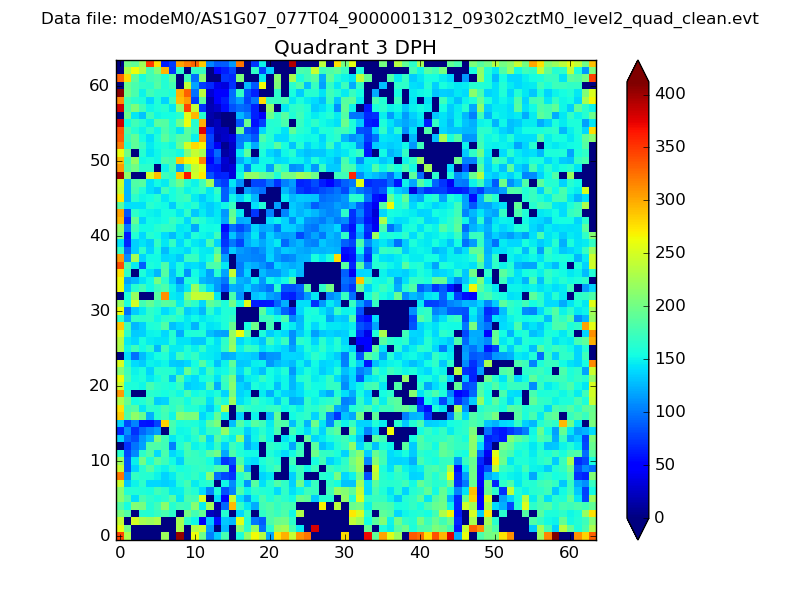 |
 |
Quadrant C |
| Plot type | Count rate plots | Images |
|---|---|---|
| Comparison with Poisson distribution Blue bars denote a histogram of data divided into 1 sec bins. Red curve is a Poisson curve with rate = median count rate of data. |
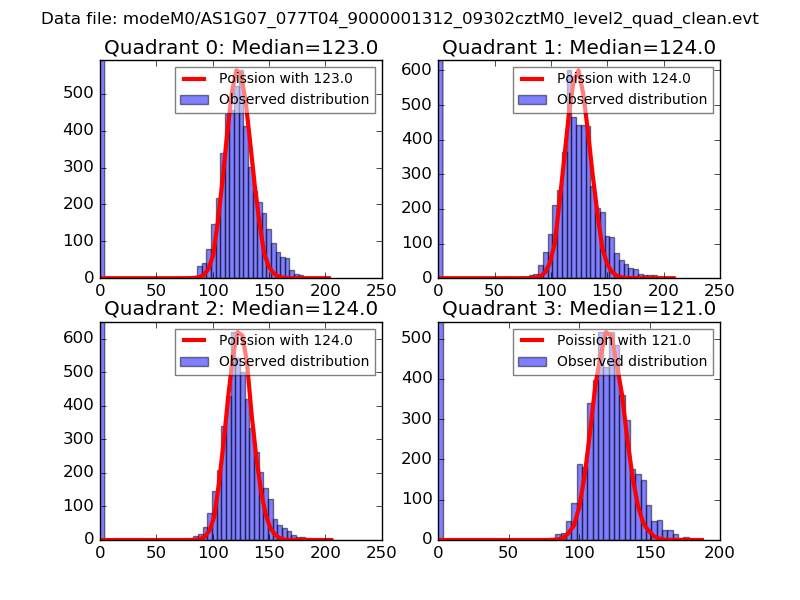 |
 |
| Quadrant-wise count rates Data is divided into 100 sec bins |
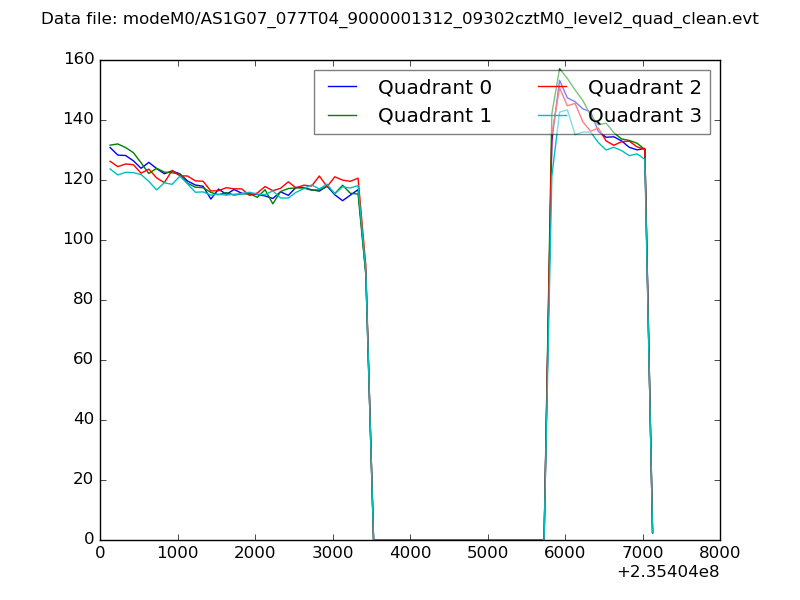 |
|
| Module-wise count rates for Quadrant A Data is divided into 100 sec bins |
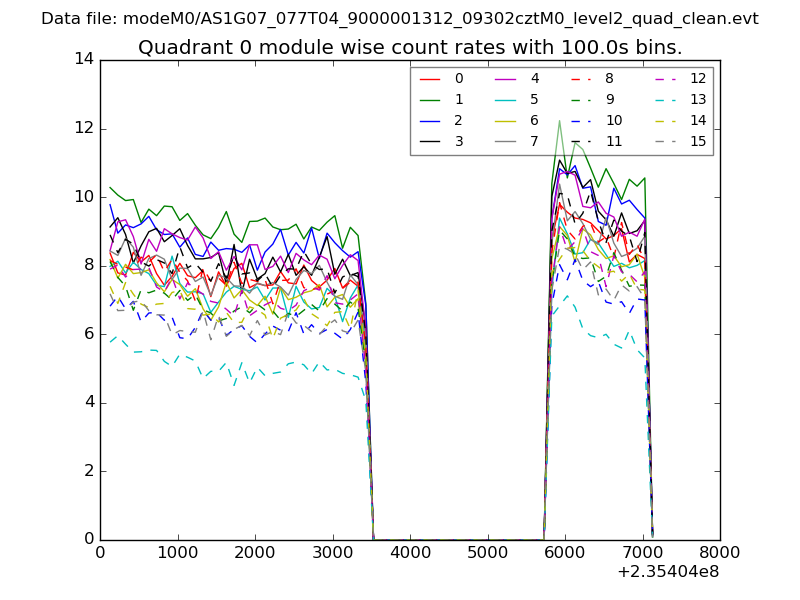 |
 |
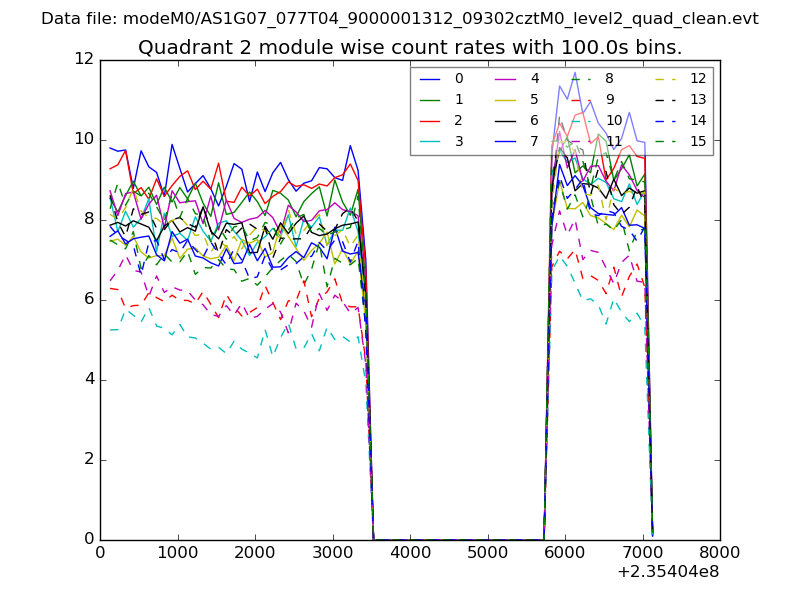
| Module-wise count rates for Quadrant B Data is divided into 100 sec bins |
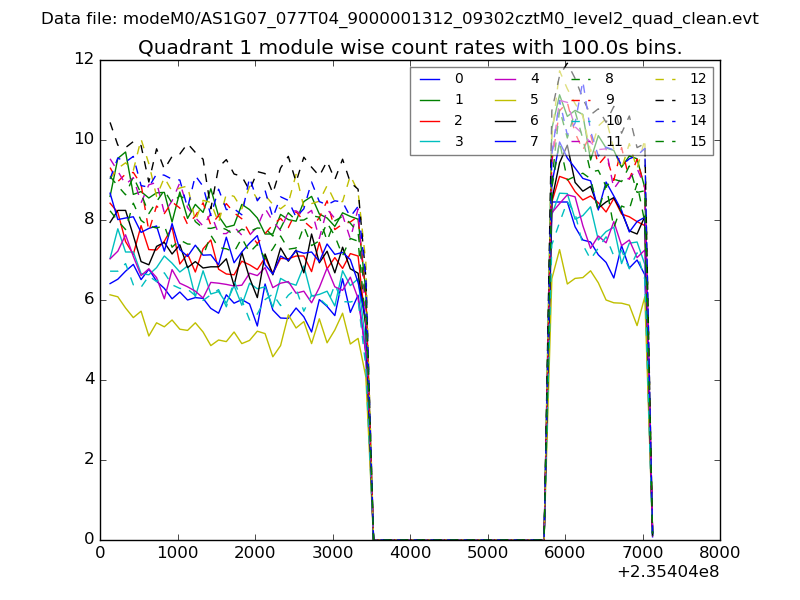 |
 |
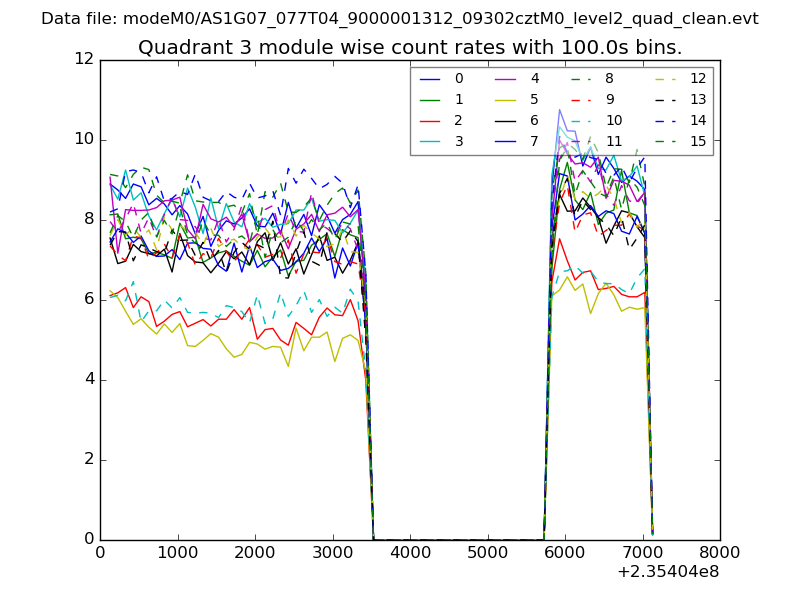
| Module-wise count rates for Quadrant C Data is divided into 100 sec bins |
 |
 |
| Module-wise count rates for Quadrant D Data is divided into 100 sec bins |
 |
 |
| Parameter | Plot |
|---|---|
| CZT HV Monitor | 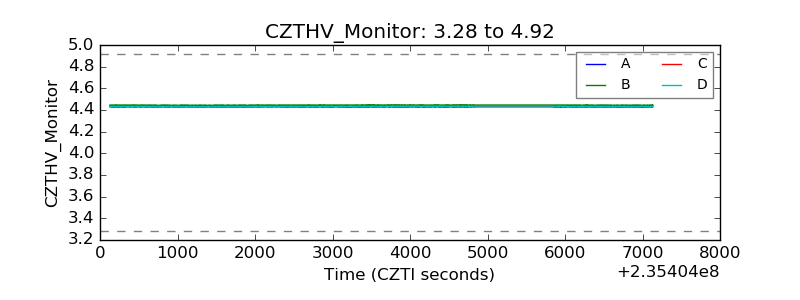 |
| D_VDD |  |
| Temperature 1 | 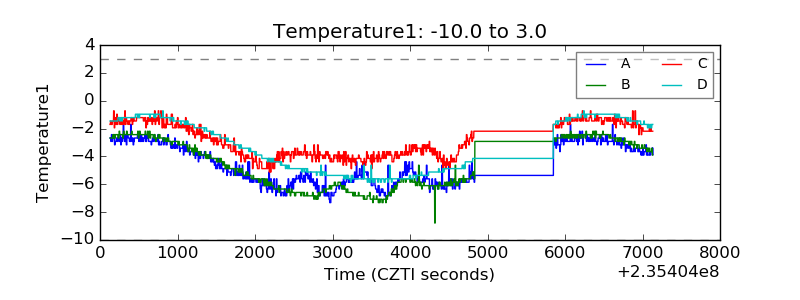 |
| Veto HV Monitor | 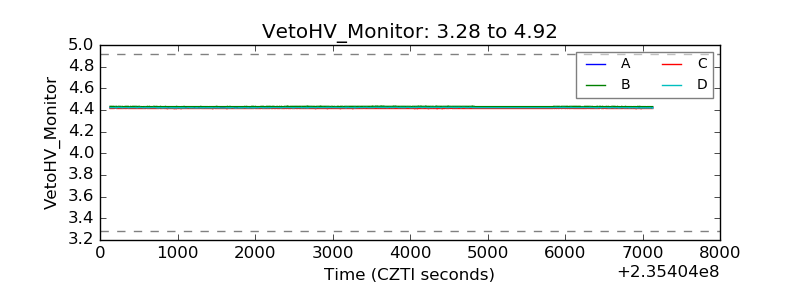 |
| Veto LLD | 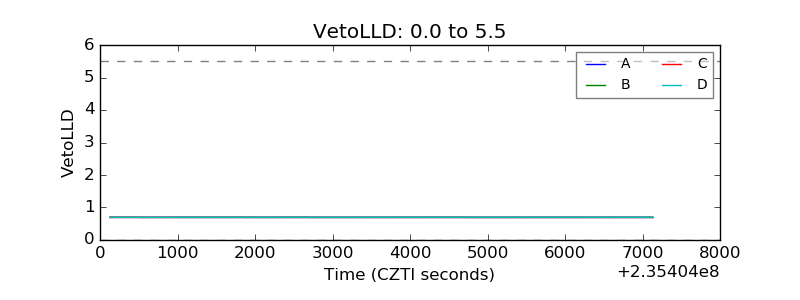 |
| Alpha Counter | 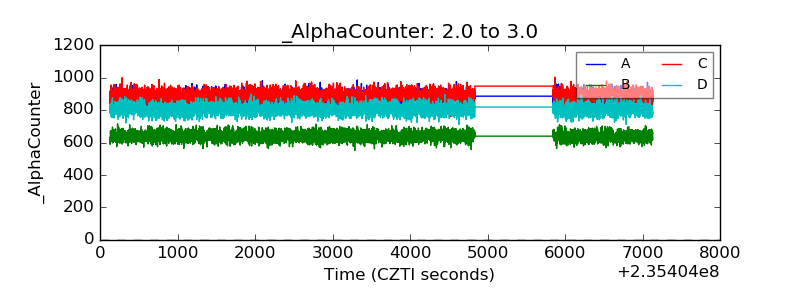 |
| _CPM_Rate | 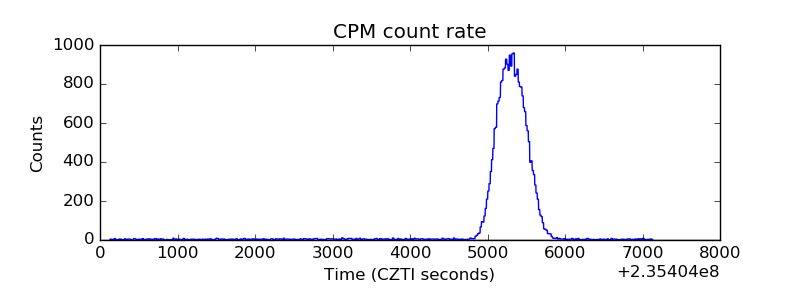 |
| CZT Counter | 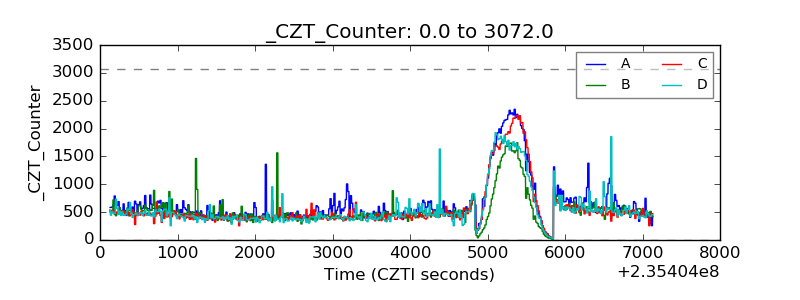 |
| +2.5 Volts monitor |  |
| +5 Volts monitor |  |
| _ROLL_ROT | 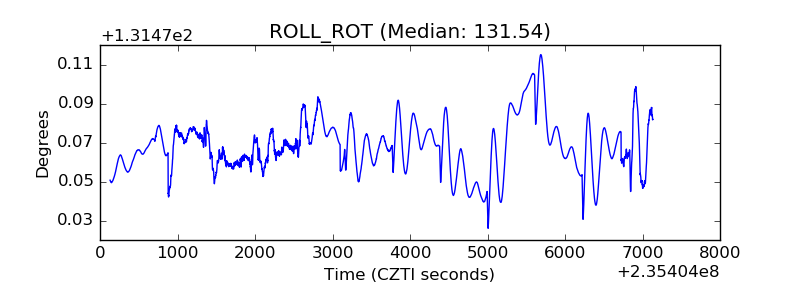 |
| _Roll_DEC | 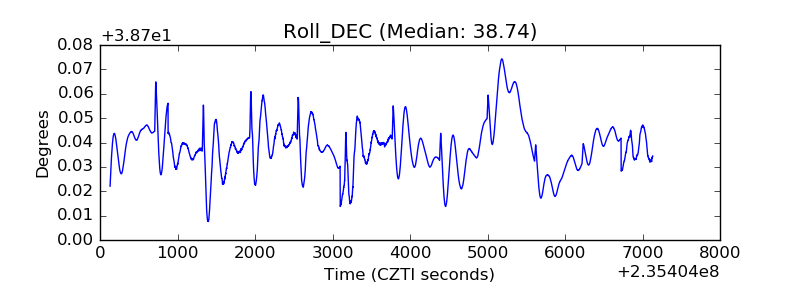 |
| _Roll_RA | 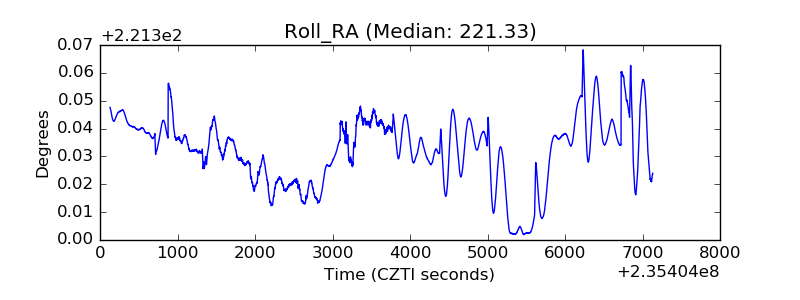 |
| Veto Counter | 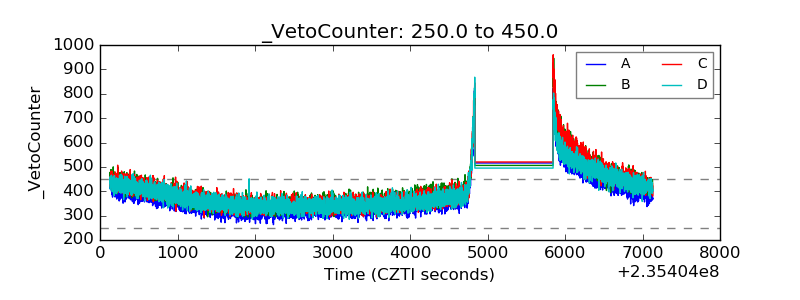 |