| Param | Original file | Final file |
|---|---|---|
| Filename | modeM0/AS1G07_077T04_9000001312_09305cztM0_level2.evt | modeM0/AS1G07_077T04_9000001312_09305cztM0_level2_quad_clean.evt |
| Size (bytes) | 463,622,400 | 94,697,280 |
| Size | 442.1 MB | 90.3 MB |
| Events in quadrant A | 3,477,832 | 604,172 |
| Events in quadrant B | 3,277,657 | 617,185 |
| Events in quadrant C | 3,314,205 | 614,189 |
| Events in quadrant D | 3,541,992 | 591,687 |
| Mode M9 | |||
|---|---|---|---|
| Quadrant | BADHDUFLAG | Total packets | Discarded packets |
| A | 0 | 17 | 0 |
| B | 0 | 17 | 0 |
| C | 0 | 17 | 0 |
| D | 0 | 18 | 0 |
| Mode SS | |||
|---|---|---|---|
| Quadrant | BADHDUFLAG | Total packets | Discarded packets |
| A | 0 | 128 | 0 |
| B | 0 | 128 | 0 |
| C | 0 | 128 | 0 |
| D | 0 | 128 | 0 |
| Mode M0 | |||
|---|---|---|---|
| Quadrant | BADHDUFLAG | Total packets | Discarded packets |
| A | 0 | 14517 | 3 |
| B | 0 | 14014 | 5 |
| C | 0 | 14094 | 2 |
| D | 0 | 14903 | 2 |
| Quadrant | Total seconds | Saturated seconds | Saturation percentage |
|---|---|---|---|
| A | 6316 | 129 | 2.042432% |
| B | 6315 | 46 | 0.728424% |
| C | 6316 | 40 | 0.633312% |
| D | 6316 | 167 | 2.644079% |
Noise dominated data is calculated using 1-second bins in cleaned event files. If a bin has >2000 counts, and if more than 50% of those come from <1% of pixels, then it is considered to be noise-dominated and hence unusable.
| Quadrant | # 1 sec bins | Bins with >0 counts | Bins with >2000 counts | High rate bins dominated by noise | Noise dominated (total time) | Noise dominated (detector-on time) | Marked lightcurve |
|---|---|---|---|---|---|---|---|
| A | 7556 | 6317 | 70 | 70 | 0.93% | 1.11% | 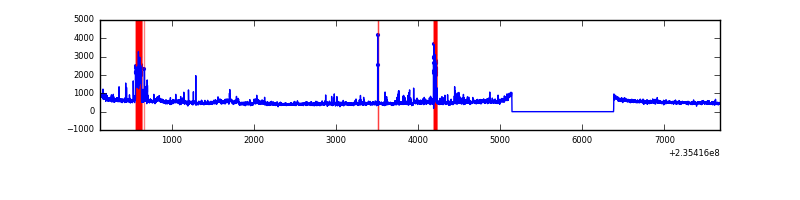 |
| B | 7556 | 6316 | 4 | 4 | 0.05% | 0.06% | 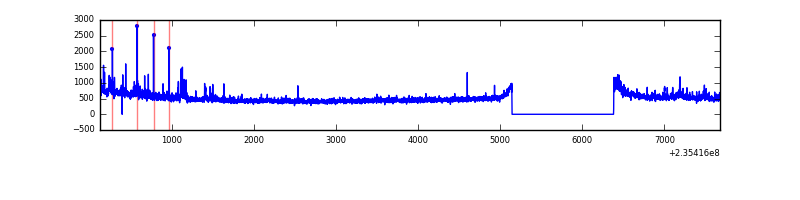 |
| C | 7556 | 6317 | 6 | 6 | 0.08% | 0.09% |  |
| D | 7556 | 6317 | 127 | 127 | 1.68% | 2.01% | 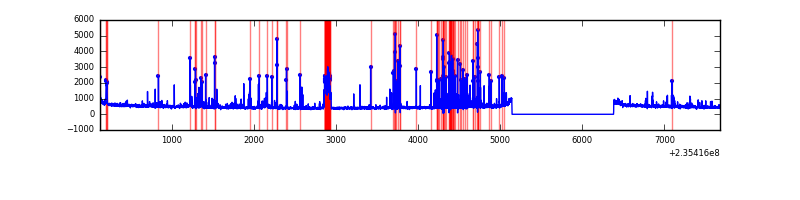 |
Top three noisy pixels from each quadrant. If the there are fewer than three noisy pixels in the level2.evt file, extra rows are filled as -1
| Pixel properties | Quadrant properties | ||||||
|---|---|---|---|---|---|---|---|
| Quadrant | DetID | PixID | Counts | Sigma | Mean | Median | Sigma |
| A | 15 | 239 | 199745 | 1285.57 | 768 | 752 | 154.8 |
| A | 8 | 5 | 165202 | 1062.41 | 768 | 752 | 154.8 |
| A | 5 | 16 | 91715 | 587.66 | 768 | 752 | 154.8 |
| B | 0 | 219 | 110111 | 745.81 | 778 | 761 | 146.6 |
| B | 0 | 214 | 63827 | 430.13 | 778 | 761 | 146.6 |
| B | 8 | 234 | 43911 | 294.3 | 778 | 761 | 146.6 |
| C | 9 | 68 | 322889 | 1842.49 | 765 | 770 | 174.8 |
| C | 13 | 61 | 5869 | 29.17 | 765 | 770 | 174.8 |
| C | 14 | 67 | 5026 | 24.34 | 765 | 770 | 174.8 |
| D | 1 | 52 | 415861 | 2227.96 | 750 | 734 | 186.3 |
| D | 12 | 227 | 153389 | 819.29 | 750 | 734 | 186.3 |
| D | 7 | 71 | 56598 | 299.82 | 750 | 734 | 186.3 |
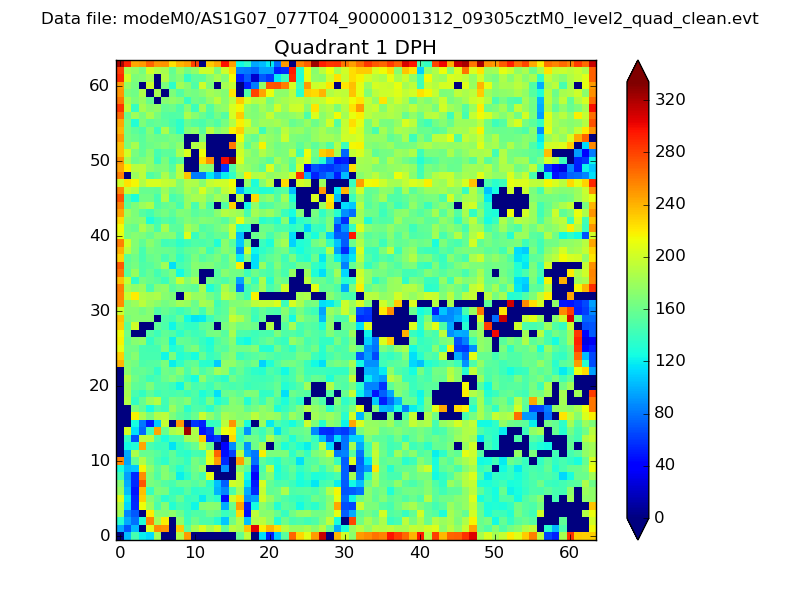
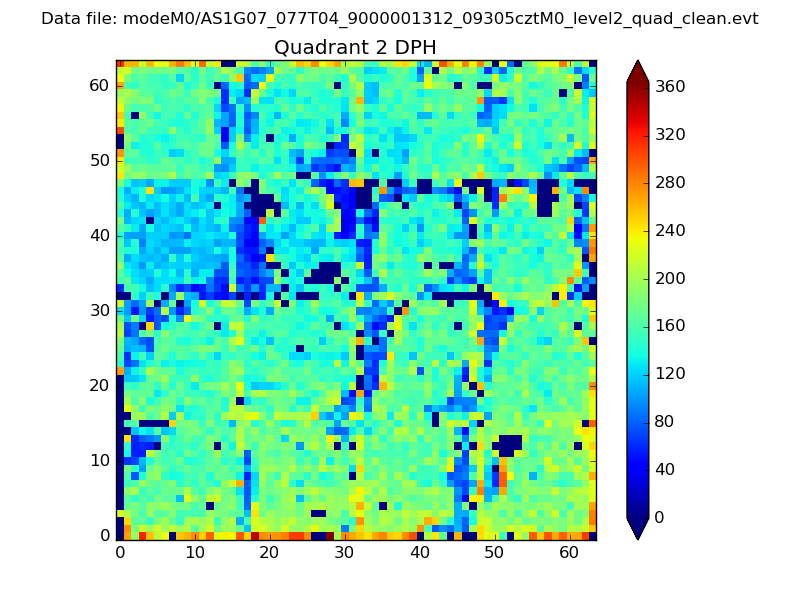
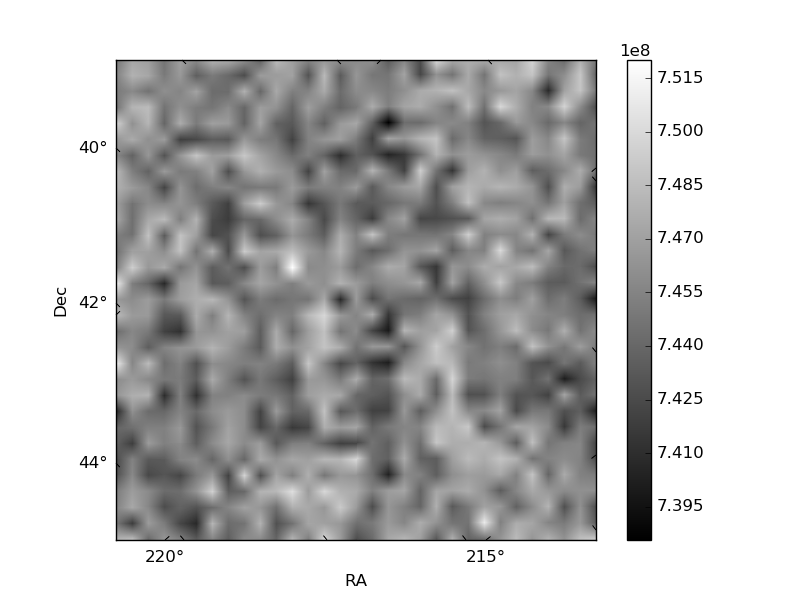
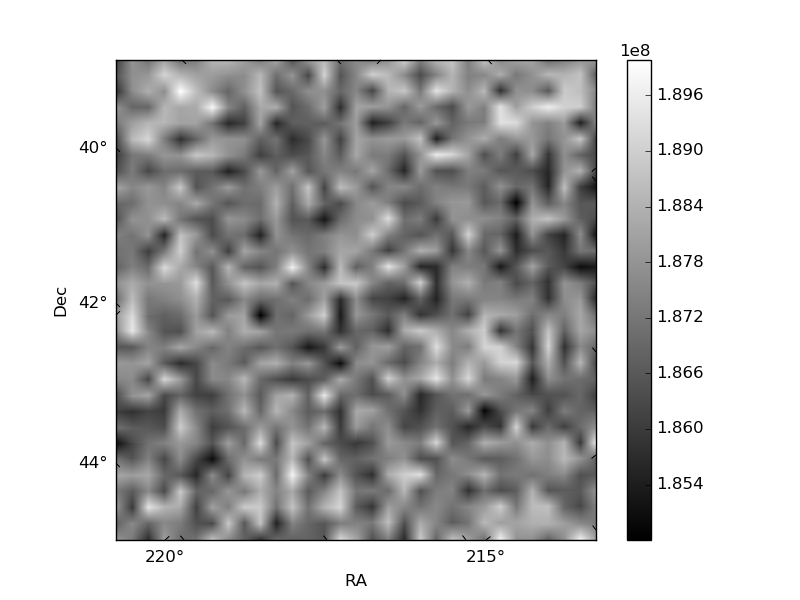
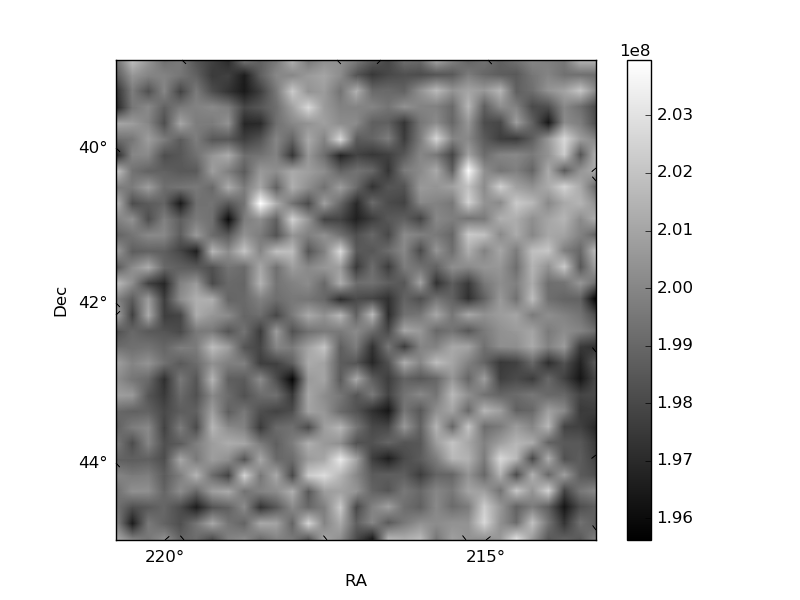
Histogram calculated using DETX and DETY for each event in the final _common_clean file
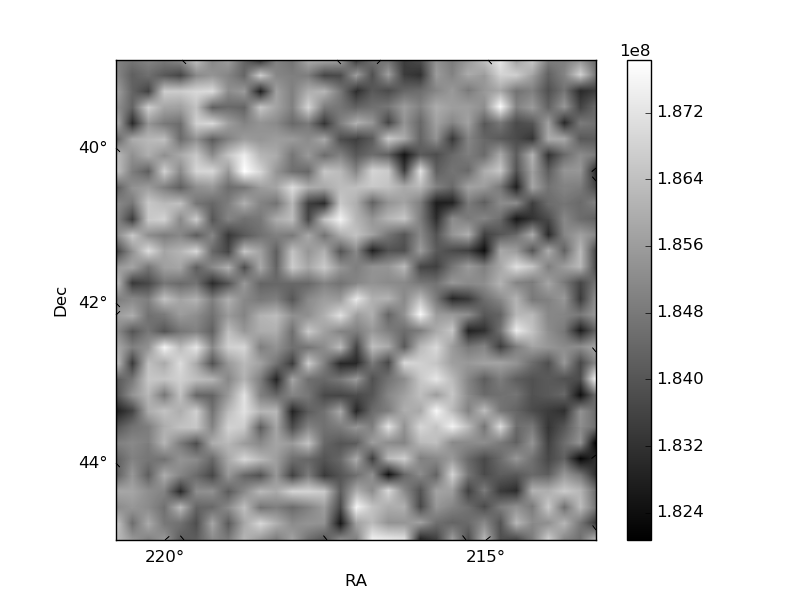
| Quadrant A | 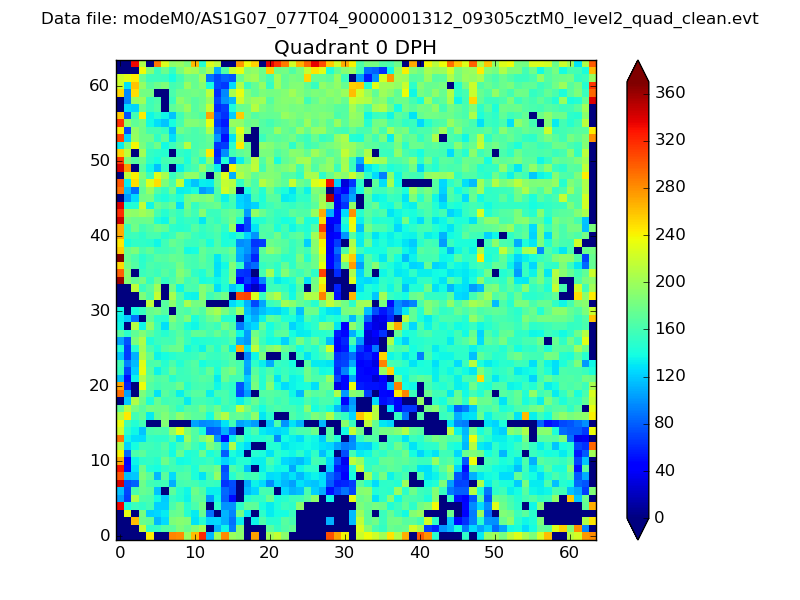 |
 |
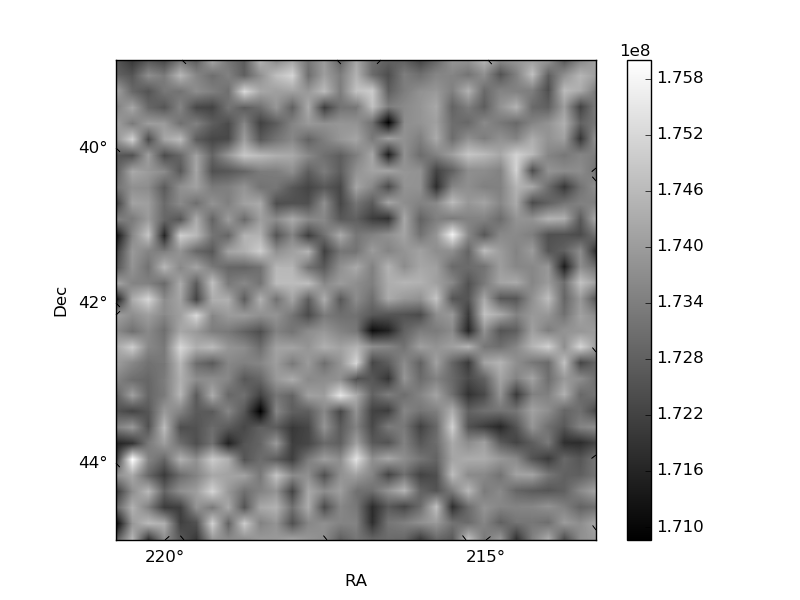
Quadrant B |
|---|---|---|---|
| Quadrant D | 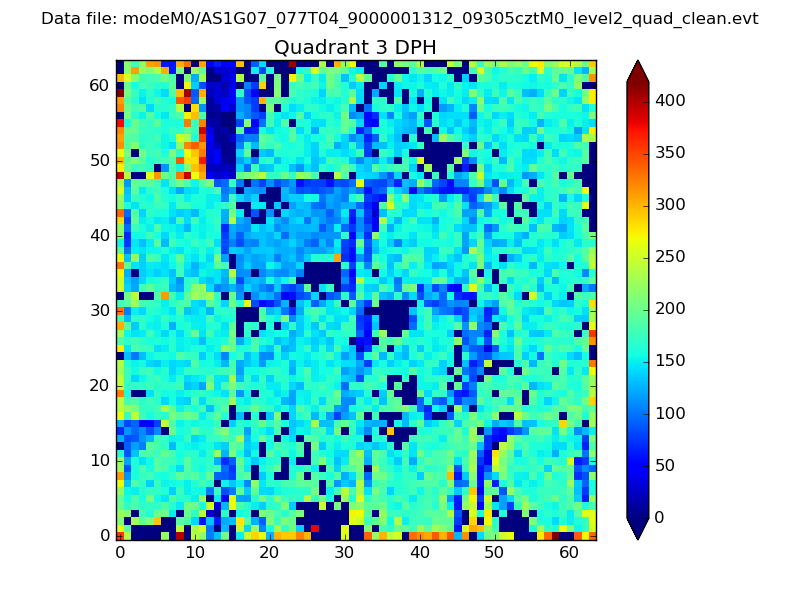 |
 |
Quadrant C |
| Plot type | Count rate plots | Images |
|---|---|---|
| Comparison with Poisson distribution Blue bars denote a histogram of data divided into 1 sec bins. Red curve is a Poisson curve with rate = median count rate of data. |
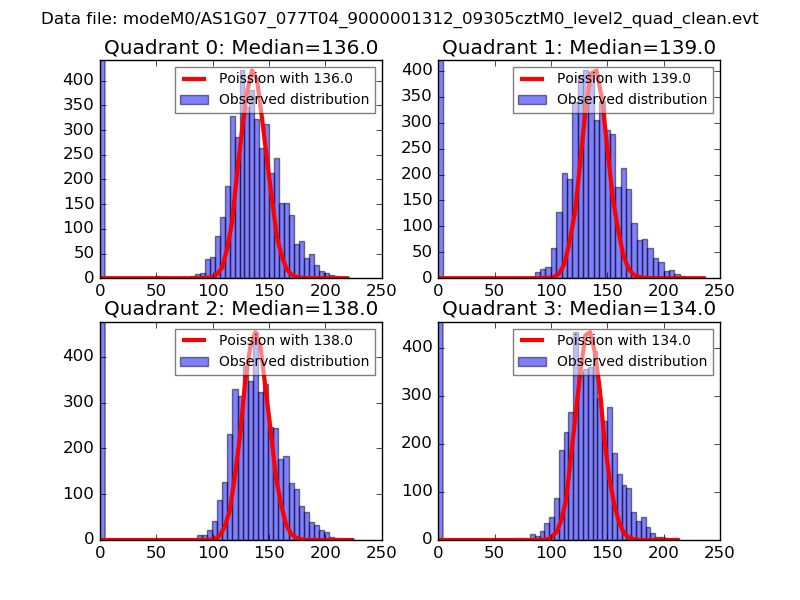 |
 |
| Quadrant-wise count rates Data is divided into 100 sec bins |
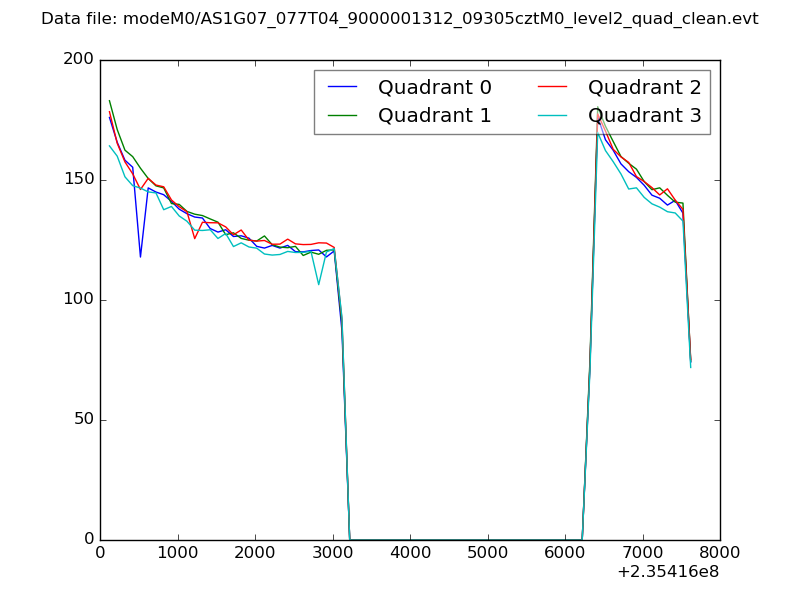 |
|
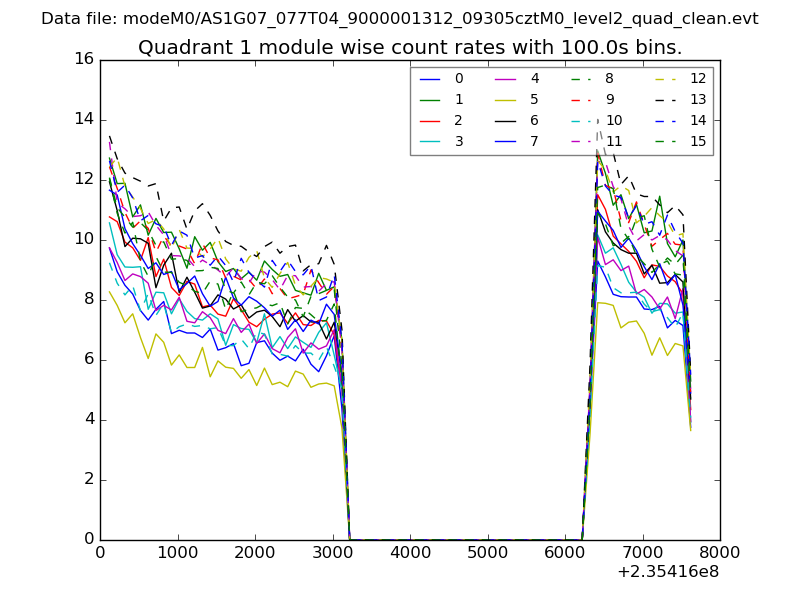
| Module-wise count rates for Quadrant A Data is divided into 100 sec bins |
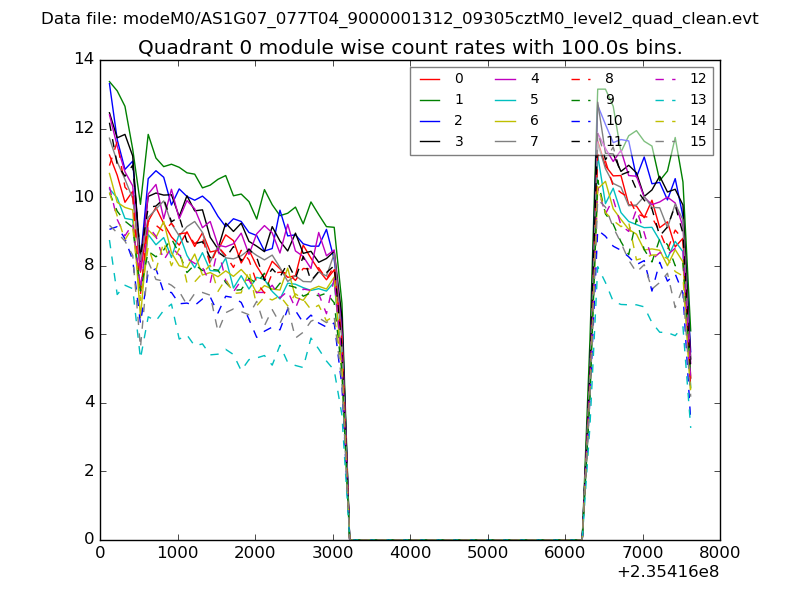 |
 |
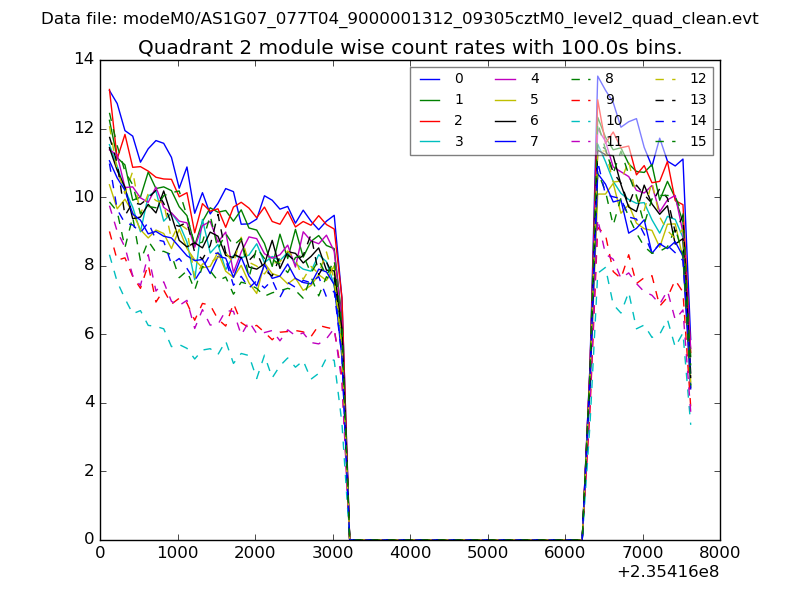
| Module-wise count rates for Quadrant B Data is divided into 100 sec bins |
 |
 |
| Module-wise count rates for Quadrant C Data is divided into 100 sec bins |
 |
 |
| Module-wise count rates for Quadrant D Data is divided into 100 sec bins |
 |
 |
| Parameter | Plot |
|---|---|
| CZT HV Monitor | 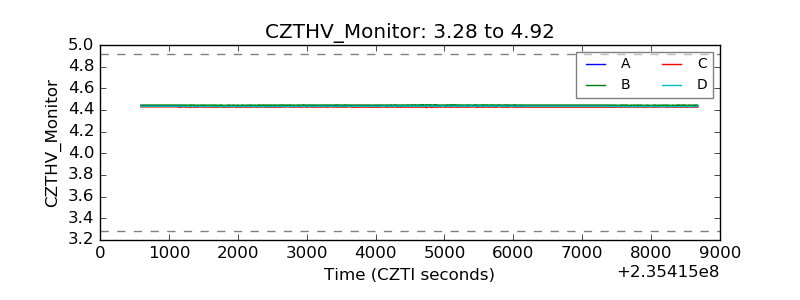 |
| D_VDD | 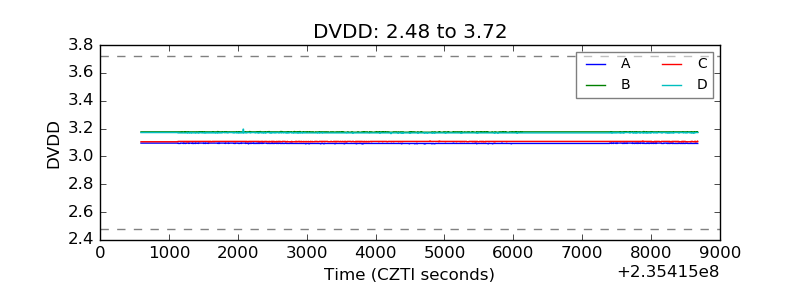 |
| Temperature 1 | 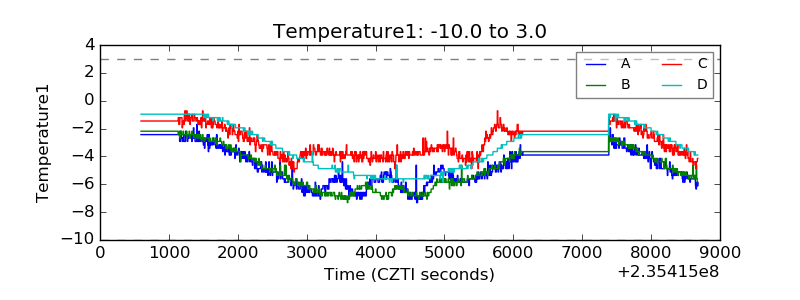 |
| Veto HV Monitor | 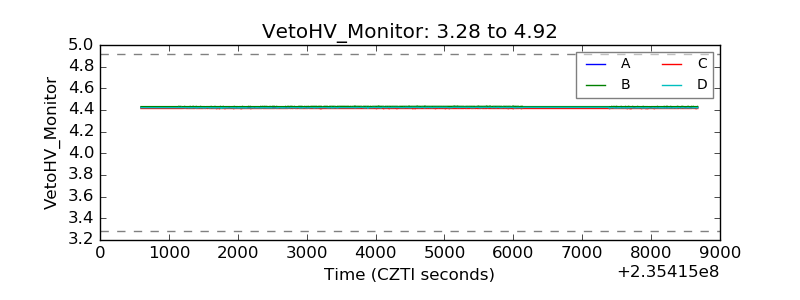 |
| Veto LLD | 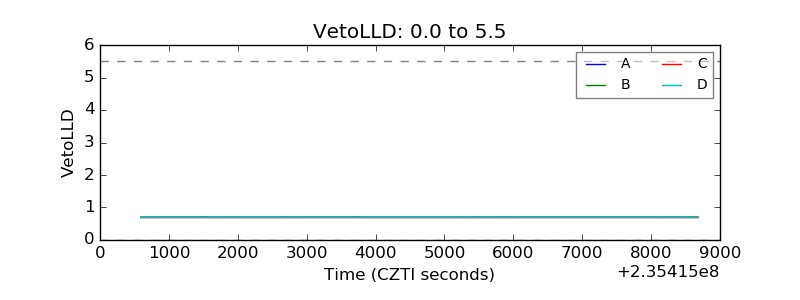 |
| Alpha Counter | 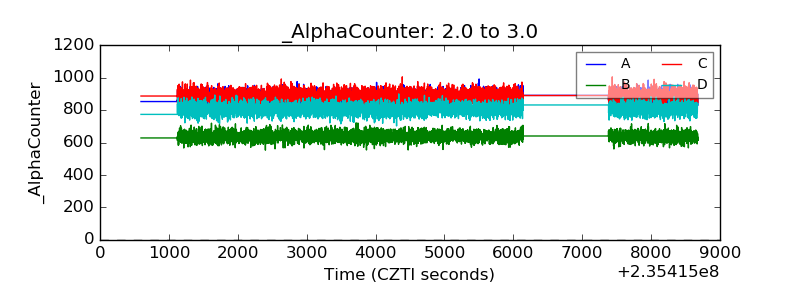 |
| _CPM_Rate | 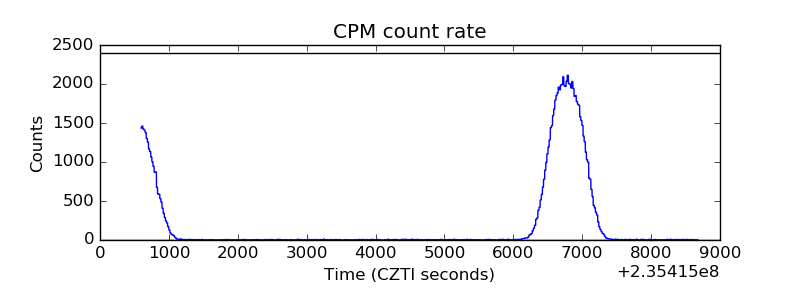 |
| CZT Counter | 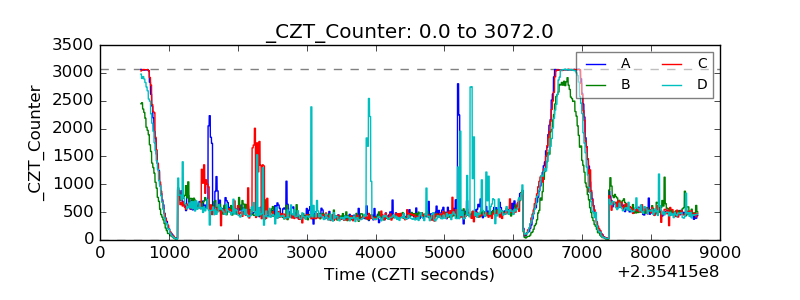 |
| +2.5 Volts monitor | 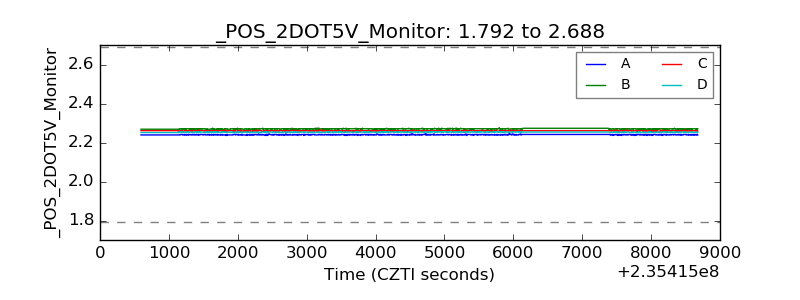 |
| +5 Volts monitor |  |
| _ROLL_ROT | 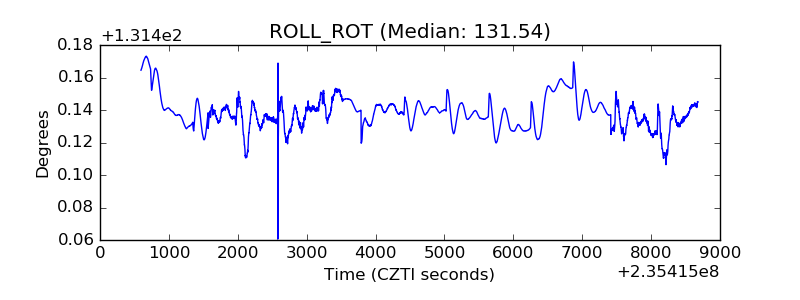 |
| _Roll_DEC | 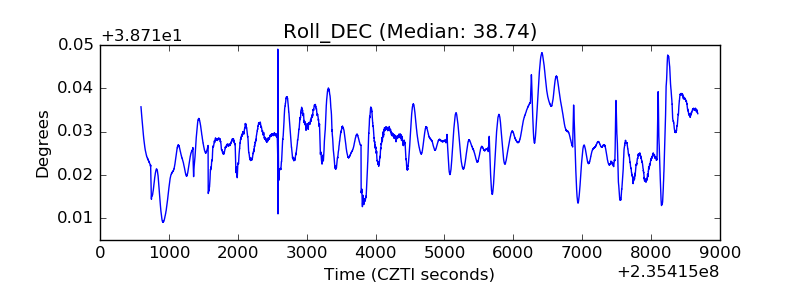 |
| _Roll_RA | 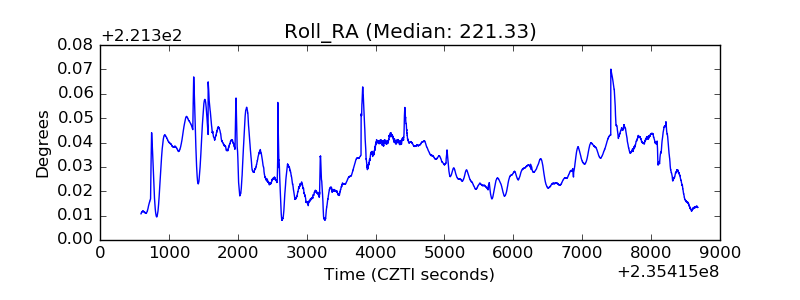 |
| Veto Counter | 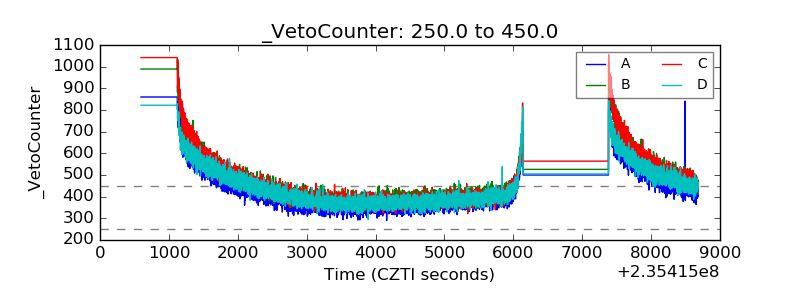 |