| Param | Original file | Final file |
|---|---|---|
| Filename | modeM0/AS1G07_077T04_9000001312_09306cztM0_level2.evt | modeM0/AS1G07_077T04_9000001312_09306cztM0_level2_quad_clean.evt |
| Size (bytes) | 115,551,360 | 34,989,120 |
| Size | 110.2 MB | 33.4 MB |
| Events in quadrant A | 812,939 | 236,186 |
| Events in quadrant B | 923,338 | 239,501 |
| Events in quadrant C | 826,806 | 239,594 |
| Events in quadrant D | 825,738 | 226,678 |
| Mode M9 | |||
|---|---|---|---|
| Quadrant | BADHDUFLAG | Total packets | Discarded packets |
| A | 0 | 1 | 0 |
| B | 0 | 1 | 0 |
| C | 0 | 1 | 0 |
| D | 0 | 2 | 0 |
| Mode SS | |||
|---|---|---|---|
| Quadrant | BADHDUFLAG | Total packets | Discarded packets |
| A | 0 | 32 | 0 |
| B | 0 | 32 | 0 |
| C | 0 | 32 | 2 |
| D | 0 | 32 | 0 |
| Mode M0 | |||
|---|---|---|---|
| Quadrant | BADHDUFLAG | Total packets | Discarded packets |
| A | 0 | 3423 | 12 |
| B | 0 | 3749 | 16 |
| C | 0 | 3445 | 7 |
| D | 0 | 3482 | 18 |
| Quadrant | Total seconds | Saturated seconds | Saturation percentage |
|---|---|---|---|
| A | 1590 | 4 | 0.251572% |
| B | 1589 | 10 | 0.629327% |
| C | 1592 | 1 | 0.062814% |
| D | 1588 | 1 | 0.062972% |
Noise dominated data is calculated using 1-second bins in cleaned event files. If a bin has >2000 counts, and if more than 50% of those come from <1% of pixels, then it is considered to be noise-dominated and hence unusable.
| Quadrant | # 1 sec bins | Bins with >0 counts | Bins with >2000 counts | High rate bins dominated by noise | Noise dominated (total time) | Noise dominated (detector-on time) | Marked lightcurve |
|---|---|---|---|---|---|---|---|
| A | 1595 | 1595 | 0 | 0 | 0.00% | 0.00% | 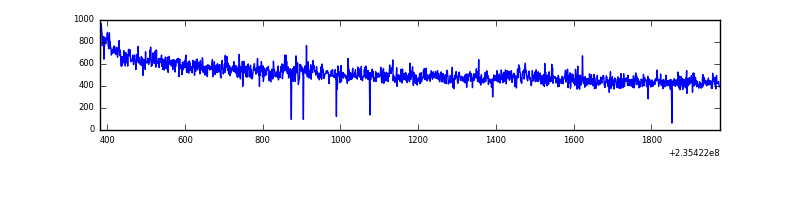 |
| B | 1595 | 1594 | 0 | 0 | 0.00% | 0.00% | 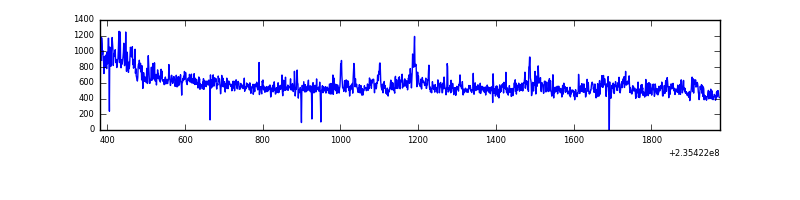 |
| C | 1595 | 1595 | 0 | 0 | 0.00% | 0.00% | 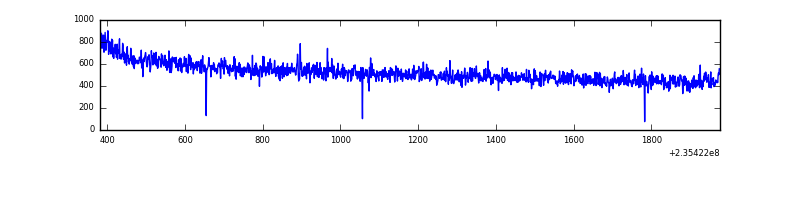 |
| D | 1595 | 1595 | 1 | 1 | 0.06% | 0.06% | 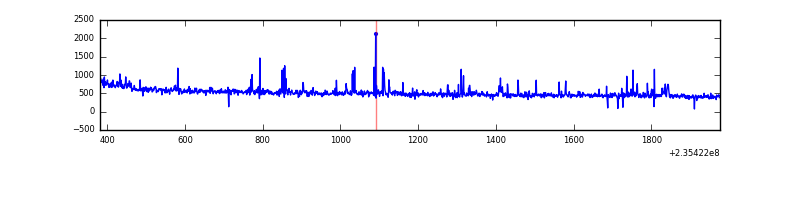 |
Top three noisy pixels from each quadrant. If the there are fewer than three noisy pixels in the level2.evt file, extra rows are filled as -1
| Pixel properties | Quadrant properties | ||||||
|---|---|---|---|---|---|---|---|
| Quadrant | DetID | PixID | Counts | Sigma | Mean | Median | Sigma |
| A | 8 | 5 | 9564 | 218.07 | 205 | 201 | 42.9 |
| A | 1 | 162 | 6536 | 147.54 | 205 | 201 | 42.9 |
| A | 1 | 178 | 1848 | 38.36 | 205 | 201 | 42.9 |
| B | 0 | 219 | 87116 | 2168.41 | 207 | 202 | 40.1 |
| B | 0 | 214 | 17337 | 427.5 | 207 | 202 | 40.1 |
| B | 10 | 245 | 4551 | 108.5 | 207 | 202 | 40.1 |
| C | 9 | 68 | 14740 | 294.91 | 208 | 210 | 49.3 |
| C | 13 | 61 | 1546 | 27.12 | 208 | 210 | 49.3 |
| C | 8 | 222 | 1141 | 18.9 | 208 | 210 | 49.3 |
| D | 1 | 52 | 16516 | 320.9 | 205 | 198 | 50.9 |
| D | 7 | 71 | 13066 | 253.06 | 205 | 198 | 50.9 |
| D | 12 | 233 | 12486 | 241.65 | 205 | 198 | 50.9 |
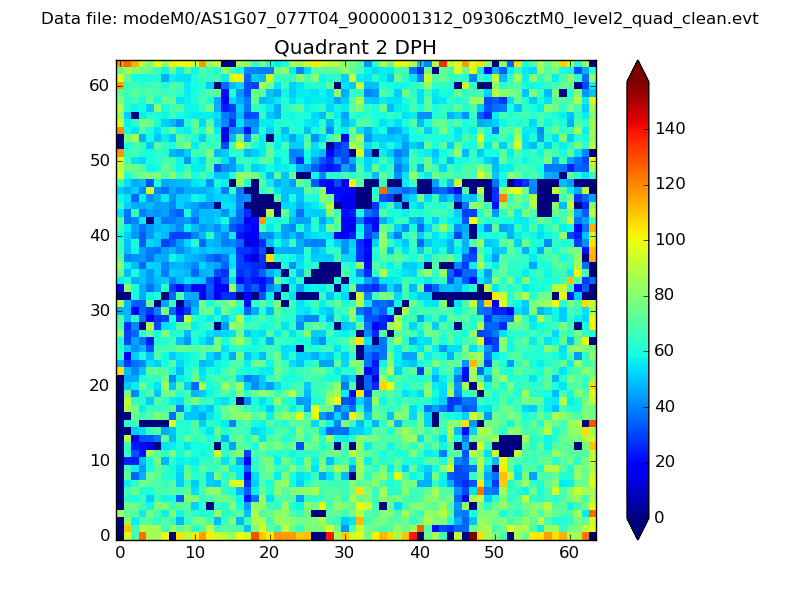
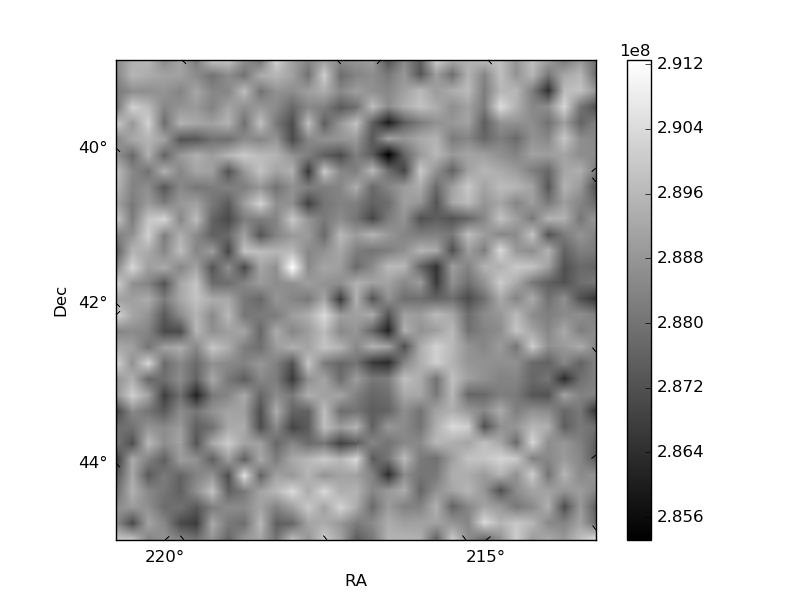
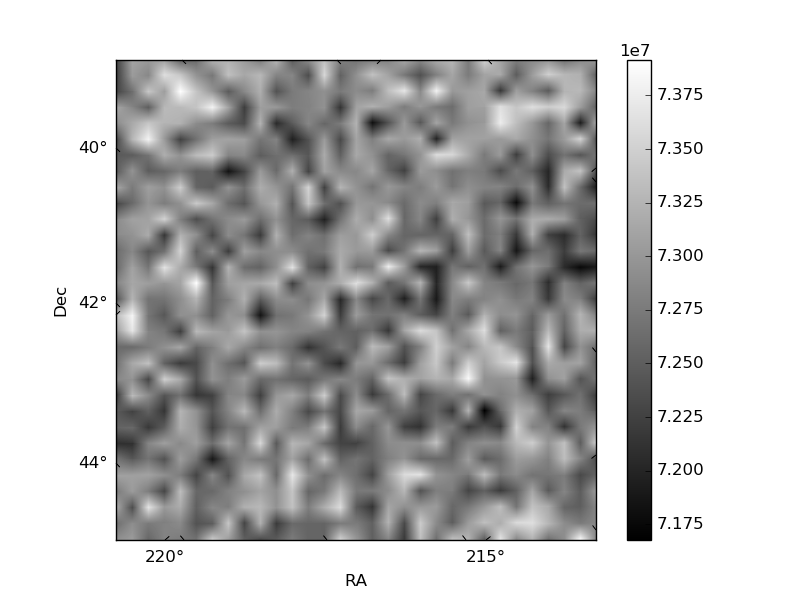
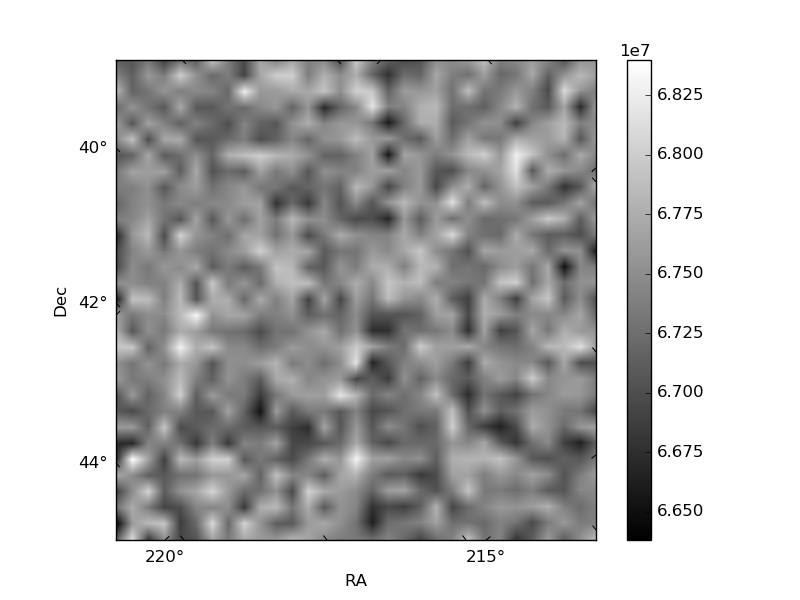
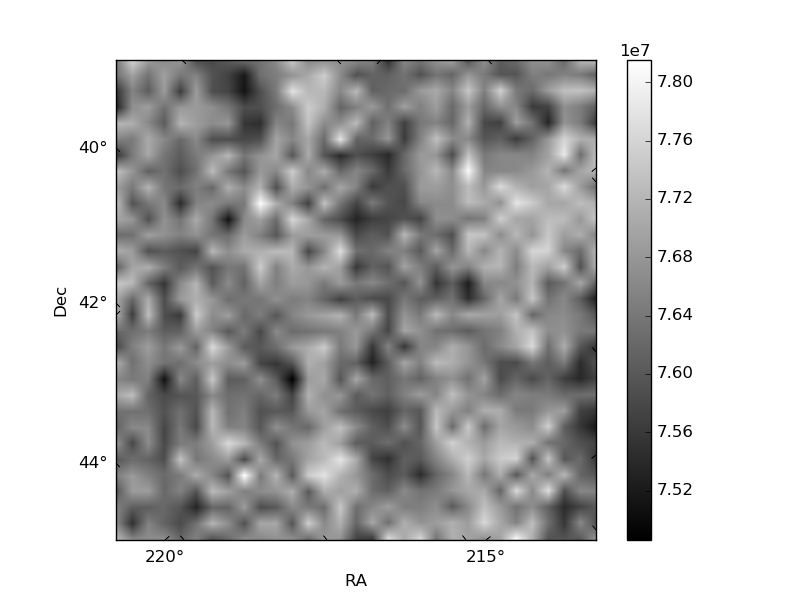
Histogram calculated using DETX and DETY for each event in the final _common_clean file
| Quadrant A | 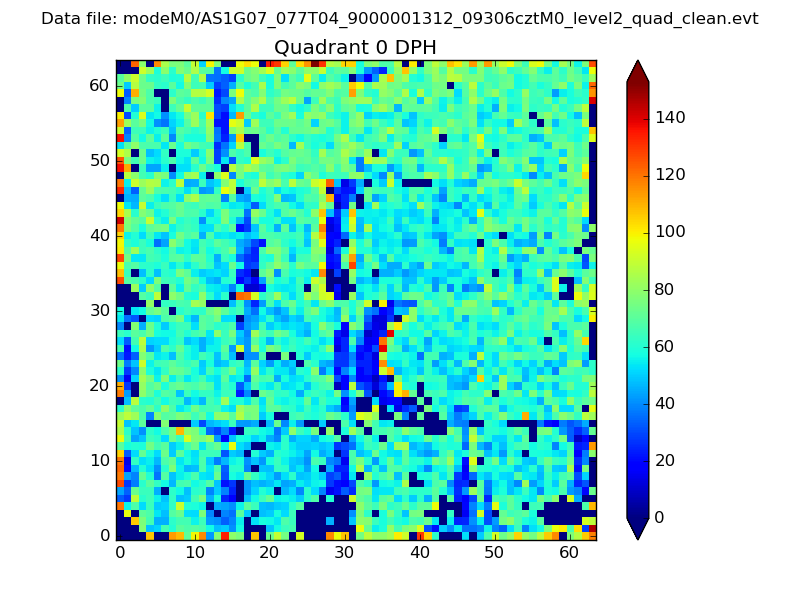 |
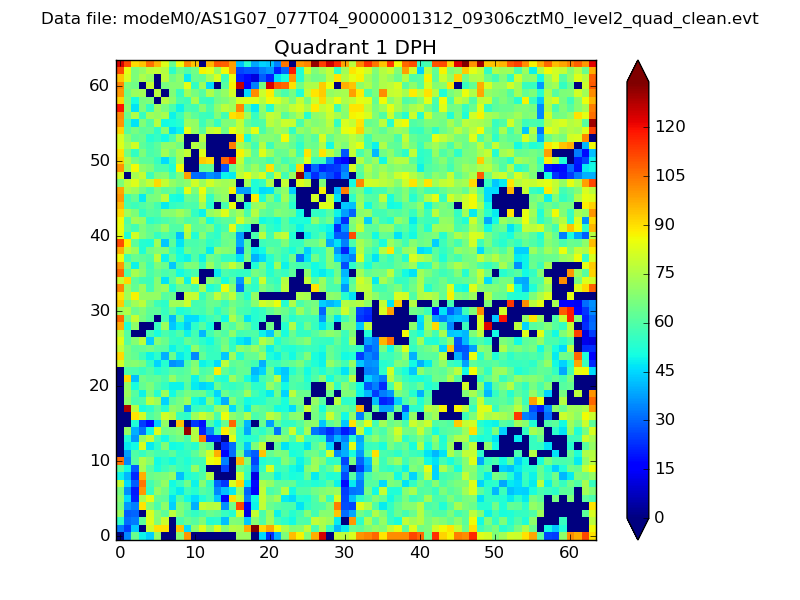 |
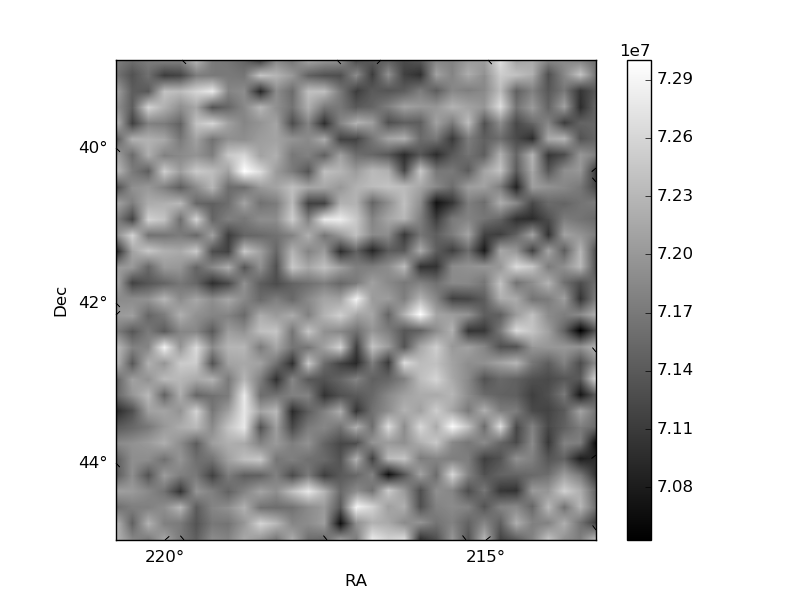
Quadrant B |
|---|---|---|---|
| Quadrant D | 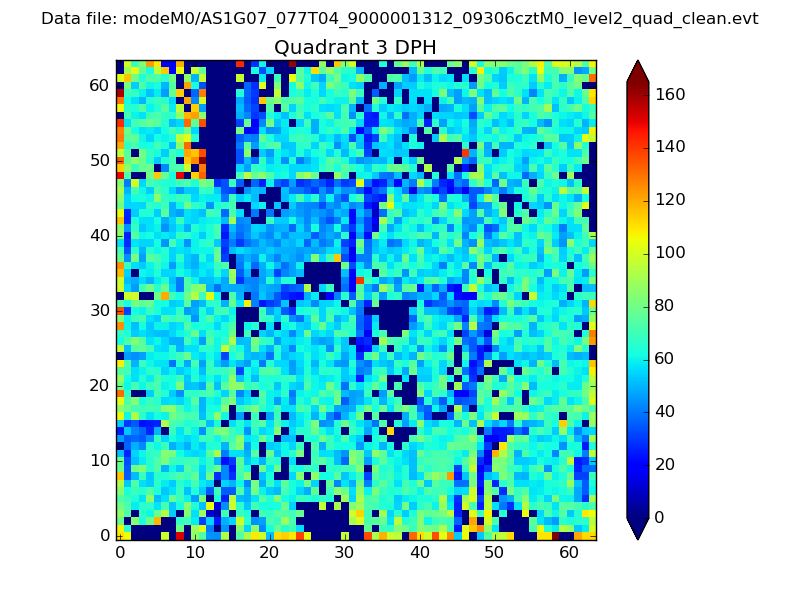 |
 |
Quadrant C |
| Plot type | Count rate plots | Images |
|---|---|---|
| Comparison with Poisson distribution Blue bars denote a histogram of data divided into 1 sec bins. Red curve is a Poisson curve with rate = median count rate of data. |
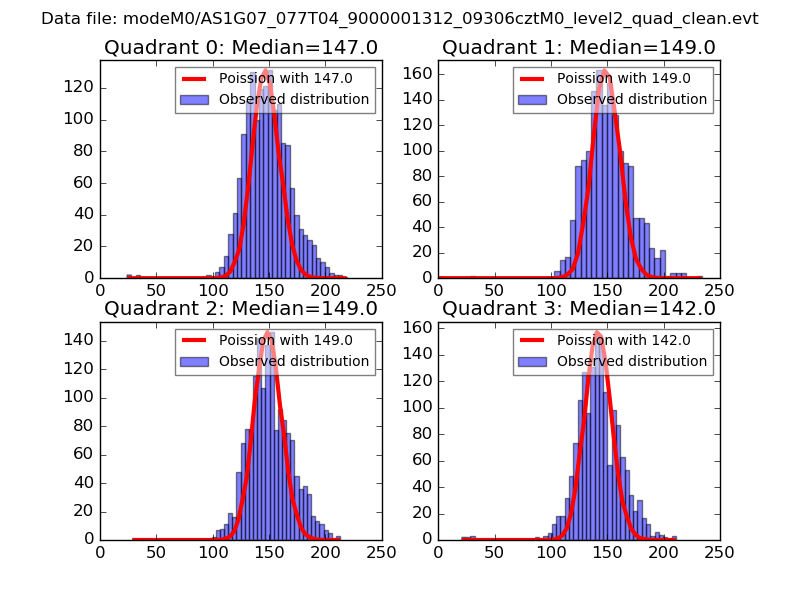 |
 |
| Quadrant-wise count rates Data is divided into 100 sec bins |
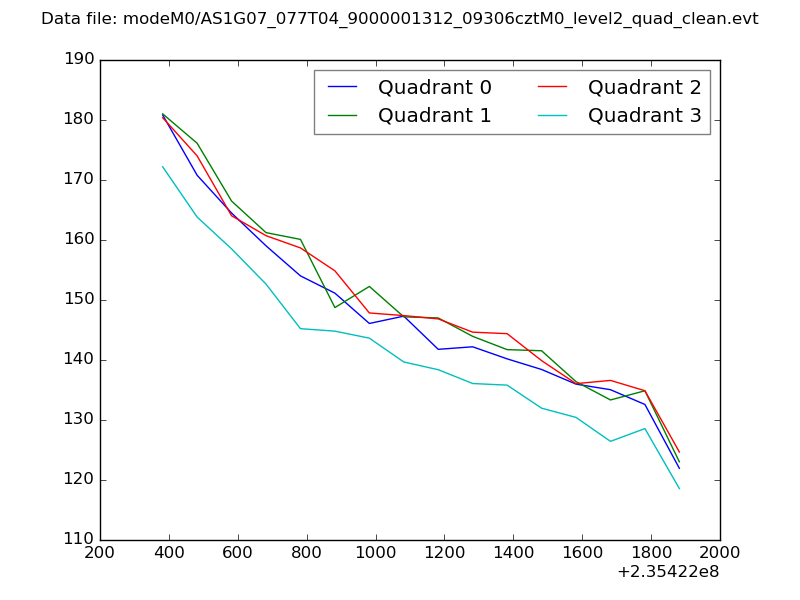 |
|
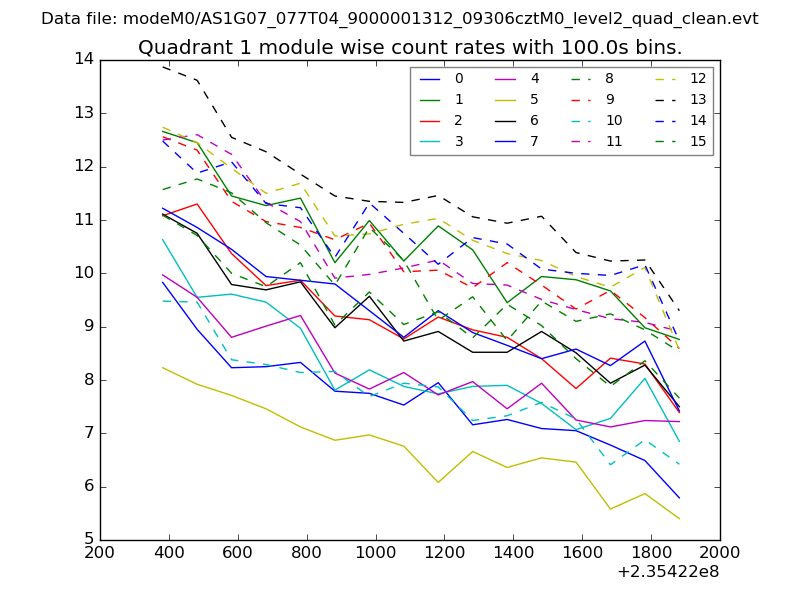
| Module-wise count rates for Quadrant A Data is divided into 100 sec bins |
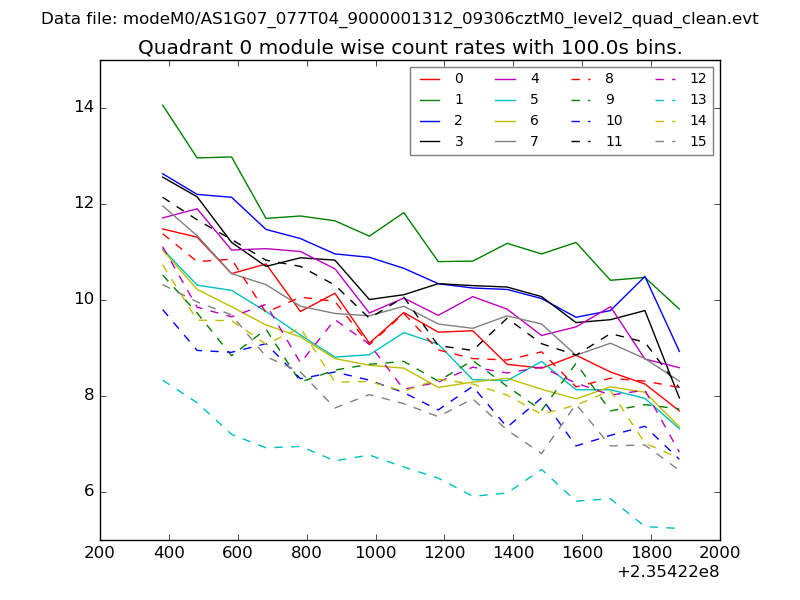 |
 |
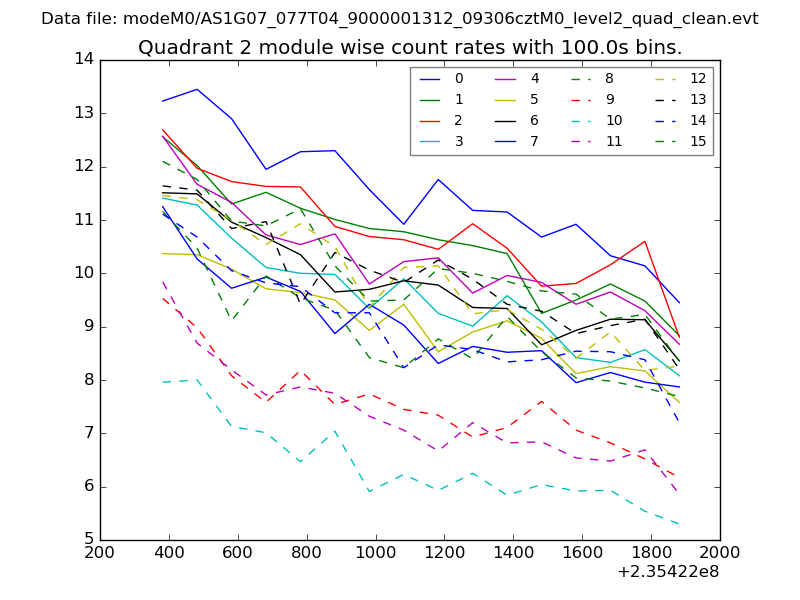
| Module-wise count rates for Quadrant B Data is divided into 100 sec bins |
 |
 |
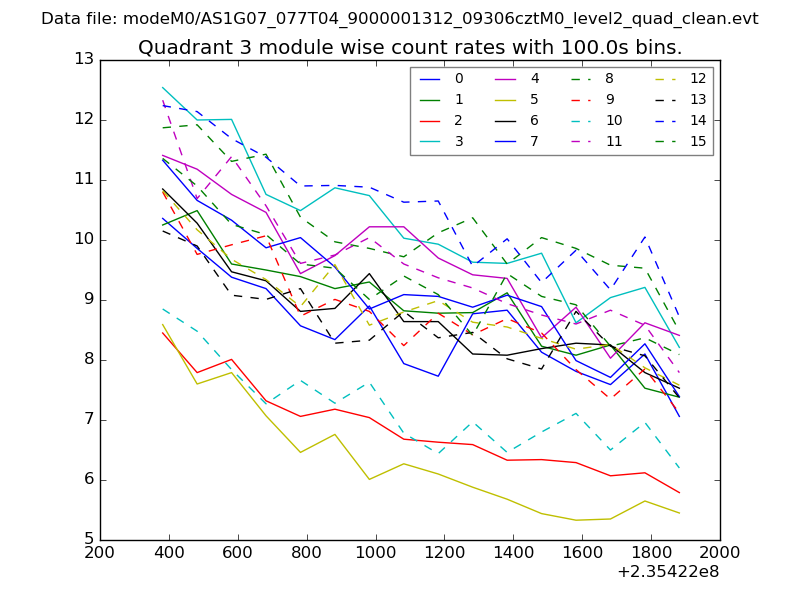
| Module-wise count rates for Quadrant C Data is divided into 100 sec bins |
 |
 |
| Module-wise count rates for Quadrant D Data is divided into 100 sec bins |
 |
 |
| Parameter | Plot |
|---|---|
| CZT HV Monitor | 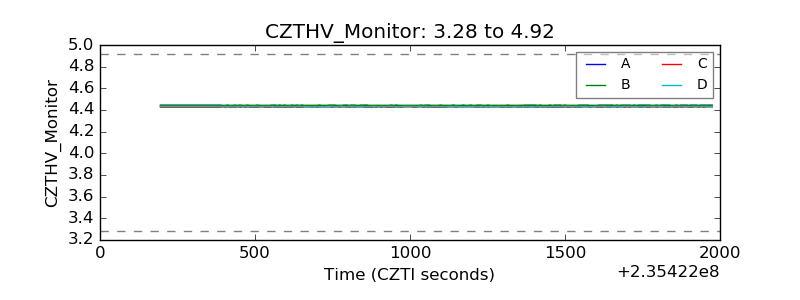 |
| D_VDD | 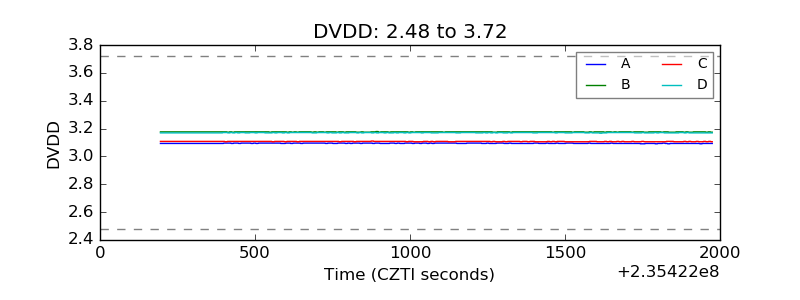 |
| Temperature 1 |  |
| Veto HV Monitor | 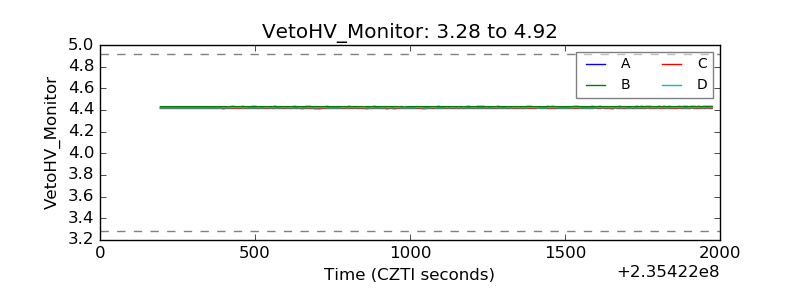 |
| Veto LLD | 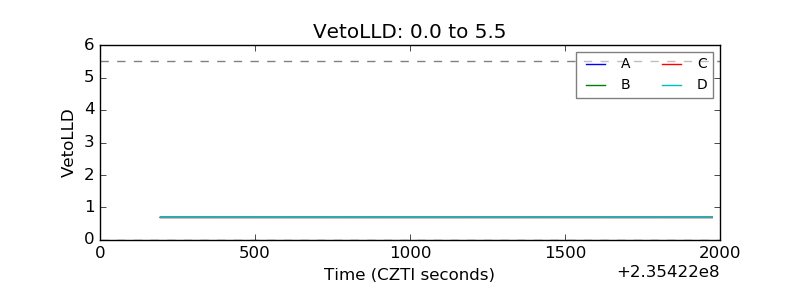 |
| Alpha Counter | 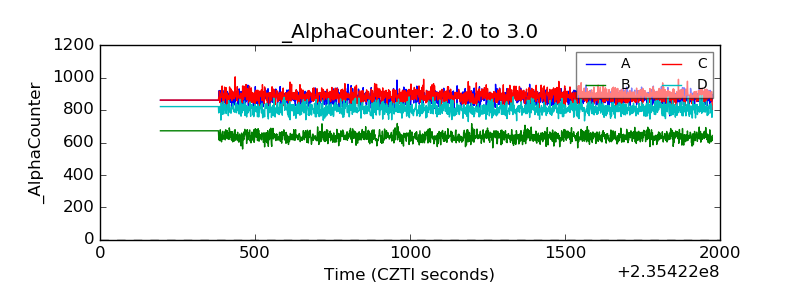 |
| _CPM_Rate | 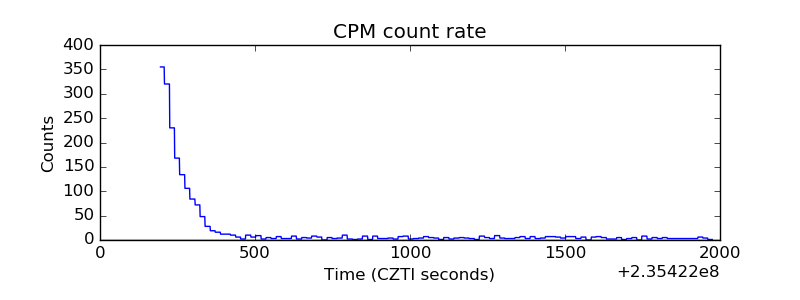 |
| CZT Counter | 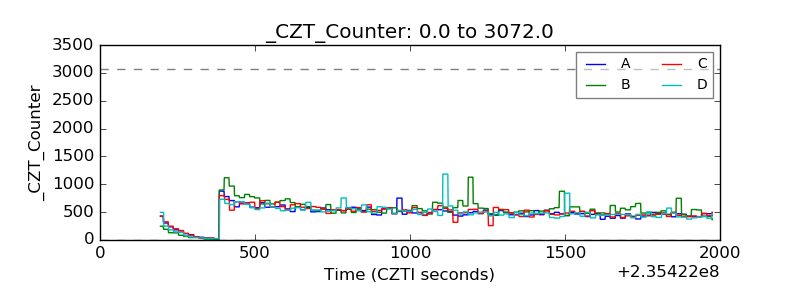 |
| +2.5 Volts monitor |  |
| +5 Volts monitor |  |
| _ROLL_ROT | 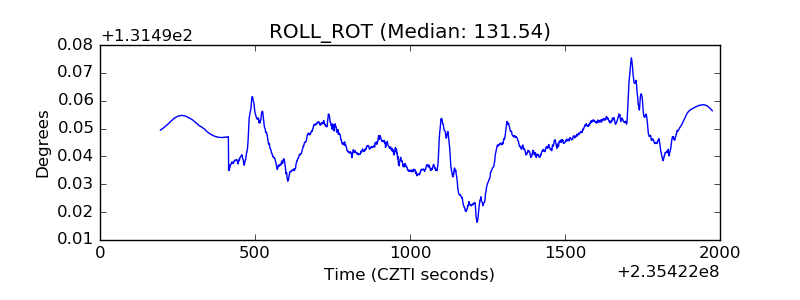 |
| _Roll_DEC | 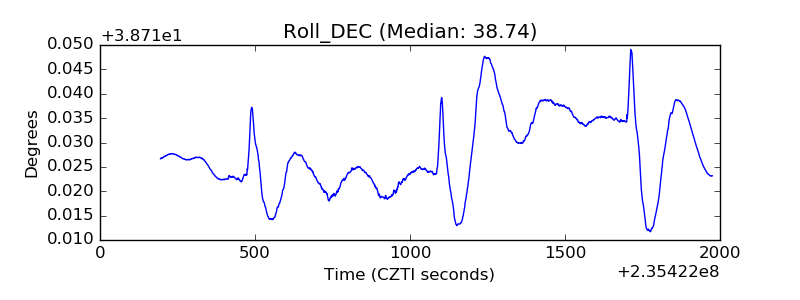 |
| _Roll_RA | 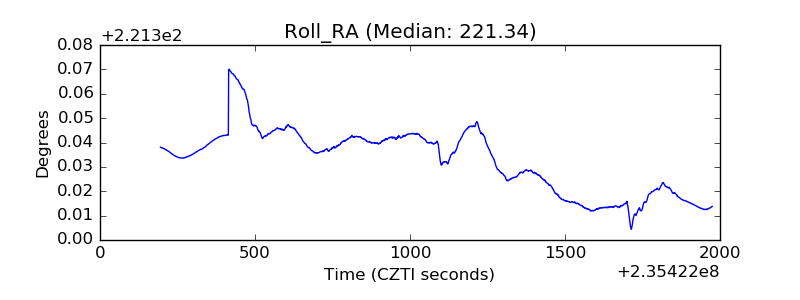 |
| Veto Counter | 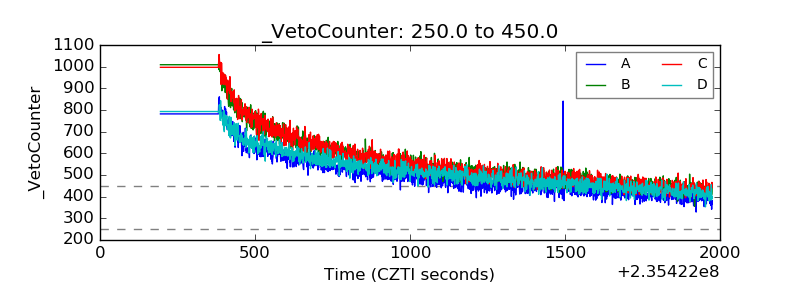 |