| Param | Original file | Final file |
|---|---|---|
| Filename | modeM0/AS1G07_077T04_9000001312_09309cztM0_level2.evt | modeM0/AS1G07_077T04_9000001312_09309cztM0_level2_quad_clean.evt |
| Size (bytes) | 115,986,240 | 35,095,680 |
| Size | 110.6 MB | 33.5 MB |
| Events in quadrant A | 815,620 | 236,934 |
| Events in quadrant B | 927,468 | 240,509 |
| Events in quadrant C | 828,386 | 240,067 |
| Events in quadrant D | 829,966 | 227,377 |
| Mode M9 | |||
|---|---|---|---|
| Quadrant | BADHDUFLAG | Total packets | Discarded packets |
| A | 0 | 1 | 0 |
| B | 0 | 1 | 0 |
| C | 0 | 1 | 0 |
| D | 0 | 2 | 0 |
| Mode SS | |||
|---|---|---|---|
| Quadrant | BADHDUFLAG | Total packets | Discarded packets |
| A | 0 | 32 | 0 |
| B | 0 | 32 | 0 |
| C | 0 | 32 | 0 |
| D | 0 | 32 | 0 |
| Mode M0 | |||
|---|---|---|---|
| Quadrant | BADHDUFLAG | Total packets | Discarded packets |
| A | 0 | 3423 | 1 |
| B | 0 | 3749 | 1 |
| C | 0 | 3445 | 1 |
| D | 0 | 3482 | 1 |
| Quadrant | Total seconds | Saturated seconds | Saturation percentage |
|---|---|---|---|
| A | 1595 | 4 | 0.250784% |
| B | 1595 | 10 | 0.626959% |
| C | 1595 | 1 | 0.062696% |
| D | 1595 | 1 | 0.062696% |
Noise dominated data is calculated using 1-second bins in cleaned event files. If a bin has >2000 counts, and if more than 50% of those come from <1% of pixels, then it is considered to be noise-dominated and hence unusable.
| Quadrant | # 1 sec bins | Bins with >0 counts | Bins with >2000 counts | High rate bins dominated by noise | Noise dominated (total time) | Noise dominated (detector-on time) | Marked lightcurve |
|---|---|---|---|---|---|---|---|
| A | 1595 | 1595 | 0 | 0 | 0.00% | 0.00% | 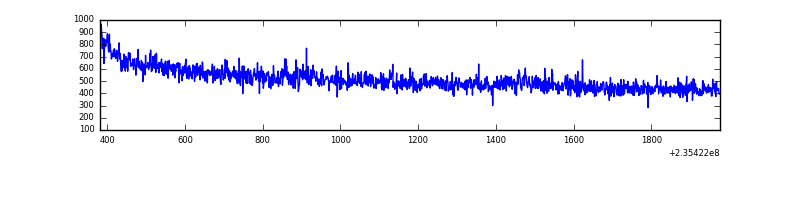 |
| B | 1595 | 1595 | 0 | 0 | 0.00% | 0.00% | 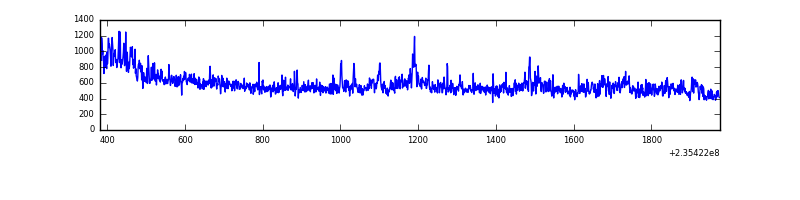 |
| C | 1595 | 1595 | 0 | 0 | 0.00% | 0.00% |  |
| D | 1595 | 1595 | 1 | 1 | 0.06% | 0.06% | 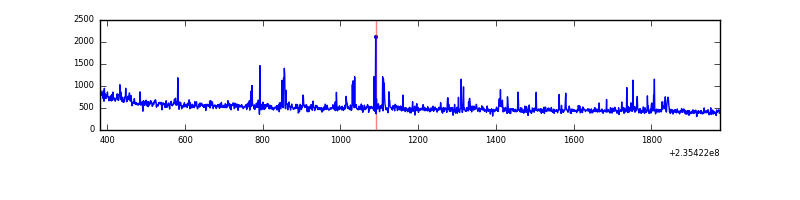 |
Top three noisy pixels from each quadrant. If the there are fewer than three noisy pixels in the level2.evt file, extra rows are filled as -1
| Pixel properties | Quadrant properties | ||||||
|---|---|---|---|---|---|---|---|
| Quadrant | DetID | PixID | Counts | Sigma | Mean | Median | Sigma |
| A | 8 | 5 | 9603 | 218.37 | 206 | 202 | 43.1 |
| A | 1 | 162 | 6557 | 147.62 | 206 | 202 | 43.1 |
| A | 1 | 178 | 1852 | 38.33 | 206 | 202 | 43.1 |
| B | 0 | 219 | 87322 | 2166.4 | 208 | 203 | 40.2 |
| B | 0 | 214 | 17892 | 439.87 | 208 | 203 | 40.2 |
| B | 10 | 245 | 4560 | 108.35 | 208 | 203 | 40.2 |
| C | 9 | 68 | 14782 | 295.21 | 208 | 210 | 49.4 |
| C | 13 | 61 | 1547 | 27.09 | 208 | 210 | 49.4 |
| C | 8 | 222 | 1142 | 18.88 | 208 | 210 | 49.4 |
| D | 1 | 52 | 16522 | 319.85 | 206 | 199 | 51.0 |
| D | 7 | 71 | 13405 | 258.78 | 206 | 199 | 51.0 |
| D | 12 | 233 | 12488 | 240.81 | 206 | 199 | 51.0 |
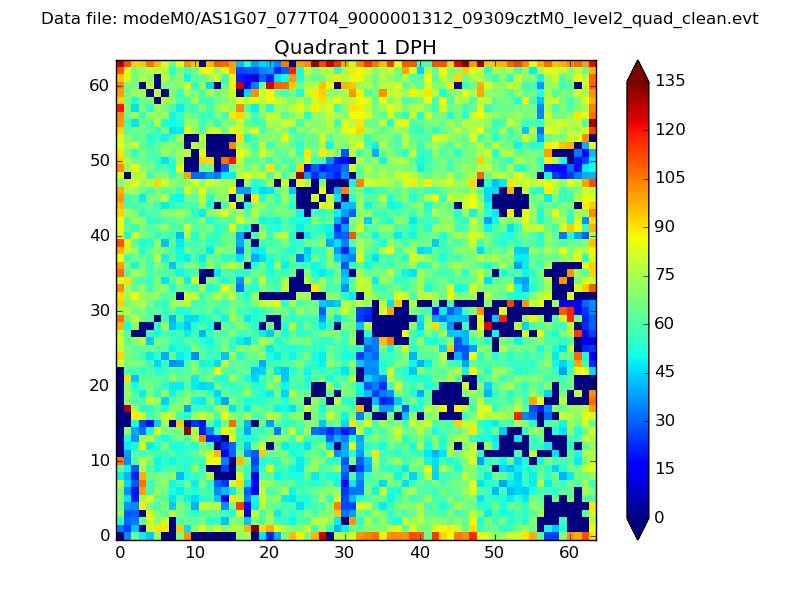
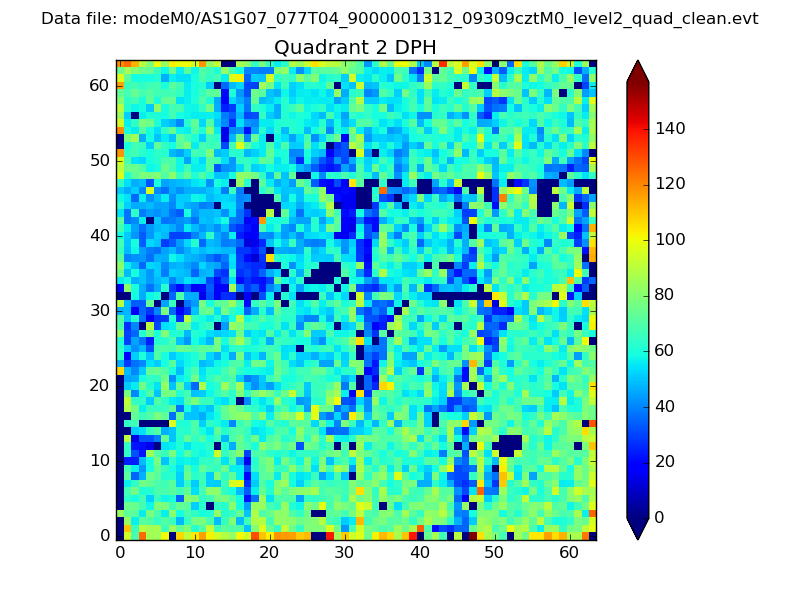
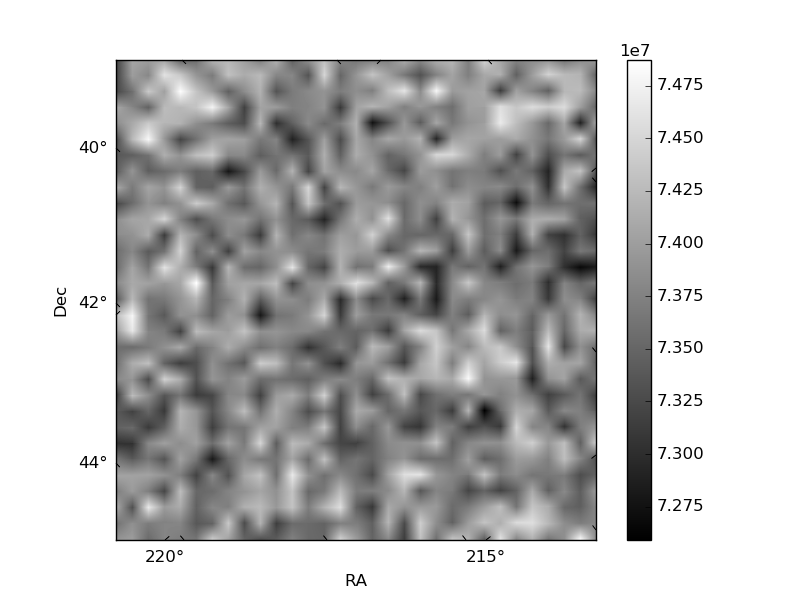
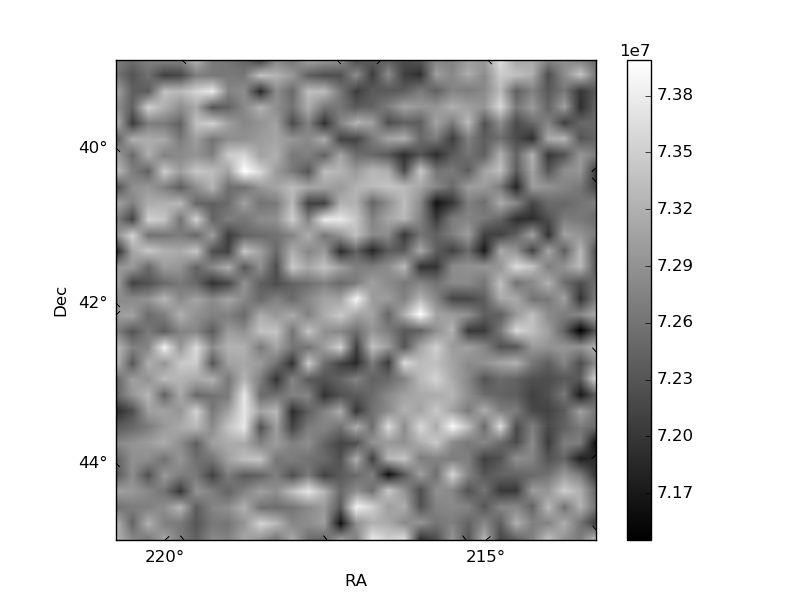
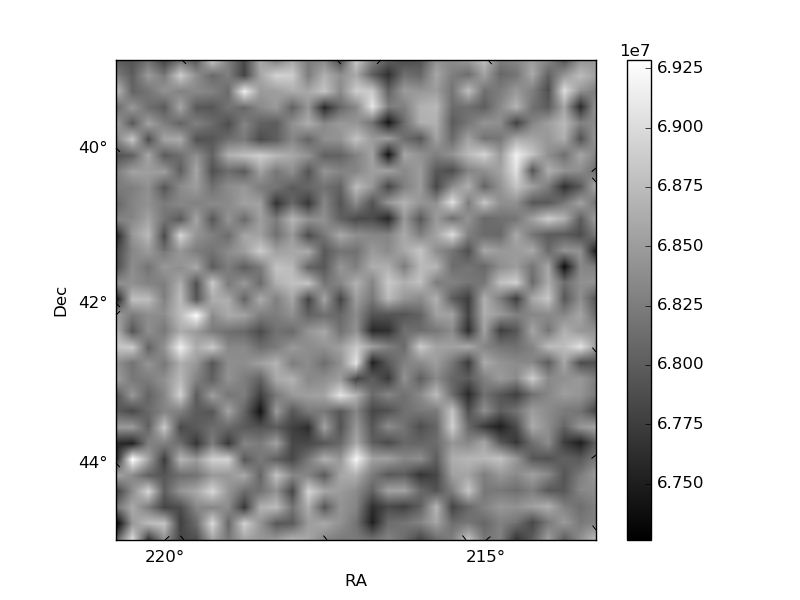
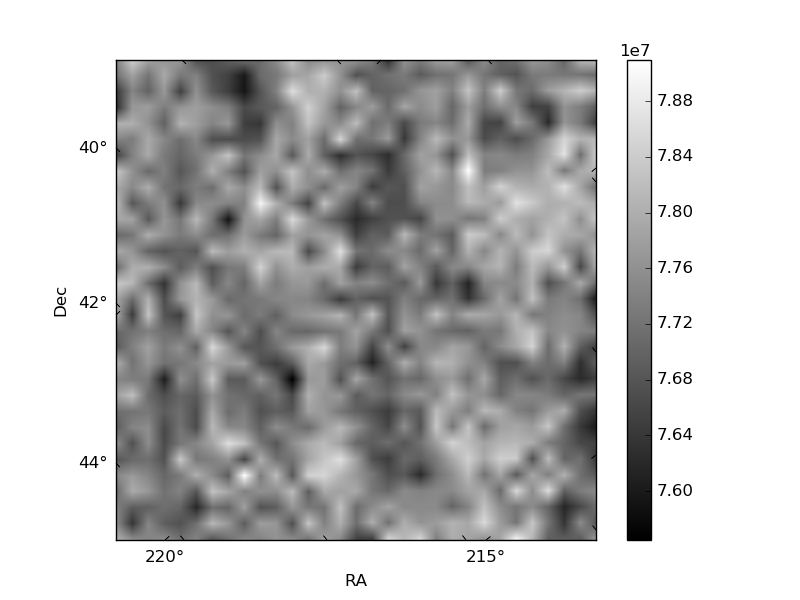
Histogram calculated using DETX and DETY for each event in the final _common_clean file
| Quadrant A | 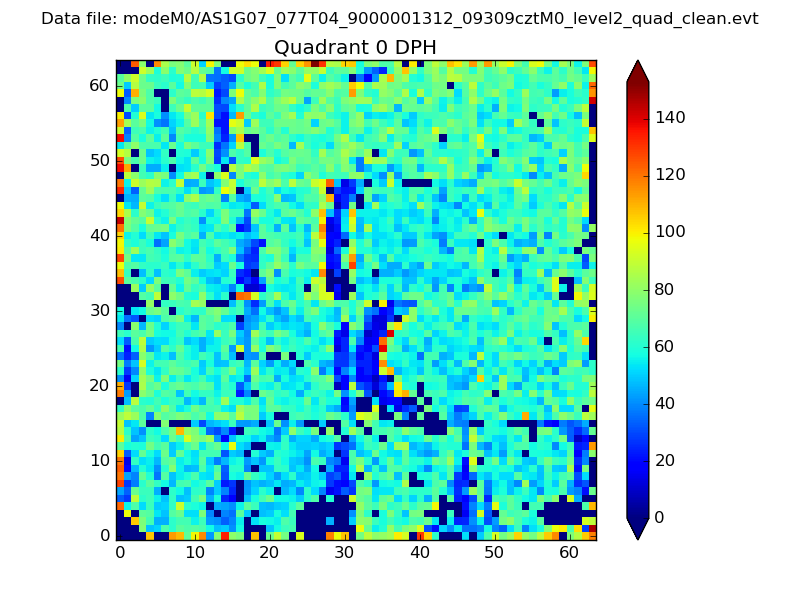 |
 |
Quadrant B |
|---|---|---|---|
| Quadrant D | 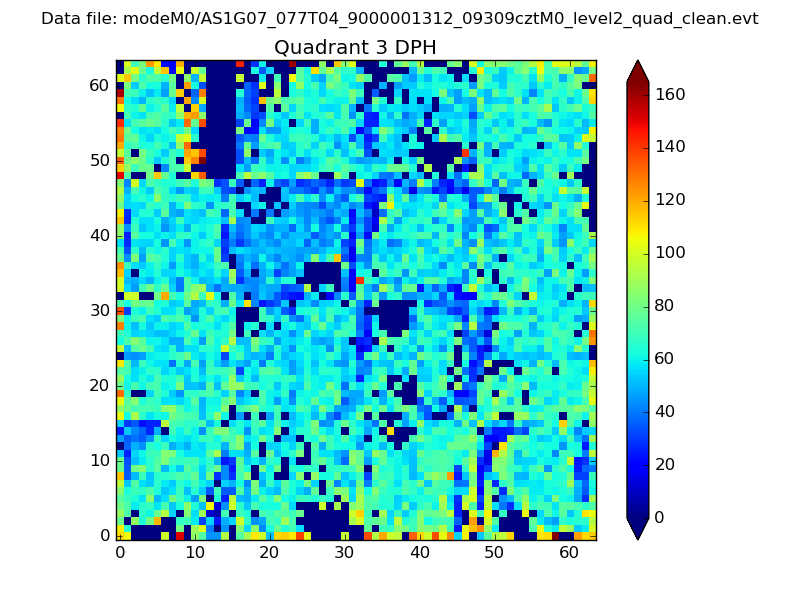 |
 |
Quadrant C |
| Plot type | Count rate plots | Images |
|---|---|---|
| Comparison with Poisson distribution Blue bars denote a histogram of data divided into 1 sec bins. Red curve is a Poisson curve with rate = median count rate of data. |
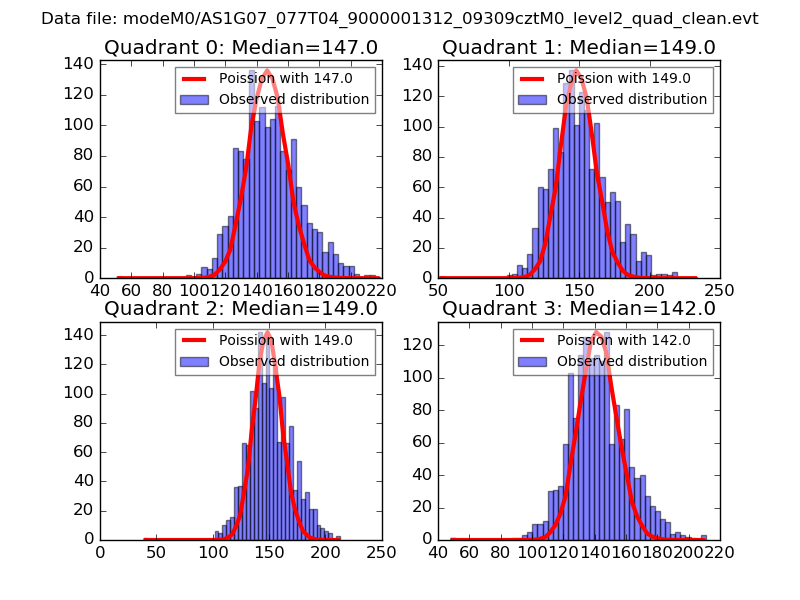 |
 |
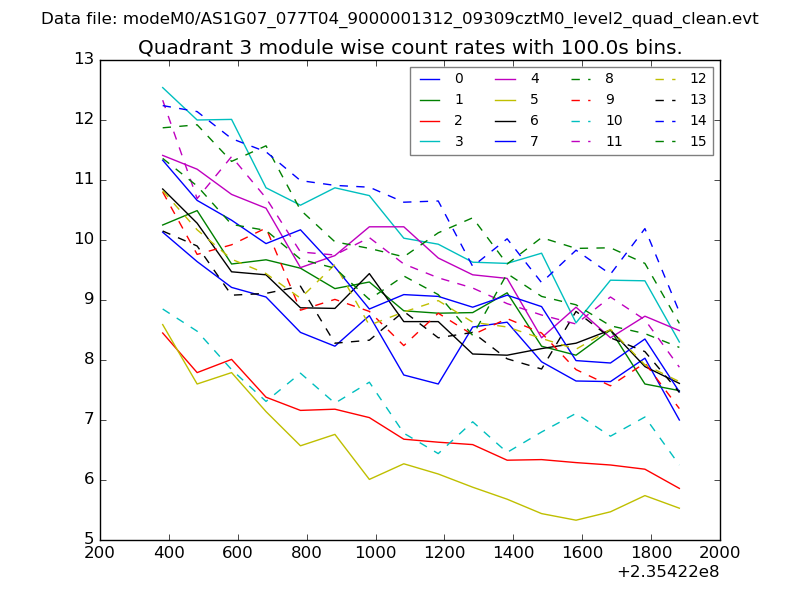
| Quadrant-wise count rates Data is divided into 100 sec bins |
 |
|
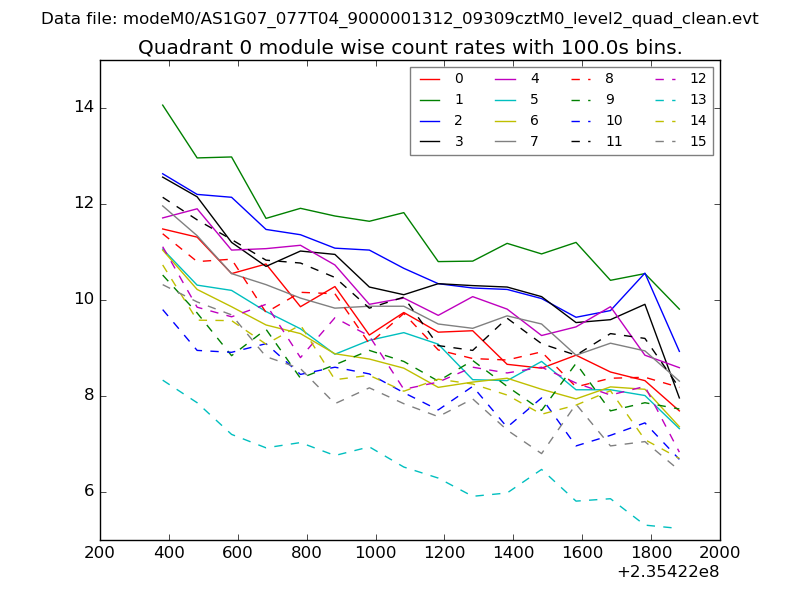
| Module-wise count rates for Quadrant A Data is divided into 100 sec bins |
 |
 |
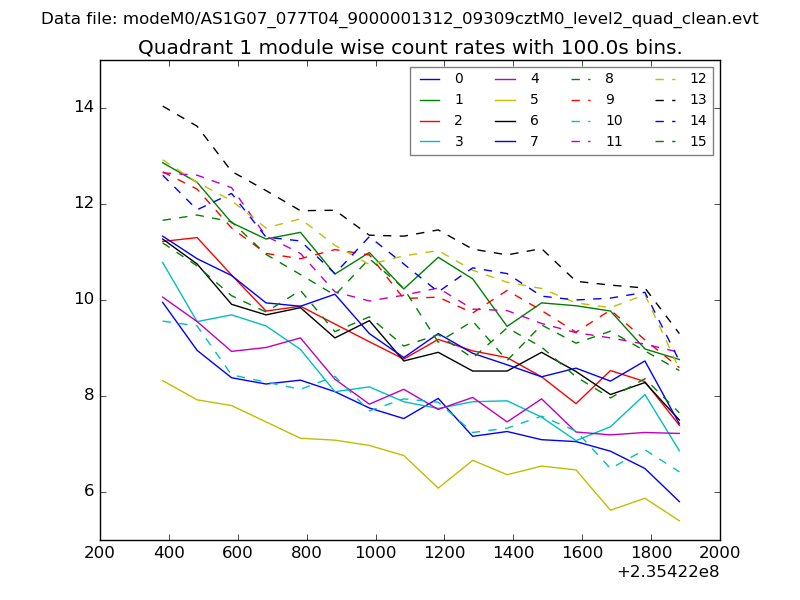
| Module-wise count rates for Quadrant B Data is divided into 100 sec bins |
 |
 |
| Module-wise count rates for Quadrant C Data is divided into 100 sec bins |
 |
 |
| Module-wise count rates for Quadrant D Data is divided into 100 sec bins |
 |
 |
| Parameter | Plot |
|---|---|
| CZT HV Monitor | 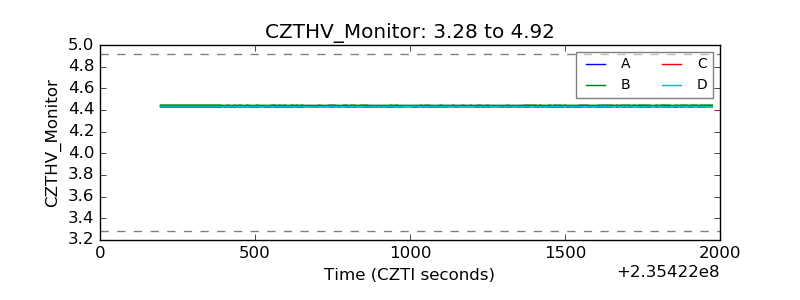 |
| D_VDD |  |
| Temperature 1 | 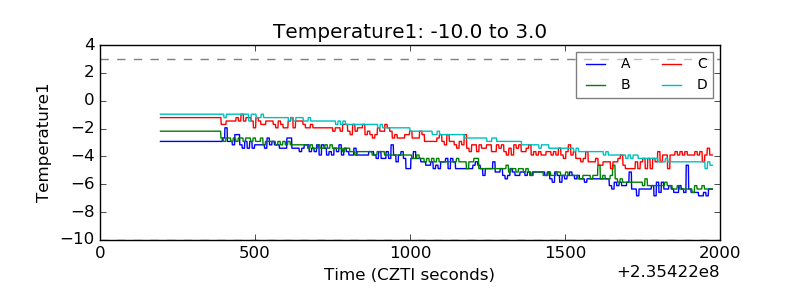 |
| Veto HV Monitor | 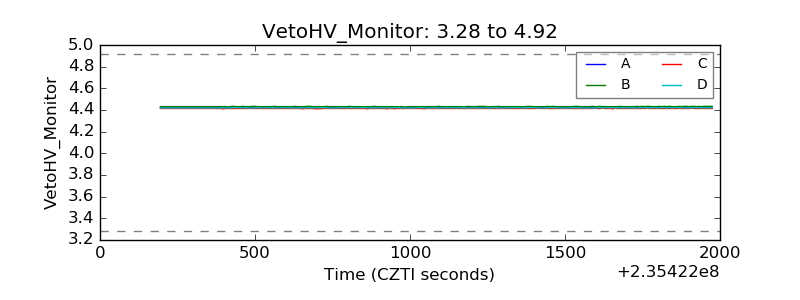 |
| Veto LLD | 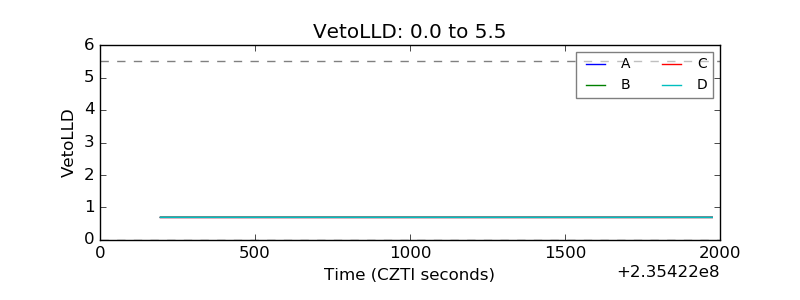 |
| Alpha Counter | 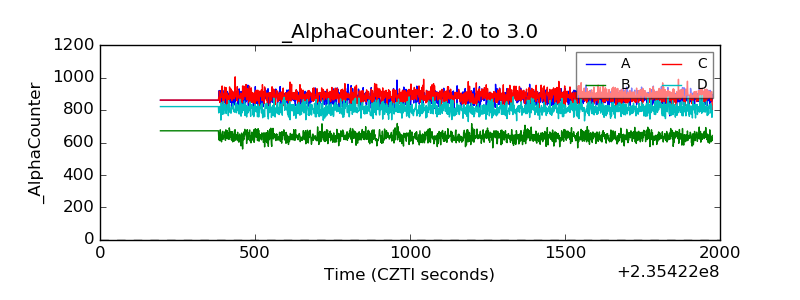 |
| _CPM_Rate | 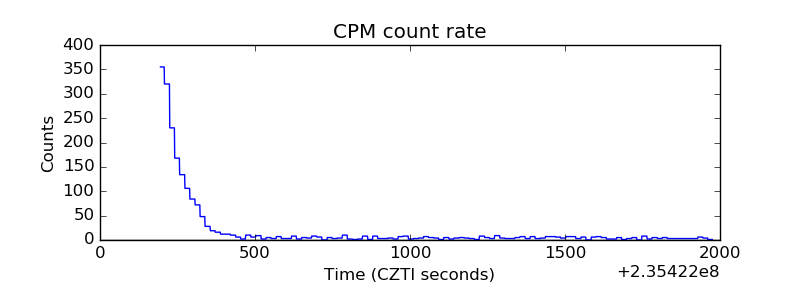 |
| CZT Counter | 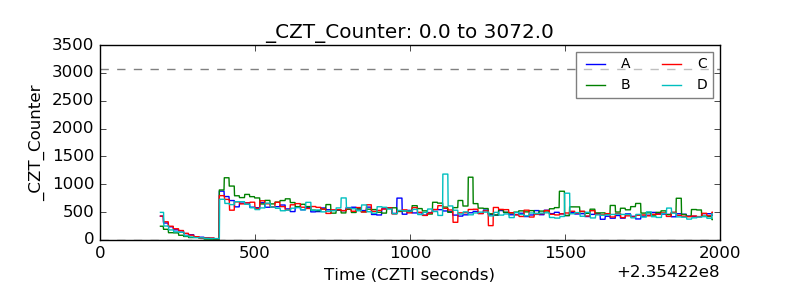 |
| +2.5 Volts monitor |  |
| +5 Volts monitor | 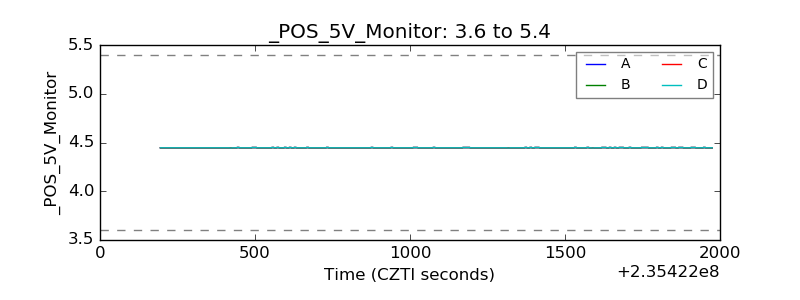 |
| _ROLL_ROT | 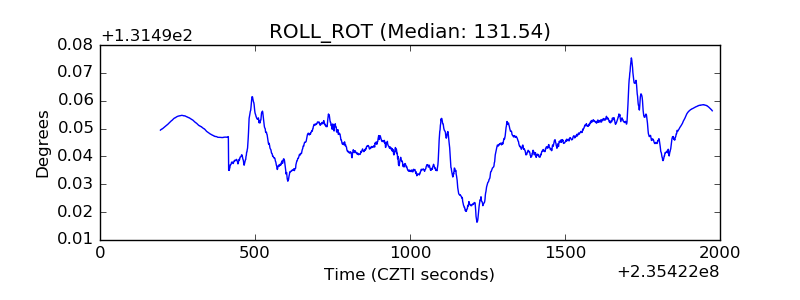 |
| _Roll_DEC | 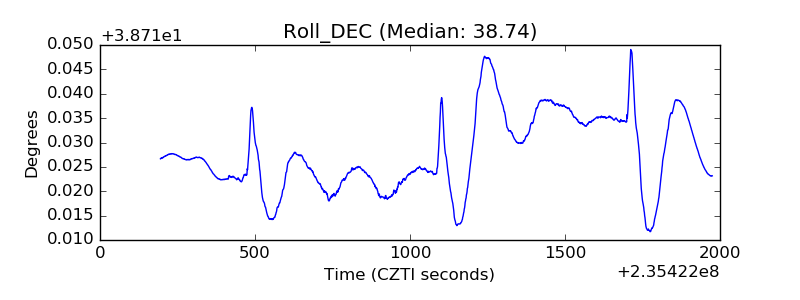 |
| _Roll_RA |  |
| Veto Counter | 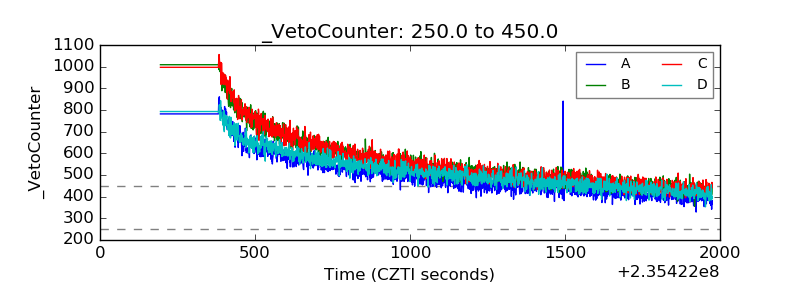 |