| Param | Original file | Final file |
|---|---|---|
| Filename | modeM0/AS1G07_002T01_9000001316_09311cztM0_level2.evt | modeM0/AS1G07_002T01_9000001316_09311cztM0_level2_quad_clean.evt |
| Size (bytes) | 155,096,640 | 15,782,400 |
| Size | 147.9 MB | 15.1 MB |
| Events in quadrant A | 1,430,079 | 79,297 |
| Events in quadrant B | 1,066,532 | 81,943 |
| Events in quadrant C | 1,035,446 | 84,333 |
| Events in quadrant D | 1,022,495 | 82,186 |
| Mode M9 | |||
|---|---|---|---|
| Quadrant | BADHDUFLAG | Total packets | Discarded packets |
| A | 0 | 2 | 0 |
| B | 0 | 2 | 0 |
| C | 0 | 2 | 0 |
| D | 0 | 2 | 0 |
| Mode M0 | |||
|---|---|---|---|
| Quadrant | BADHDUFLAG | Total packets | Discarded packets |
| A | 0 | 5660 | 52 |
| B | 0 | 4606 | 50 |
| C | 0 | 4604 | 57 |
| D | 0 | 4655 | 32 |
| Mode SS | |||
|---|---|---|---|
| Quadrant | BADHDUFLAG | Total packets | Discarded packets |
| A | 0 | 42 | 0 |
| B | 0 | 42 | 2 |
| C | 0 | 42 | 0 |
| D | 0 | 42 | 0 |
| Quadrant | Total seconds | Saturated seconds | Saturation percentage |
|---|---|---|---|
| A | 2067 | 206 | 9.966134% |
| B | 2061 | 164 | 7.957302% |
| C | 2059 | 98 | 4.759592% |
| D | 2068 | 101 | 4.883946% |
Noise dominated data is calculated using 1-second bins in cleaned event files. If a bin has >2000 counts, and if more than 50% of those come from <1% of pixels, then it is considered to be noise-dominated and hence unusable.
| Quadrant | # 1 sec bins | Bins with >0 counts | Bins with >2000 counts | High rate bins dominated by noise | Noise dominated (total time) | Noise dominated (detector-on time) | Marked lightcurve |
|---|---|---|---|---|---|---|---|
| A | 2288 | 2084 | 24 | 24 | 1.05% | 1.15% | 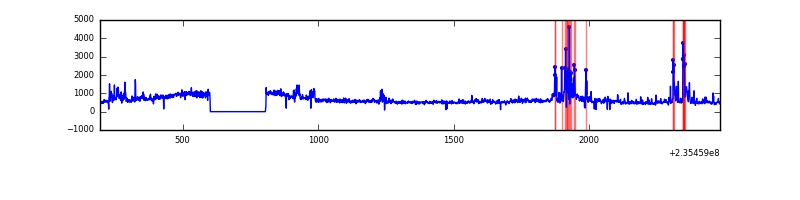 |
| B | 2288 | 2084 | 0 | 0 | 0.00% | 0.00% | 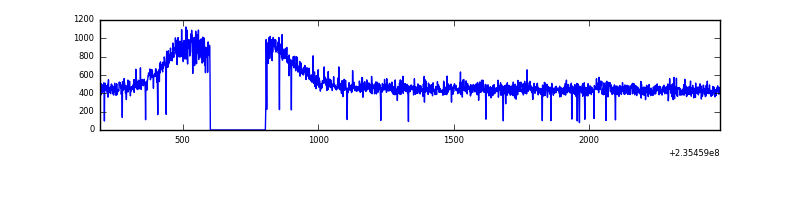 |
| C | 2288 | 2082 | 0 | 0 | 0.00% | 0.00% | 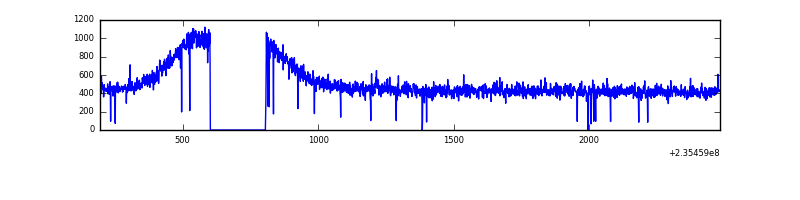 |
| D | 2288 | 2083 | 2 | 2 | 0.09% | 0.10% | 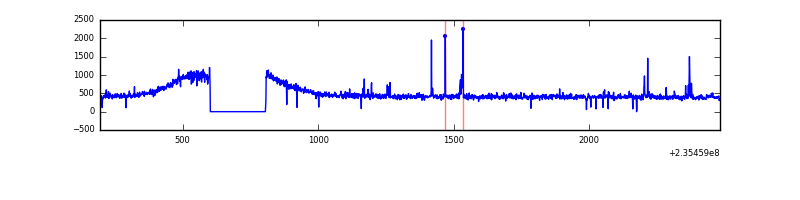 |
Top three noisy pixels from each quadrant. If the there are fewer than three noisy pixels in the level2.evt file, extra rows are filled as -1
| Pixel properties | Quadrant properties | ||||||
|---|---|---|---|---|---|---|---|
| Quadrant | DetID | PixID | Counts | Sigma | Mean | Median | Sigma |
| A | 8 | 5 | 241123 | 4156.17 | 268 | 262 | 58.0 |
| A | 5 | 16 | 117287 | 2019.32 | 268 | 262 | 58.0 |
| A | 1 | 162 | 28030 | 479.15 | 268 | 262 | 58.0 |
| B | 12 | 111 | 6865 | 115.07 | 272 | 265 | 57.4 |
| B | 11 | 111 | 5528 | 91.76 | 272 | 265 | 57.4 |
| B | 14 | 111 | 4257 | 69.6 | 272 | 265 | 57.4 |
| C | 9 | 68 | 4983 | 73.46 | 263 | 265 | 64.2 |
| C | 13 | 61 | 2010 | 27.17 | 263 | 265 | 64.2 |
| C | 8 | 222 | 1447 | 18.4 | 263 | 265 | 64.2 |
| D | 1 | 52 | 11249 | 157.08 | 260 | 254 | 70.0 |
| D | 10 | 172 | 10310 | 143.67 | 260 | 254 | 70.0 |
| D | 2 | 14 | 6936 | 95.46 | 260 | 254 | 70.0 |
Histogram calculated using DETX and DETY for each event in the final _common_clean file
| Quadrant A | 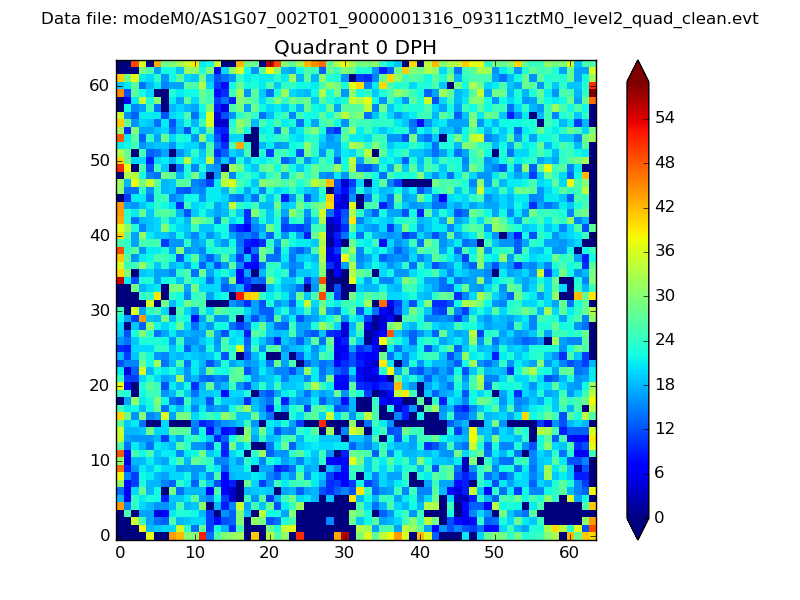 |
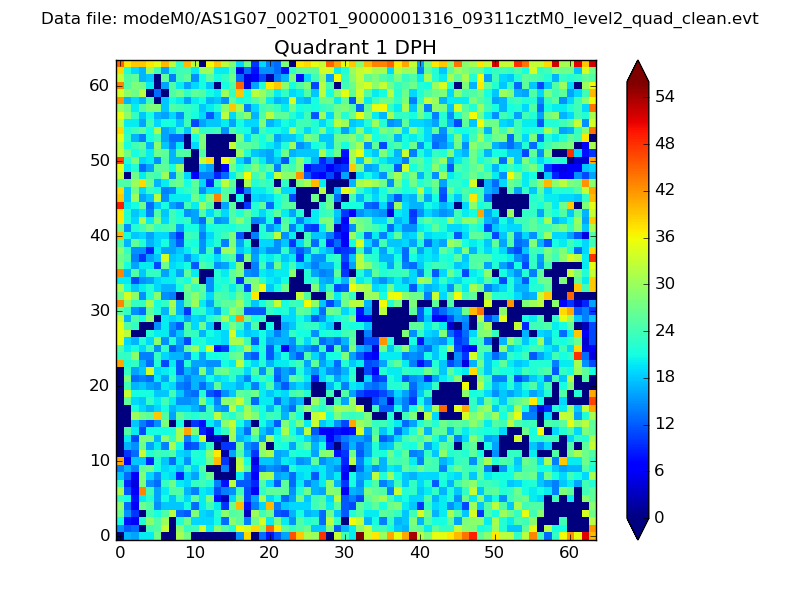 |
Quadrant B |
|---|---|---|---|
| Quadrant D | 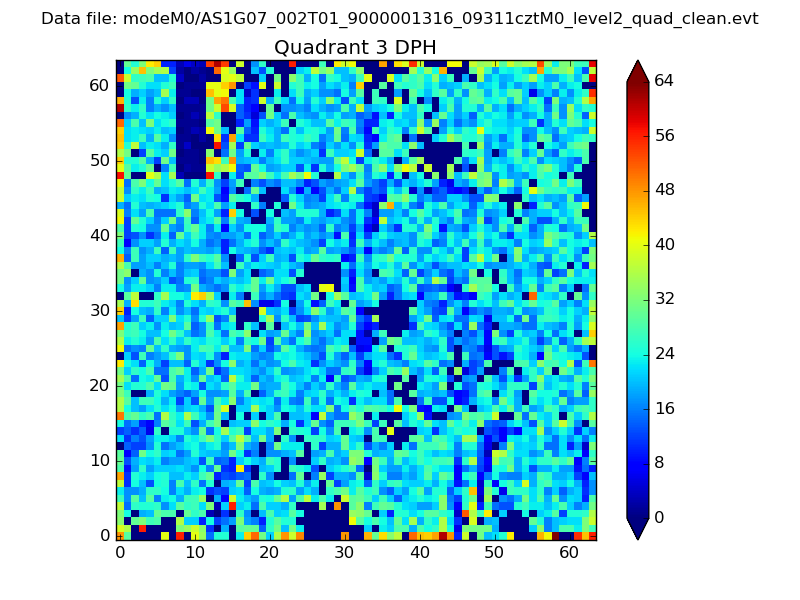 |
 |
Quadrant C |
| Plot type | Count rate plots | Images |
|---|---|---|
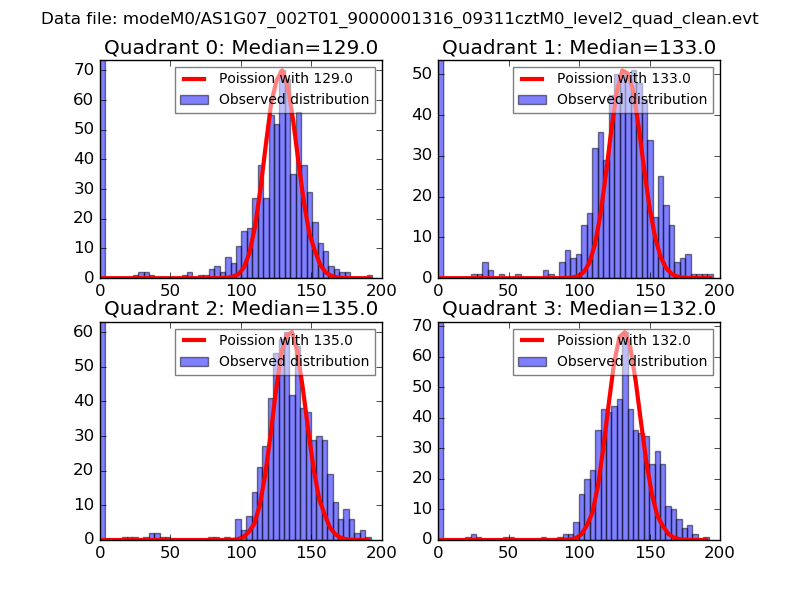
| Comparison with Poisson distribution Blue bars denote a histogram of data divided into 1 sec bins. Red curve is a Poisson curve with rate = median count rate of data. |
 |
 |
| Quadrant-wise count rates Data is divided into 100 sec bins |
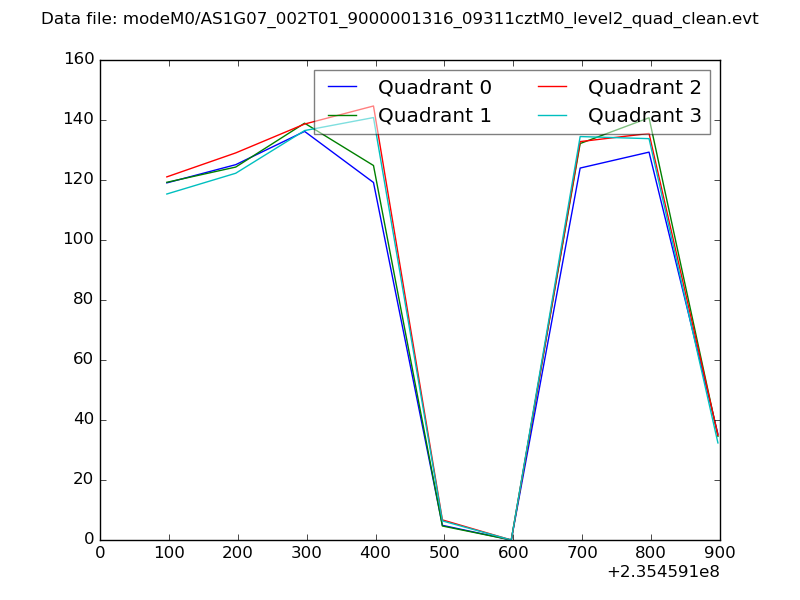 |
|
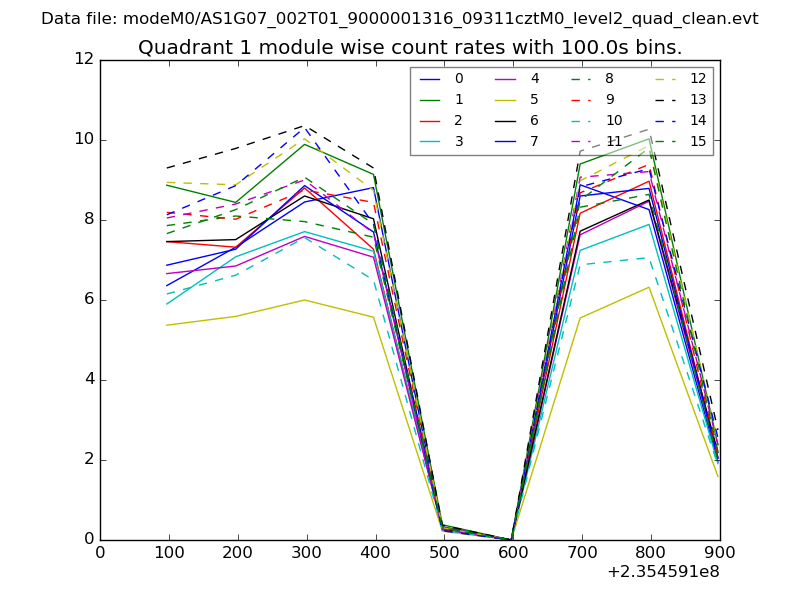
| Module-wise count rates for Quadrant A Data is divided into 100 sec bins |
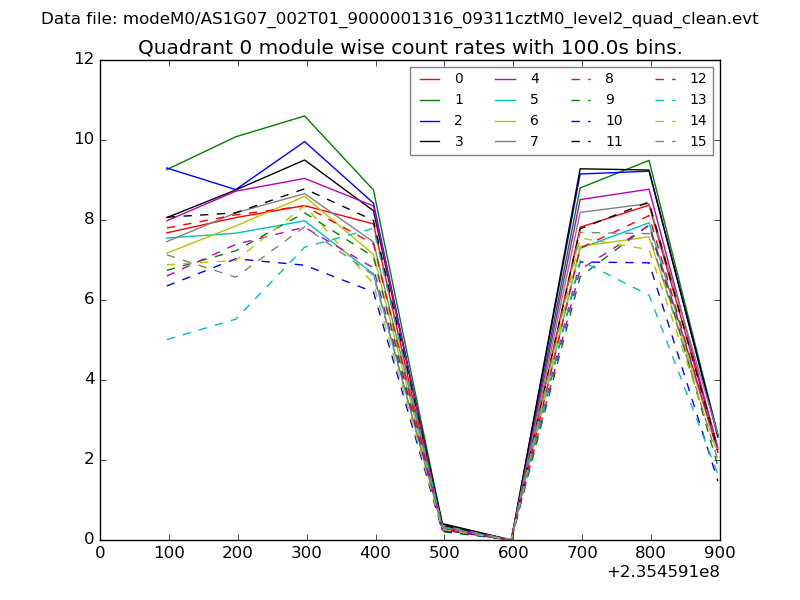 |
 |
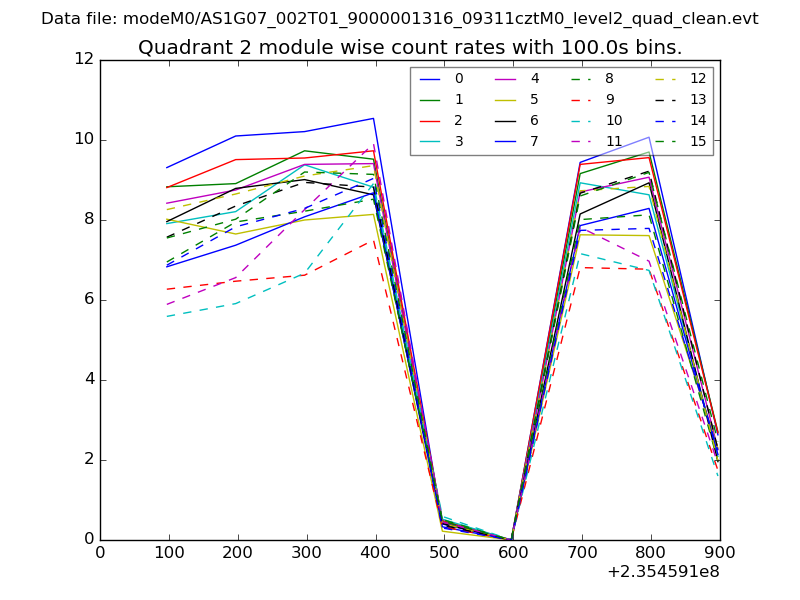
| Module-wise count rates for Quadrant B Data is divided into 100 sec bins |
 |
 |
| Module-wise count rates for Quadrant C Data is divided into 100 sec bins |
 |
 |
| Module-wise count rates for Quadrant D Data is divided into 100 sec bins |
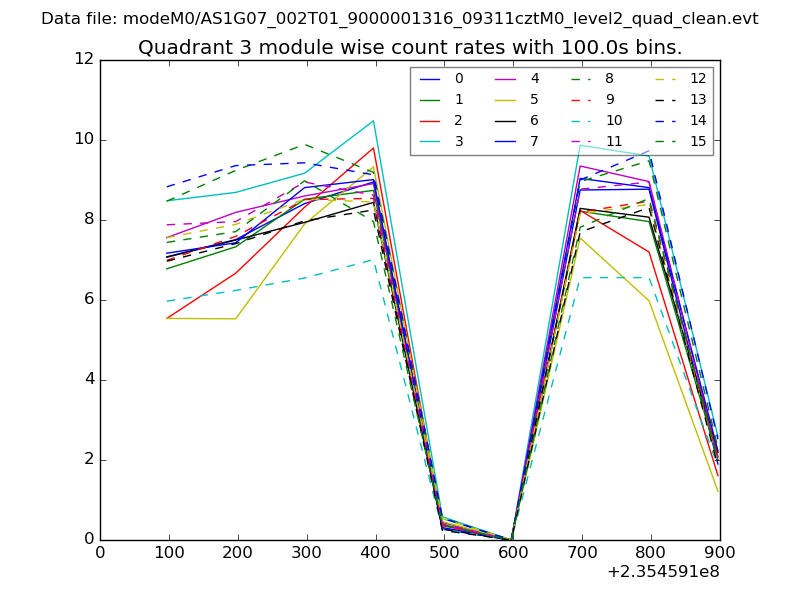 |
 |
| Parameter | Plot |
|---|---|
| CZT HV Monitor | 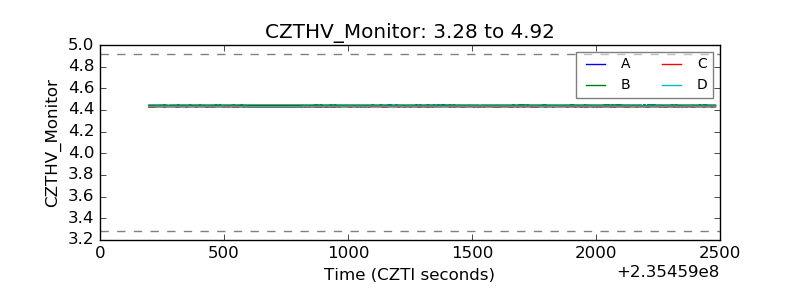 |
| D_VDD | 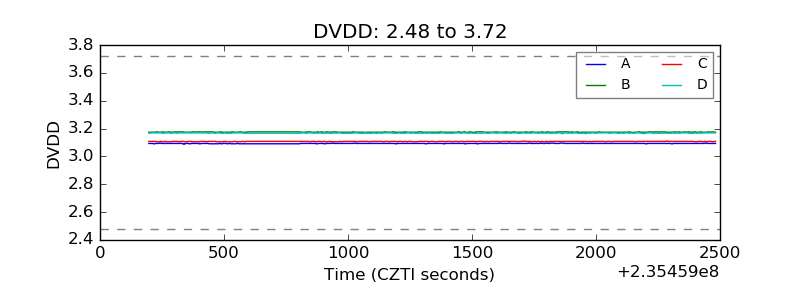 |
| Temperature 1 |  |
| Veto HV Monitor | 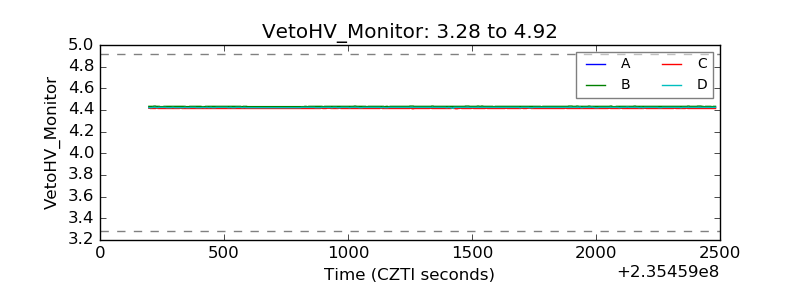 |
| Veto LLD | 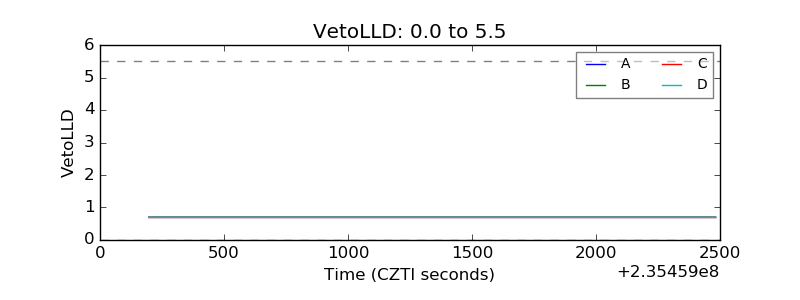 |
| Alpha Counter | 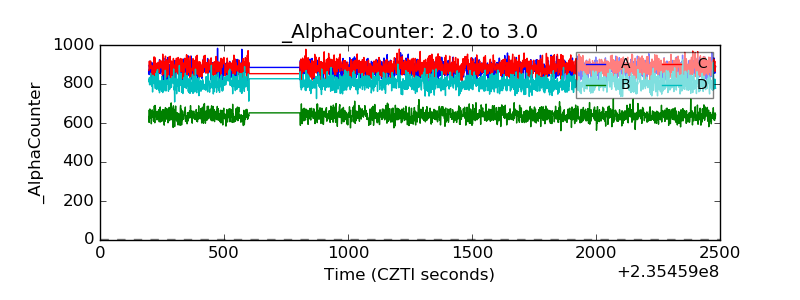 |
| _CPM_Rate | 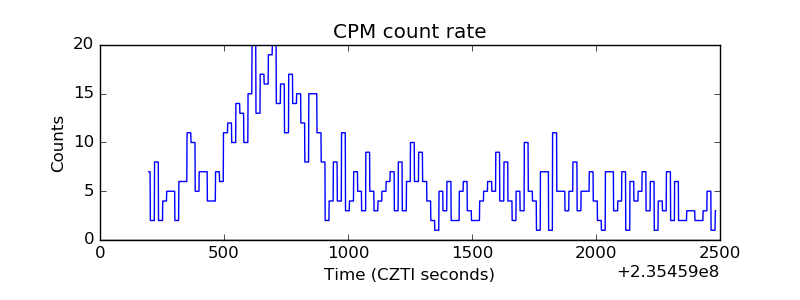 |
| CZT Counter | 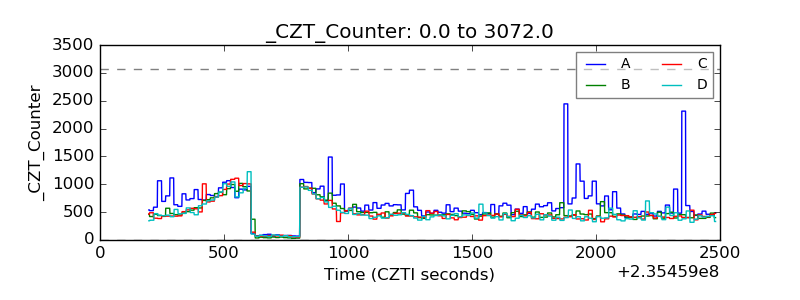 |
| +2.5 Volts monitor |  |
| +5 Volts monitor |  |
| _ROLL_ROT | 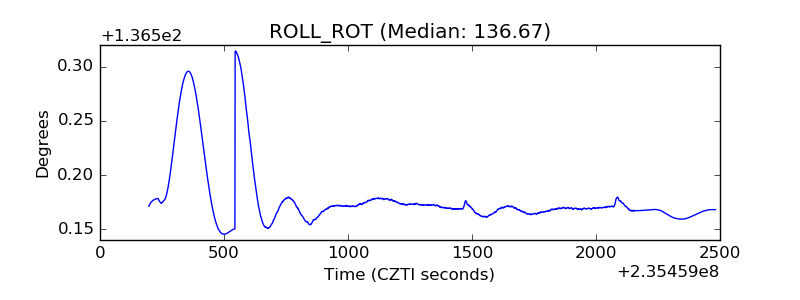 |
| _Roll_DEC | 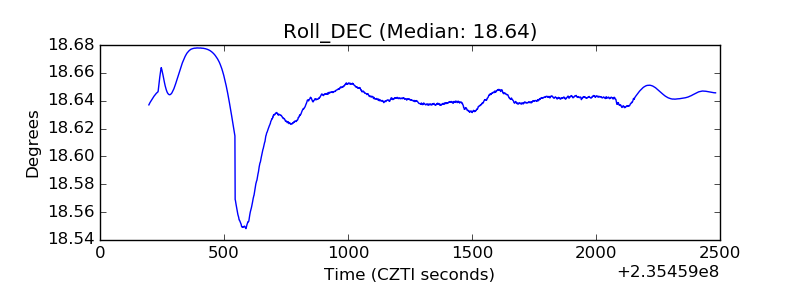 |
| _Roll_RA |  |
| Veto Counter | 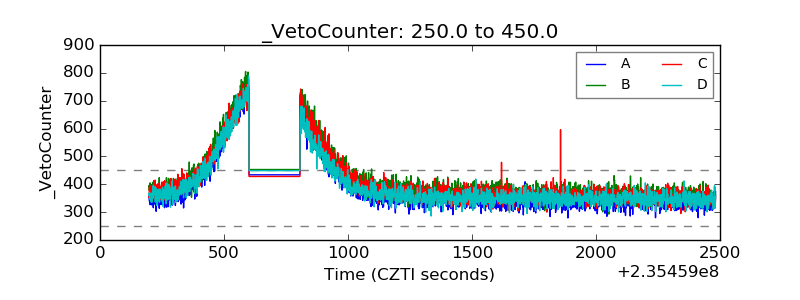 |