| Param | Original file | Final file |
|---|---|---|
| Filename | modeM0/AS1G07_002T01_9000001316_09312cztM0_level2.evt | modeM0/AS1G07_002T01_9000001316_09312cztM0_level2_quad_clean.evt |
| Size (bytes) | 640,477,440 | 85,947,840 |
| Size | 610.8 MB | 82.0 MB |
| Events in quadrant A | 5,372,743 | 513,513 |
| Events in quadrant B | 3,875,131 | 527,773 |
| Events in quadrant C | 3,765,850 | 524,545 |
| Events in quadrant D | 5,841,267 | 480,549 |
| Mode M9 | |||
|---|---|---|---|
| Quadrant | BADHDUFLAG | Total packets | Discarded packets |
| A | 0 | 5 | 0 |
| B | 0 | 5 | 0 |
| C | 0 | 5 | 0 |
| D | 0 | 5 | 0 |
| Mode M0 | |||
|---|---|---|---|
| Quadrant | BADHDUFLAG | Total packets | Discarded packets |
| A | 0 | 21348 | 75 |
| B | 0 | 16844 | 18 |
| C | 0 | 16845 | 31 |
| D | 0 | 23195 | 106 |
| Mode SS | |||
|---|---|---|---|
| Quadrant | BADHDUFLAG | Total packets | Discarded packets |
| A | 0 | 162 | 4 |
| B | 0 | 162 | 0 |
| C | 0 | 162 | 0 |
| D | 0 | 162 | 0 |
| Quadrant | Total seconds | Saturated seconds | Saturation percentage |
|---|---|---|---|
| A | 7994 | 401 | 5.016262% |
| B | 8012 | 332 | 4.143784% |
| C | 8005 | 220 | 2.748282% |
| D | 7999 | 878 | 10.976372% |
Noise dominated data is calculated using 1-second bins in cleaned event files. If a bin has >2000 counts, and if more than 50% of those come from <1% of pixels, then it is considered to be noise-dominated and hence unusable.
| Quadrant | # 1 sec bins | Bins with >0 counts | Bins with >2000 counts | High rate bins dominated by noise | Noise dominated (total time) | Noise dominated (detector-on time) | Marked lightcurve |
|---|---|---|---|---|---|---|---|
| A | 8484 | 8021 | 35 | 35 | 0.41% | 0.44% | 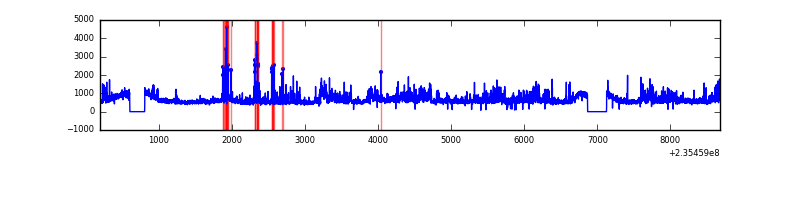 |
| B | 8484 | 8021 | 0 | 0 | 0.00% | 0.00% | 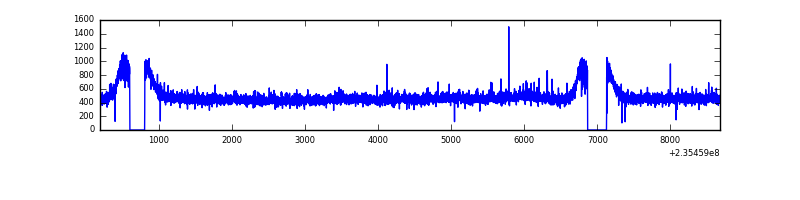 |
| C | 8484 | 8021 | 0 | 0 | 0.00% | 0.00% | 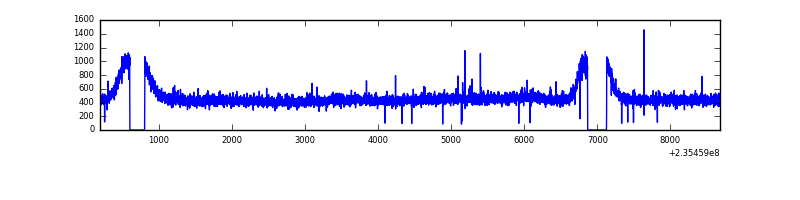 |
| D | 8484 | 8021 | 570 | 570 | 6.72% | 7.11% | 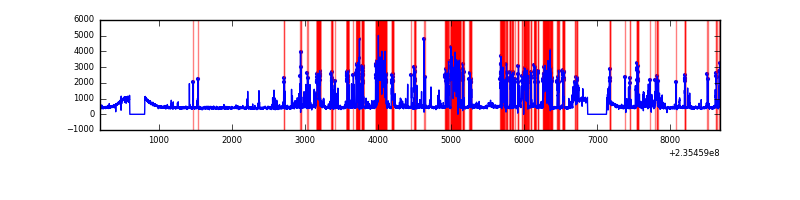 |
Top three noisy pixels from each quadrant. If the there are fewer than three noisy pixels in the level2.evt file, extra rows are filled as -1
| Pixel properties | Quadrant properties | ||||||
|---|---|---|---|---|---|---|---|
| Quadrant | DetID | PixID | Counts | Sigma | Mean | Median | Sigma |
| A | 8 | 5 | 1253878 | 6177.26 | 977 | 954 | 202.8 |
| A | 5 | 16 | 149897 | 734.33 | 977 | 954 | 202.8 |
| A | 1 | 162 | 95009 | 463.72 | 977 | 954 | 202.8 |
| B | 12 | 111 | 23221 | 114.18 | 988 | 961 | 195.0 |
| B | 11 | 111 | 18875 | 91.89 | 988 | 961 | 195.0 |
| B | 0 | 219 | 14705 | 70.5 | 988 | 961 | 195.0 |
| C | 10 | 22 | 8989 | 35.71 | 959 | 963 | 224.8 |
| C | 9 | 68 | 7621 | 29.62 | 959 | 963 | 224.8 |
| C | 13 | 61 | 7444 | 28.83 | 959 | 963 | 224.8 |
| D | 12 | 227 | 1928392 | 8168.78 | 923 | 899 | 236.0 |
| D | 1 | 52 | 152029 | 640.49 | 923 | 899 | 236.0 |
| D | 10 | 172 | 116606 | 490.37 | 923 | 899 | 236.0 |
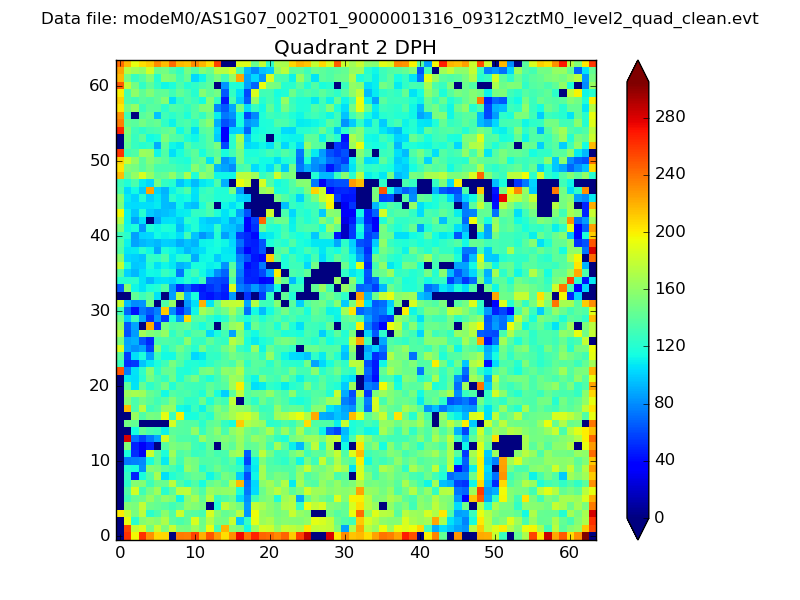
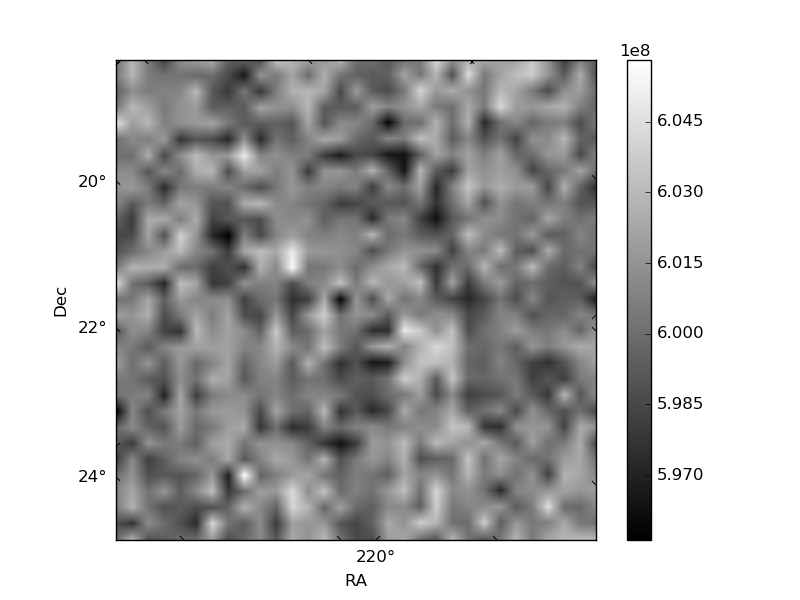
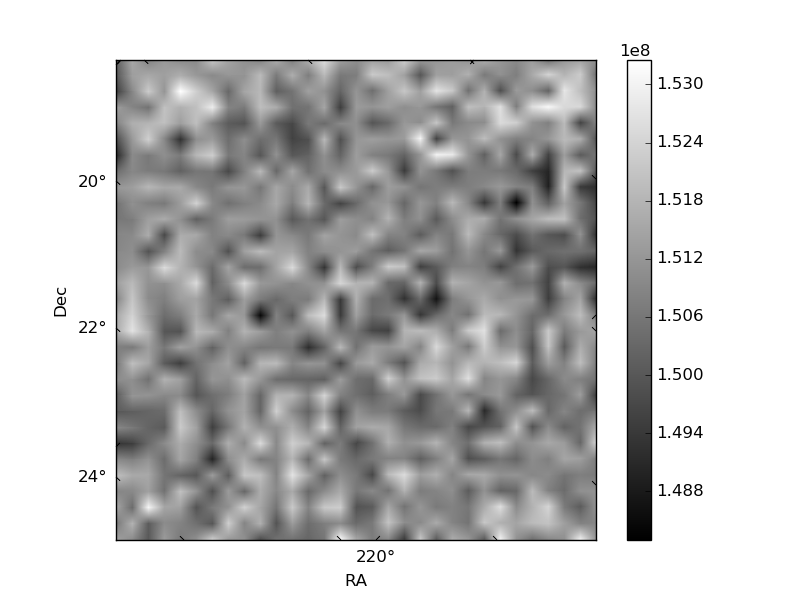
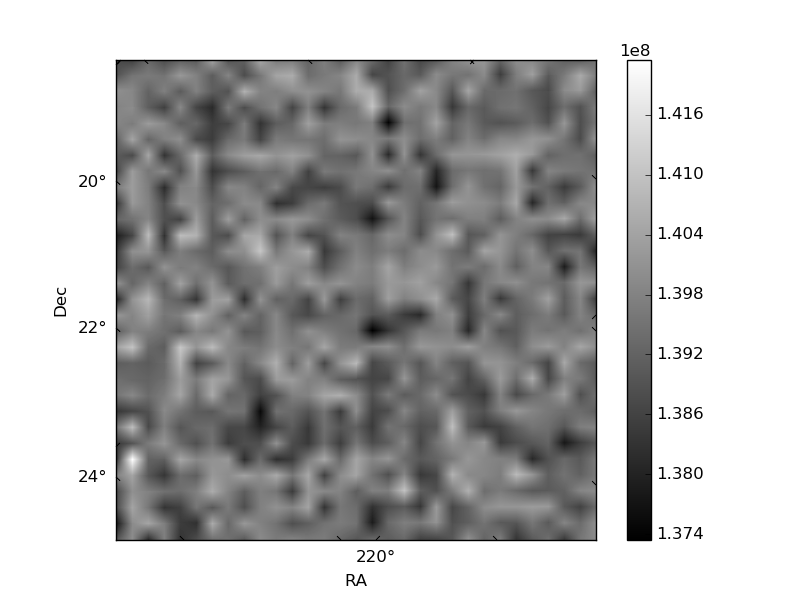
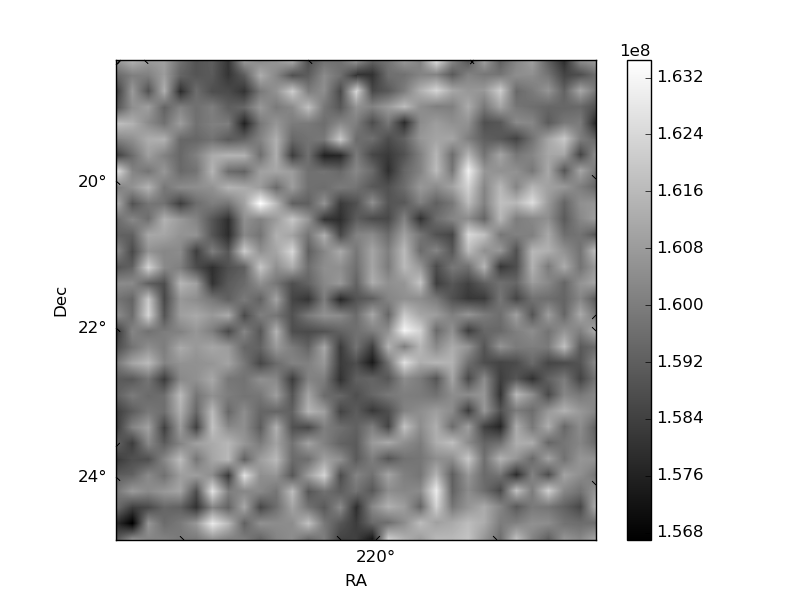
Histogram calculated using DETX and DETY for each event in the final _common_clean file
| Quadrant A | 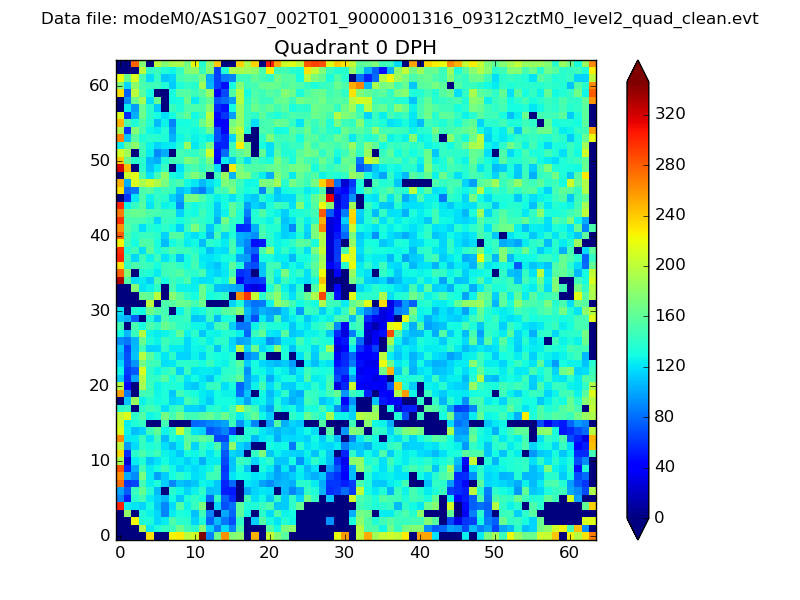 |
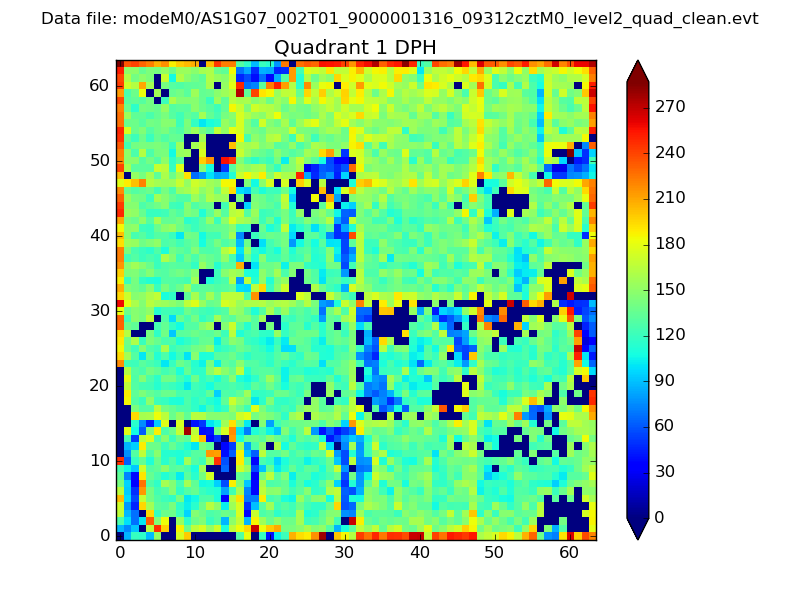 |
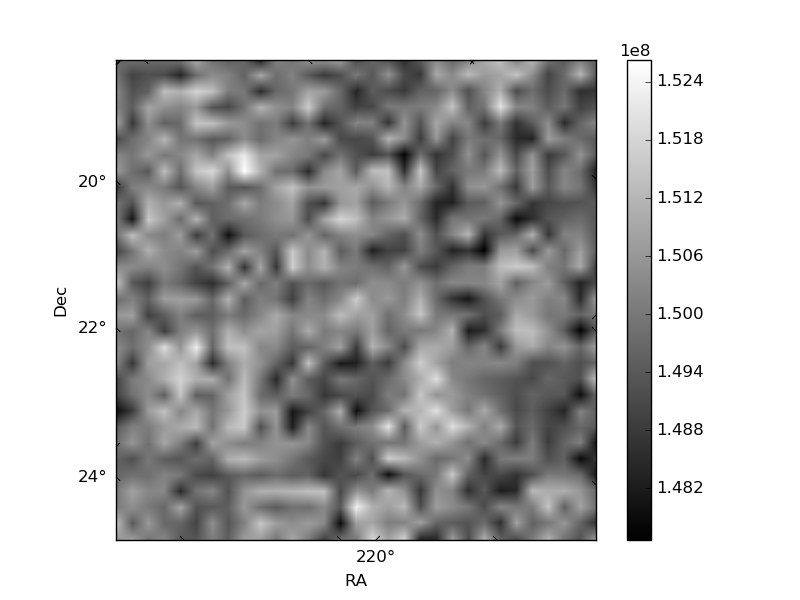
Quadrant B |
|---|---|---|---|
| Quadrant D | 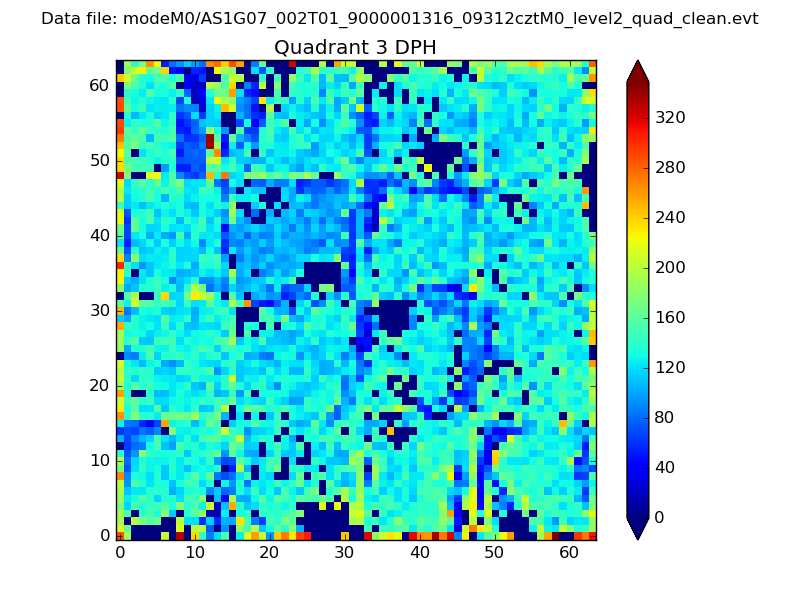 |
 |
Quadrant C |
| Plot type | Count rate plots | Images |
|---|---|---|
| Comparison with Poisson distribution Blue bars denote a histogram of data divided into 1 sec bins. Red curve is a Poisson curve with rate = median count rate of data. |
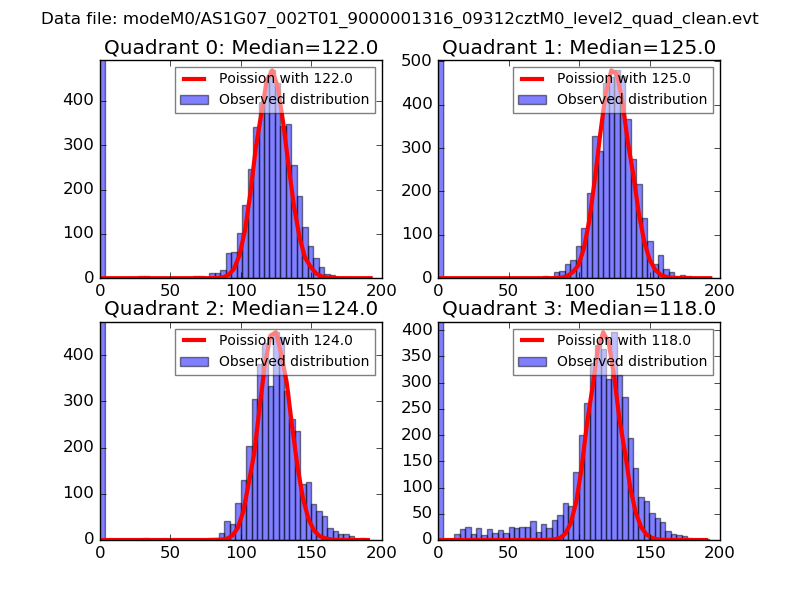 |
 |
| Quadrant-wise count rates Data is divided into 100 sec bins |
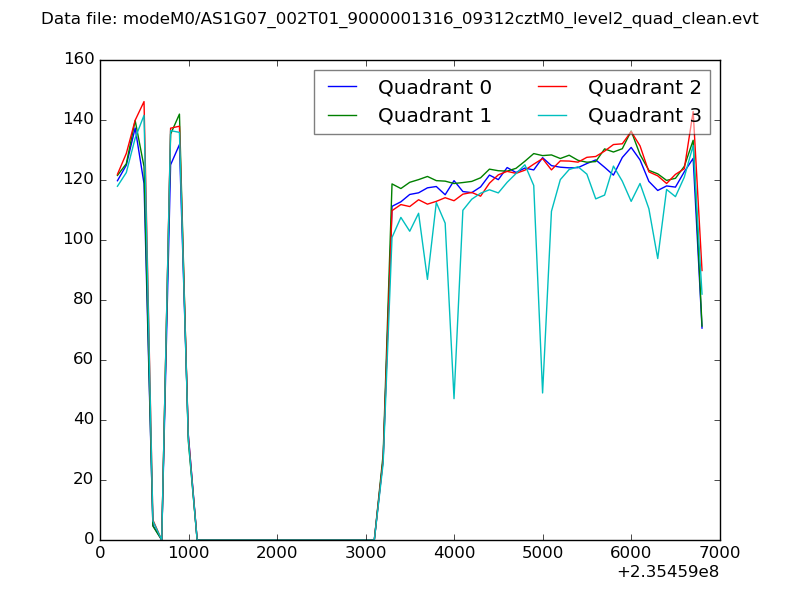 |
|
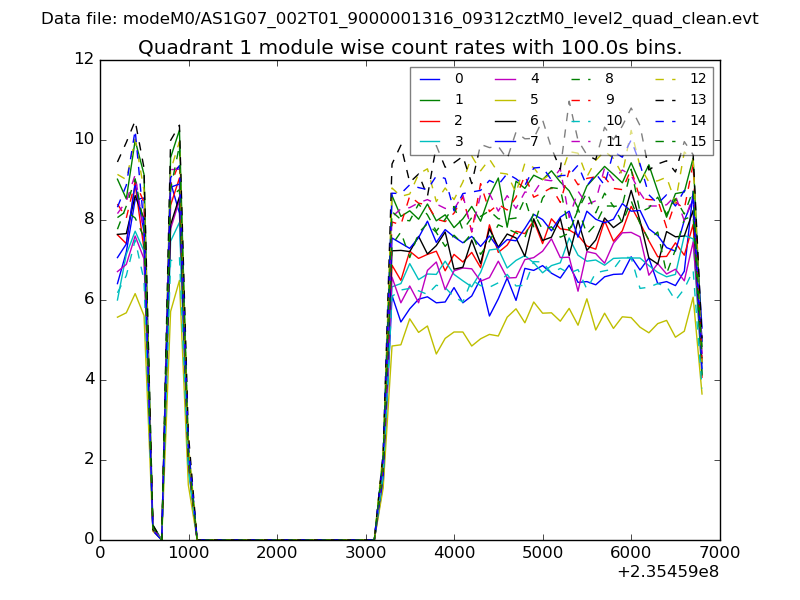
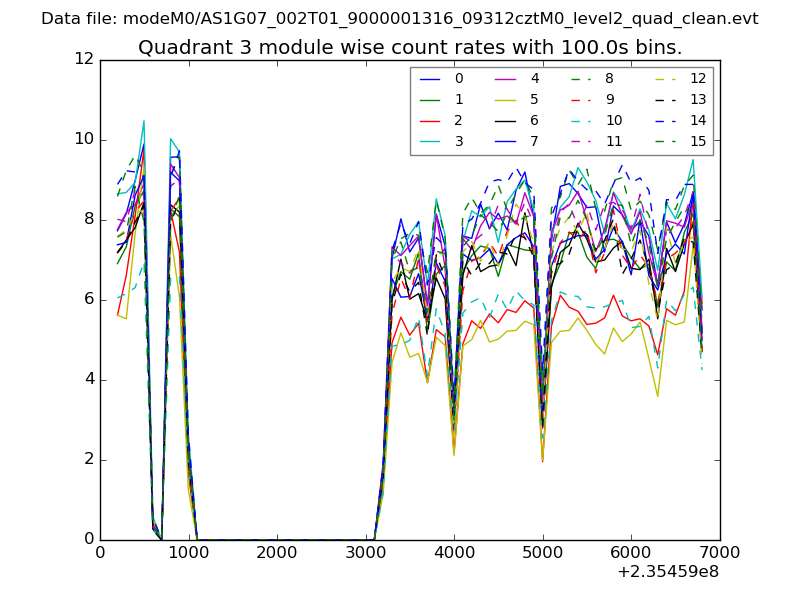
| Module-wise count rates for Quadrant A Data is divided into 100 sec bins |
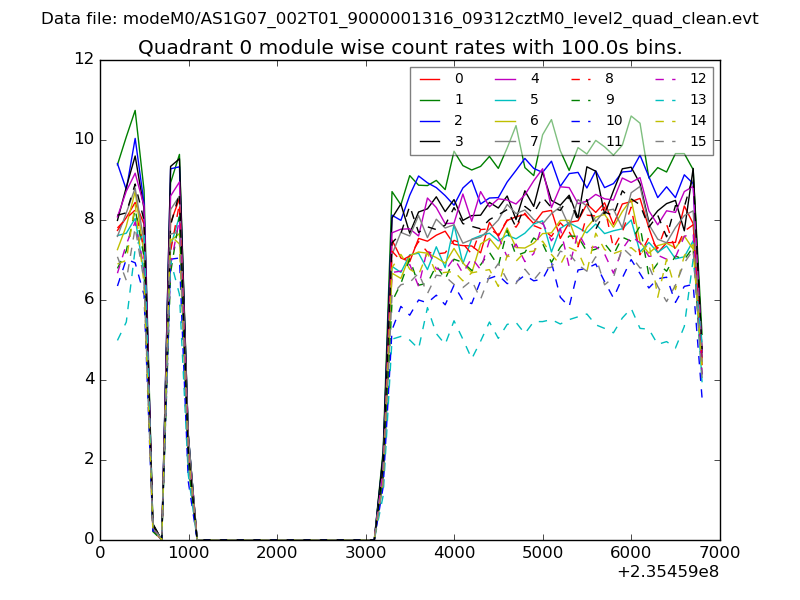 |
 |
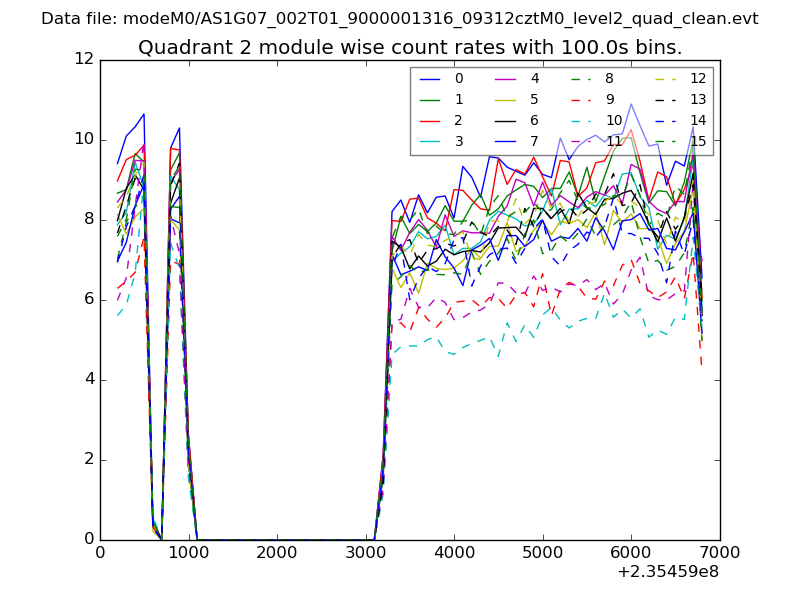
| Module-wise count rates for Quadrant B Data is divided into 100 sec bins |
 |
 |
| Module-wise count rates for Quadrant C Data is divided into 100 sec bins |
 |
 |
| Module-wise count rates for Quadrant D Data is divided into 100 sec bins |
 |
 |
| Parameter | Plot |
|---|---|
| CZT HV Monitor | 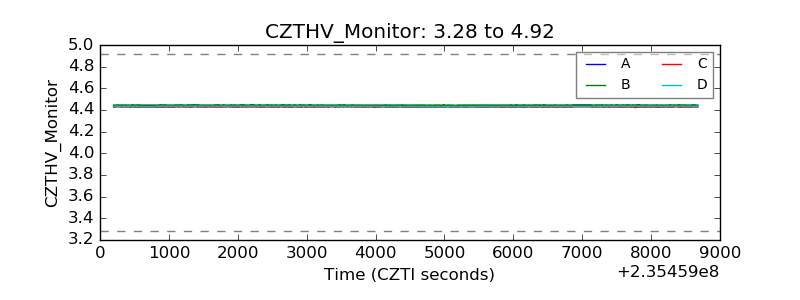 |
| D_VDD | 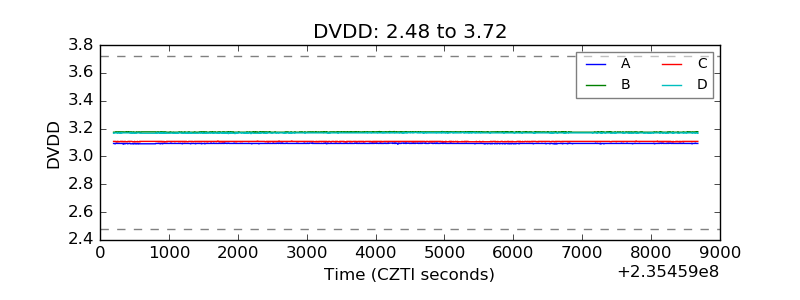 |
| Temperature 1 | 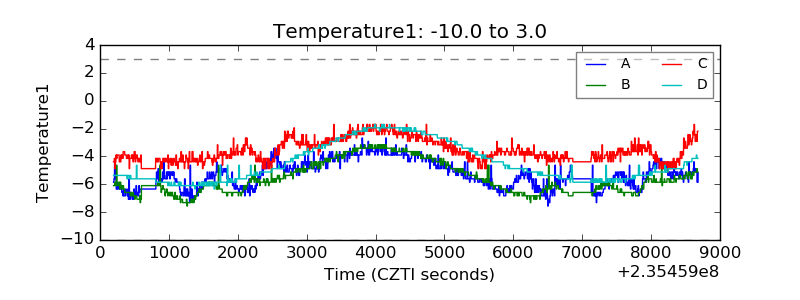 |
| Veto HV Monitor |  |
| Veto LLD | 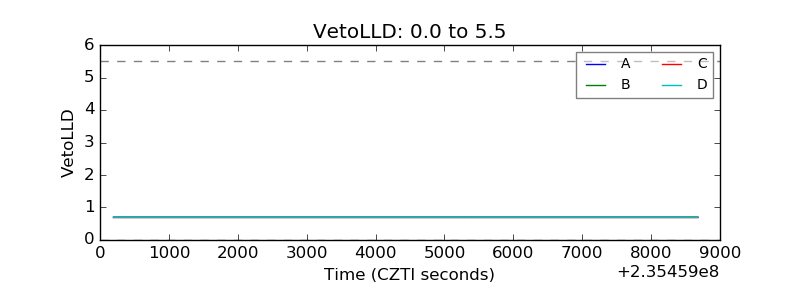 |
| Alpha Counter |  |
| _CPM_Rate | 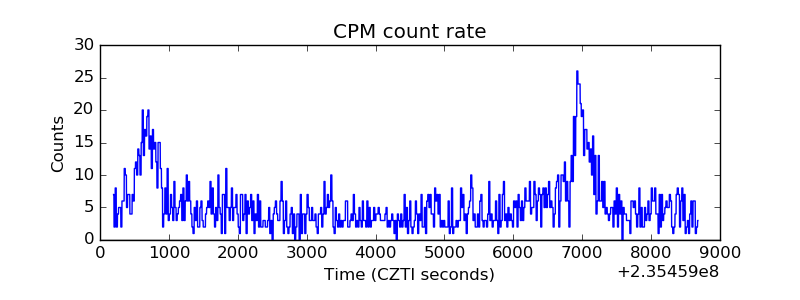 |
| CZT Counter | 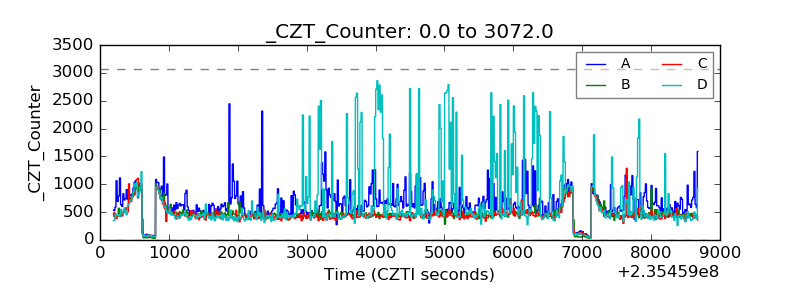 |
| +2.5 Volts monitor |  |
| +5 Volts monitor |  |
| _ROLL_ROT | 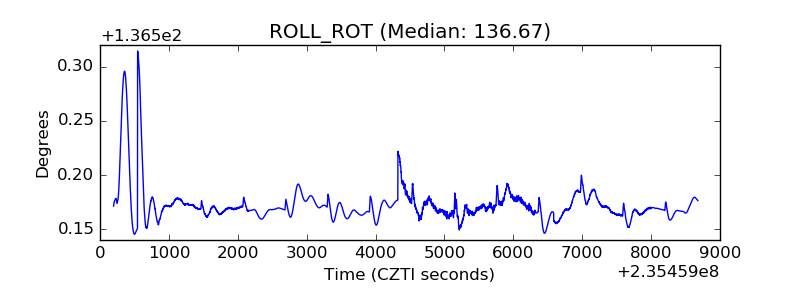 |
| _Roll_DEC | 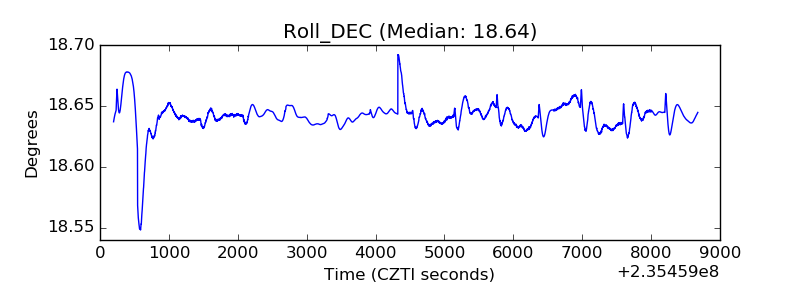 |
| _Roll_RA | 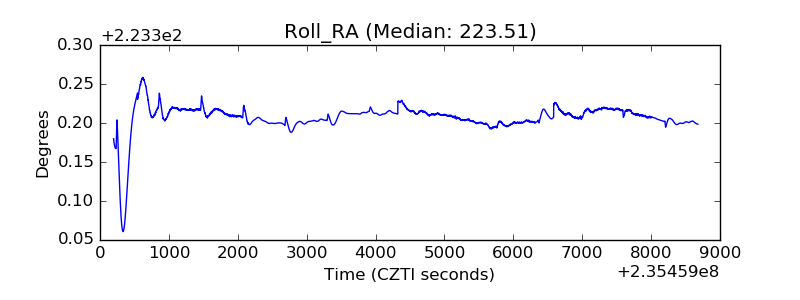 |
| Veto Counter | 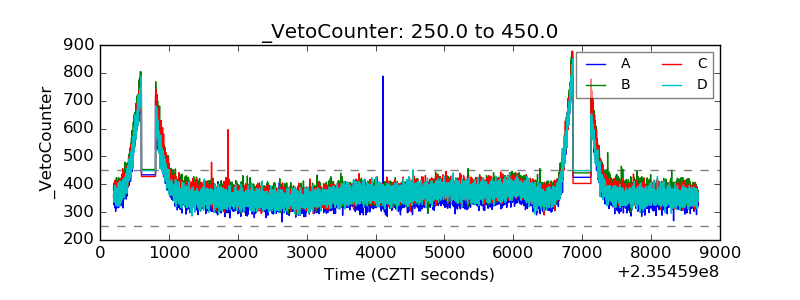 |