| Param | Original file | Final file |
|---|---|---|
| Filename | modeM0/AS1G07_002T01_9000001316_09315cztM0_level2.evt | modeM0/AS1G07_002T01_9000001316_09315cztM0_level2_quad_clean.evt |
| Size (bytes) | 1,354,360,320 | 229,547,520 |
| Size | 1.3 GB | 218.9 MB |
| Events in quadrant A | 11,575,280 | 1,413,525 |
| Events in quadrant B | 8,987,524 | 1,440,516 |
| Events in quadrant C | 8,574,144 | 1,426,005 |
| Events in quadrant D | 10,615,411 | 1,383,537 |
| Mode M9 | |||
|---|---|---|---|
| Quadrant | BADHDUFLAG | Total packets | Discarded packets |
| A | 0 | 21 | 0 |
| B | 0 | 21 | 1 |
| C | 0 | 21 | 0 |
| D | 0 | 21 | 1 |
| Mode M0 | |||
|---|---|---|---|
| Quadrant | BADHDUFLAG | Total packets | Discarded packets |
| A | 0 | 48825 | 2287 |
| B | 0 | 40313 | 1532 |
| C | 0 | 39757 | 1333 |
| D | 0 | 46269 | 1950 |
| Mode SS | |||
|---|---|---|---|
| Quadrant | BADHDUFLAG | Total packets | Discarded packets |
| A | 0 | 396 | 10 |
| B | 0 | 396 | 22 |
| C | 0 | 396 | 16 |
| D | 0 | 396 | 12 |
| Quadrant | Total seconds | Saturated seconds | Saturation percentage |
|---|---|---|---|
| A | 18611 | 528 | 2.837032% |
| B | 18708 | 438 | 2.341244% |
| C | 18771 | 322 | 1.715412% |
| D | 18695 | 740 | 3.958278% |
Noise dominated data is calculated using 1-second bins in cleaned event files. If a bin has >2000 counts, and if more than 50% of those come from <1% of pixels, then it is considered to be noise-dominated and hence unusable.
| Quadrant | # 1 sec bins | Bins with >0 counts | Bins with >2000 counts | High rate bins dominated by noise | Noise dominated (total time) | Noise dominated (detector-on time) | Marked lightcurve |
|---|---|---|---|---|---|---|---|
| A | 21514 | 19113 | 31 | 31 | 0.14% | 0.16% | 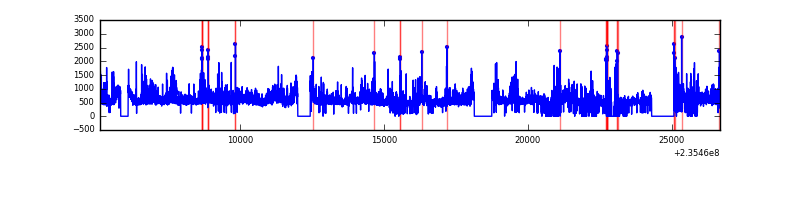 |
| B | 21514 | 19166 | 11 | 11 | 0.05% | 0.06% | 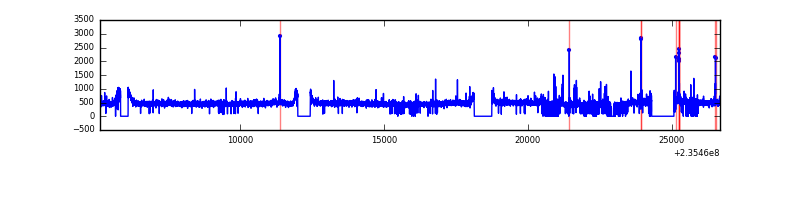 |
| C | 21514 | 19214 | 1 | 1 | 0.00% | 0.01% | 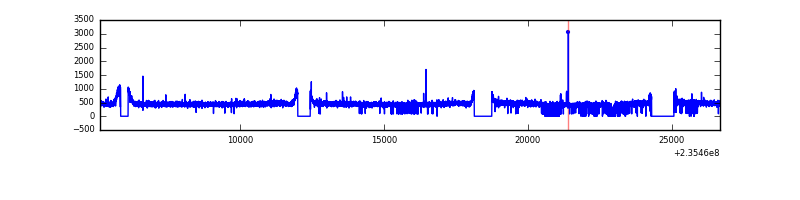 |
| D | 21514 | 19169 | 281 | 281 | 1.31% | 1.47% | 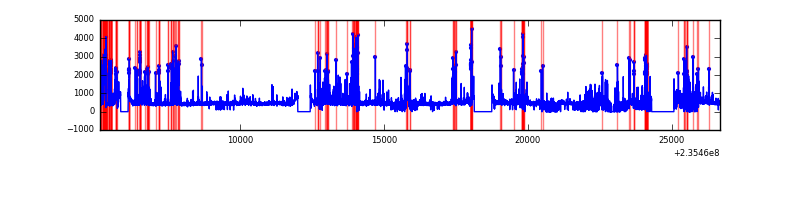 |
Top three noisy pixels from each quadrant. If the there are fewer than three noisy pixels in the level2.evt file, extra rows are filled as -1
| Pixel properties | Quadrant properties | ||||||
|---|---|---|---|---|---|---|---|
| Quadrant | DetID | PixID | Counts | Sigma | Mean | Median | Sigma |
| A | 8 | 5 | 2666273 | 5872.19 | 2223 | 2172 | 453.7 |
| A | 1 | 162 | 200623 | 437.42 | 2223 | 2172 | 453.7 |
| A | 1 | 178 | 39090 | 81.37 | 2223 | 2172 | 453.7 |
| B | 10 | 245 | 112649 | 255.24 | 2241 | 2180 | 432.8 |
| B | 0 | 219 | 95967 | 216.69 | 2241 | 2180 | 432.8 |
| B | 12 | 111 | 50385 | 111.38 | 2241 | 2180 | 432.8 |
| C | 13 | 61 | 16351 | 27.8 | 2190 | 2193 | 509.2 |
| C | 8 | 222 | 13005 | 21.23 | 2190 | 2193 | 509.2 |
| C | 5 | 128 | 10430 | 16.17 | 2190 | 2193 | 509.2 |
| D | 12 | 227 | 725425 | 1346.72 | 2152 | 2093 | 537.1 |
| D | 10 | 172 | 721433 | 1339.28 | 2152 | 2093 | 537.1 |
| D | 1 | 52 | 551549 | 1022.99 | 2152 | 2093 | 537.1 |
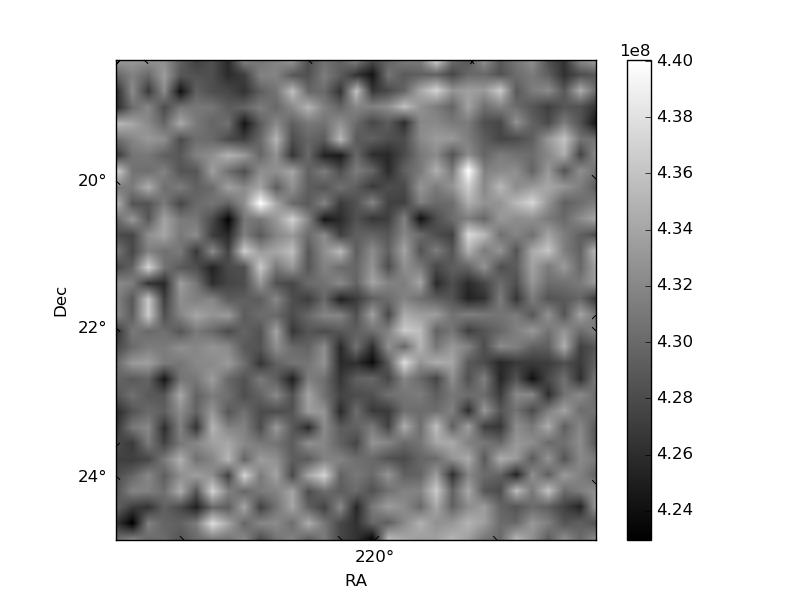
Histogram calculated using DETX and DETY for each event in the final _common_clean file
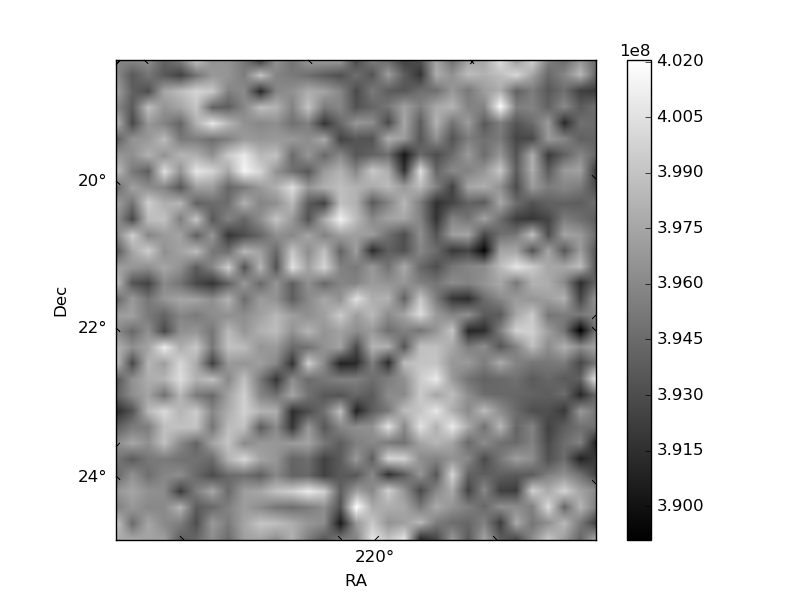
| Quadrant A | 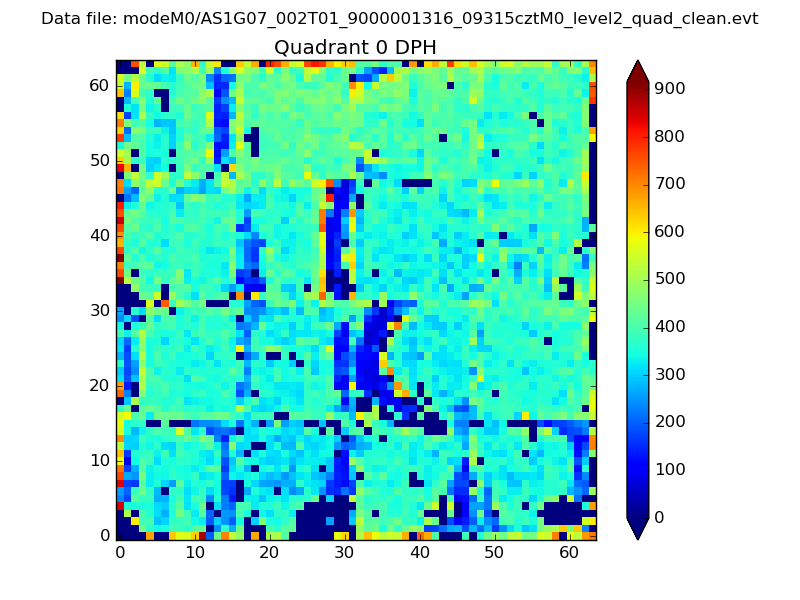 |
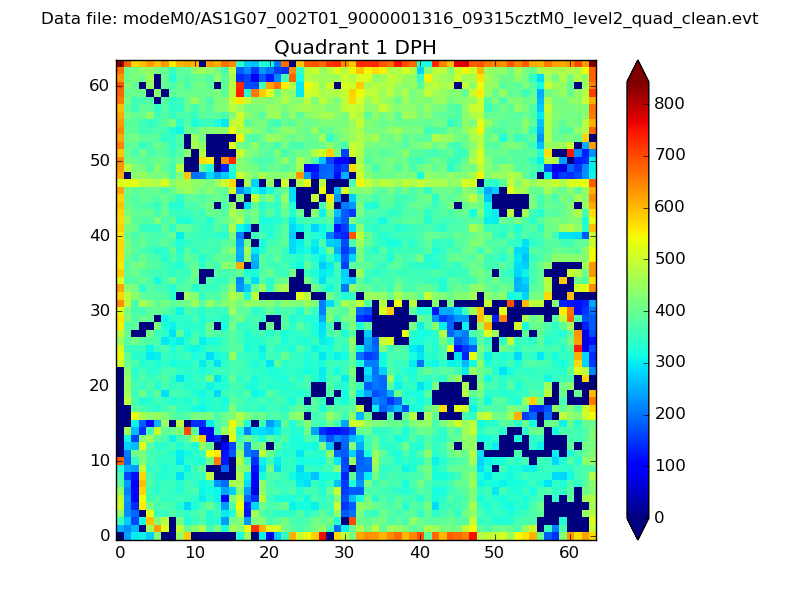 |
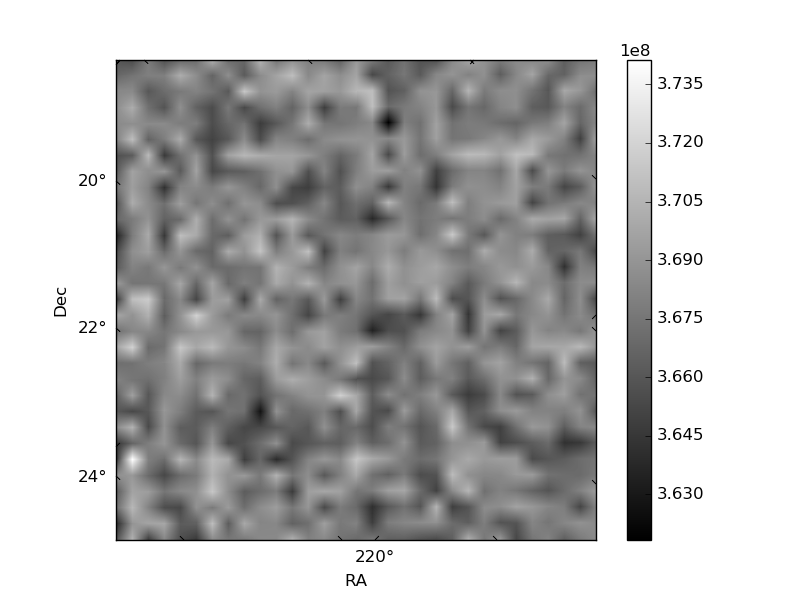
Quadrant B |
|---|---|---|---|
| Quadrant D | 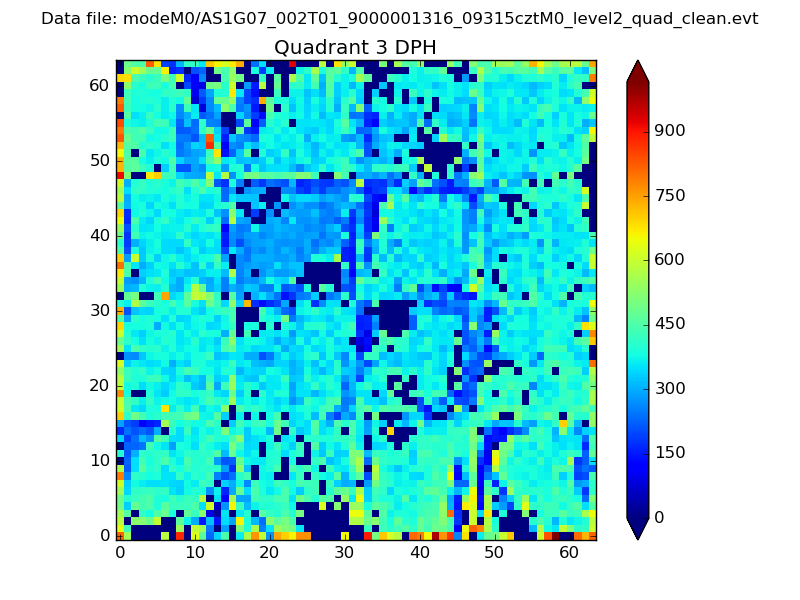 |
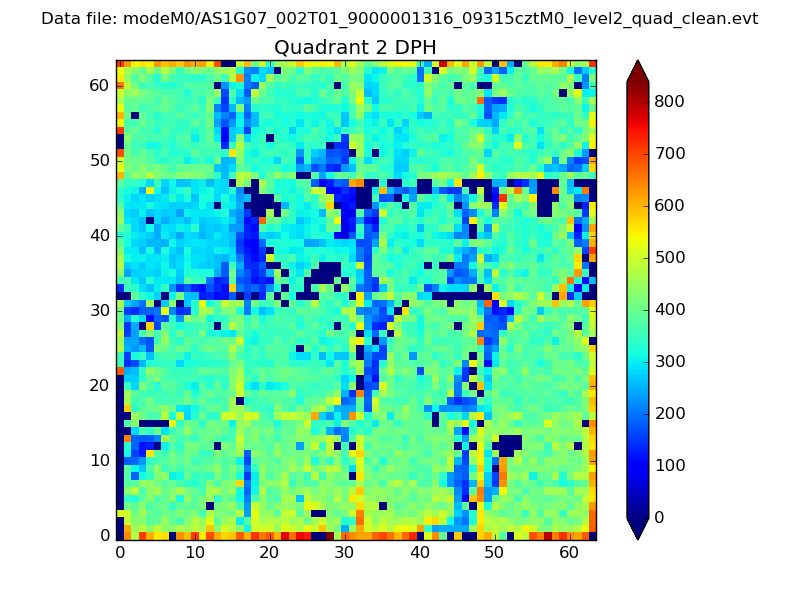 |
Quadrant C |
| Plot type | Count rate plots | Images |
|---|---|---|
| Comparison with Poisson distribution Blue bars denote a histogram of data divided into 1 sec bins. Red curve is a Poisson curve with rate = median count rate of data. |
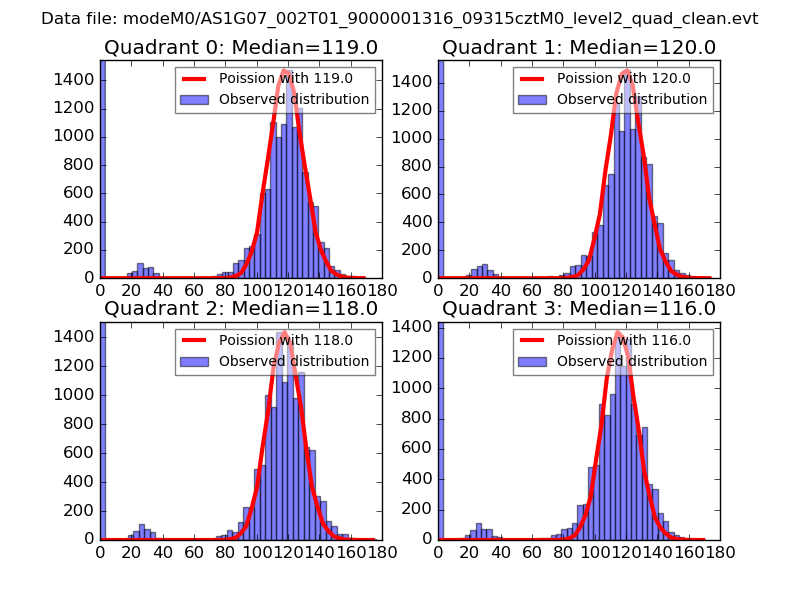 |
 |
| Quadrant-wise count rates Data is divided into 100 sec bins |
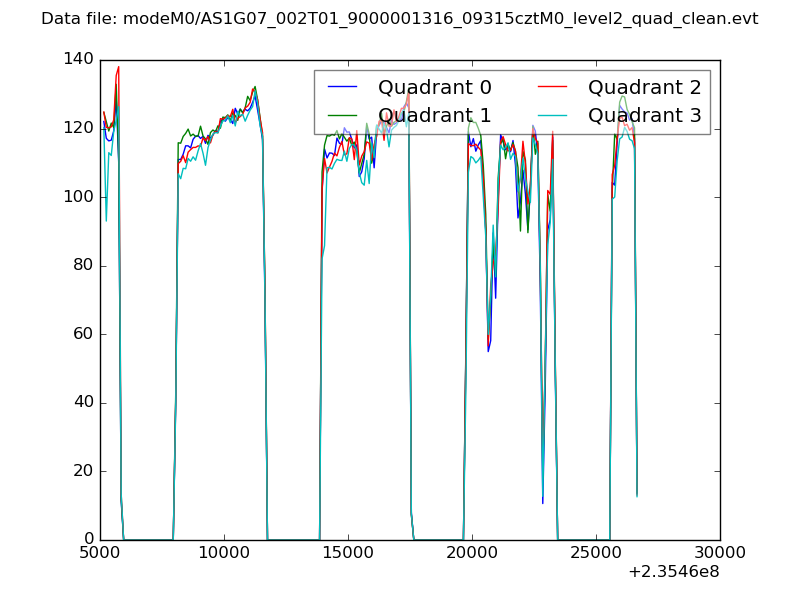 |
|
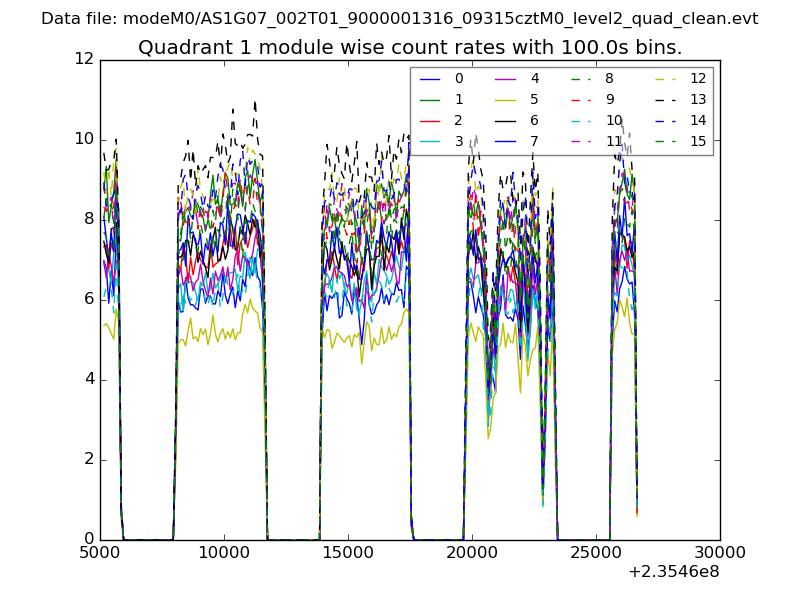
| Module-wise count rates for Quadrant A Data is divided into 100 sec bins |
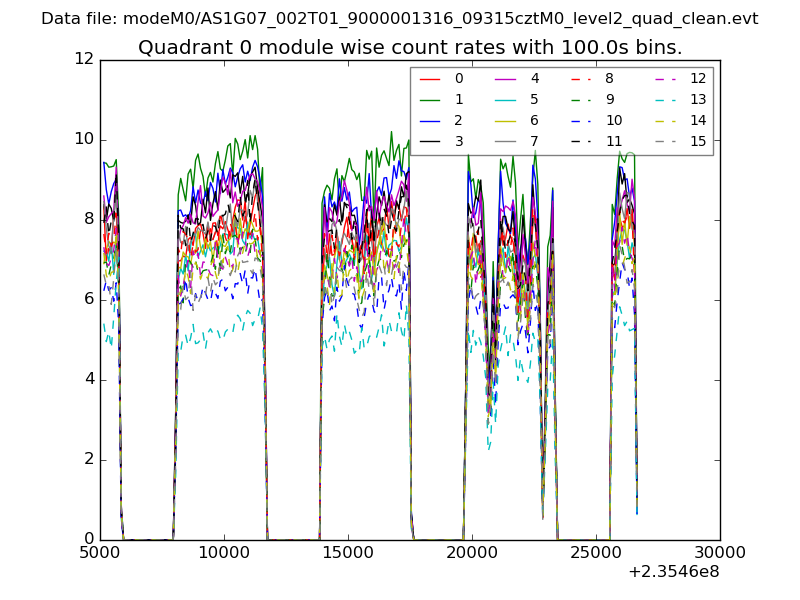 |
 |
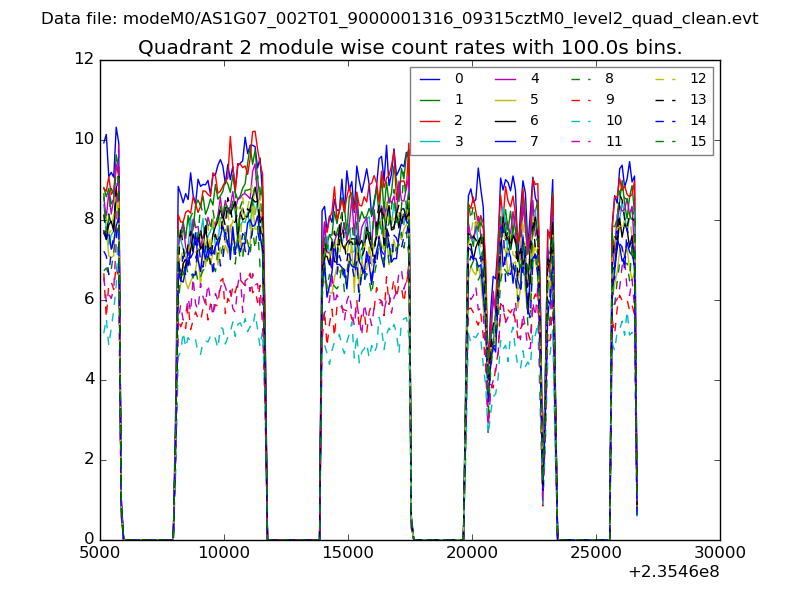
| Module-wise count rates for Quadrant B Data is divided into 100 sec bins |
 |
 |
| Module-wise count rates for Quadrant C Data is divided into 100 sec bins |
 |
 |
| Module-wise count rates for Quadrant D Data is divided into 100 sec bins |
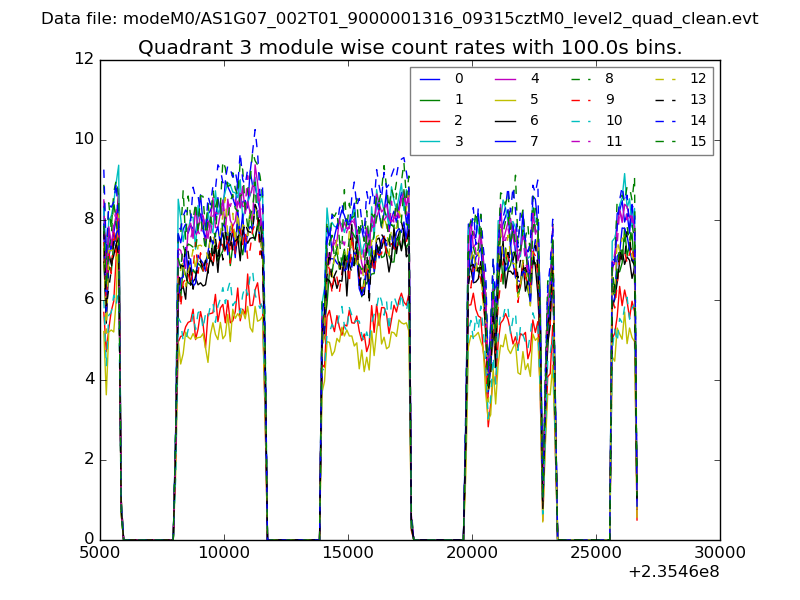 |
 |
| Parameter | Plot |
|---|---|
| CZT HV Monitor | 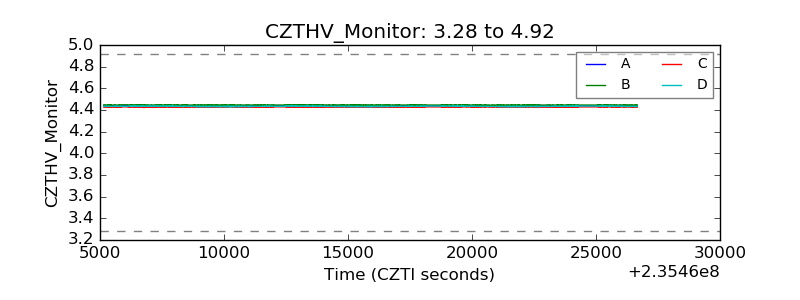 |
| D_VDD | 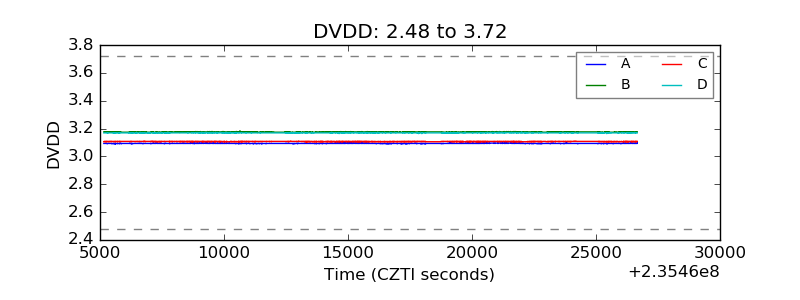 |
| Temperature 1 | 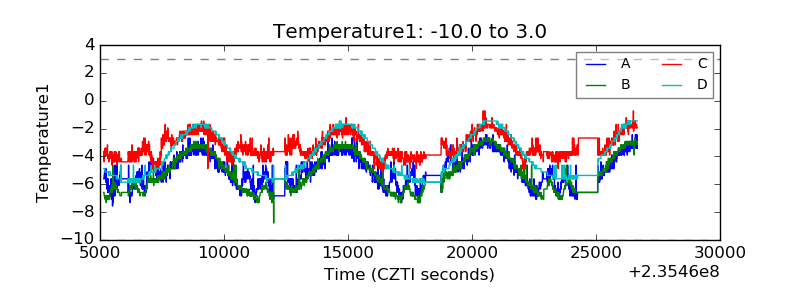 |
| Veto HV Monitor | 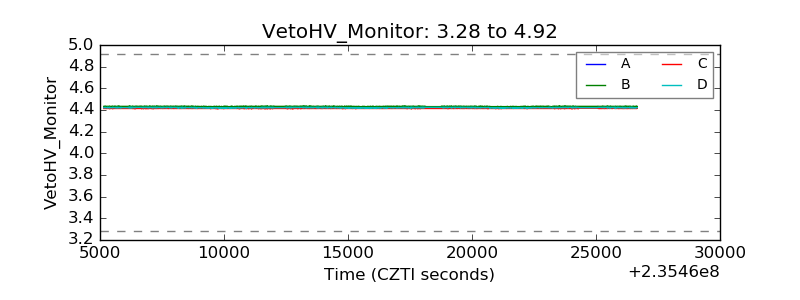 |
| Veto LLD | 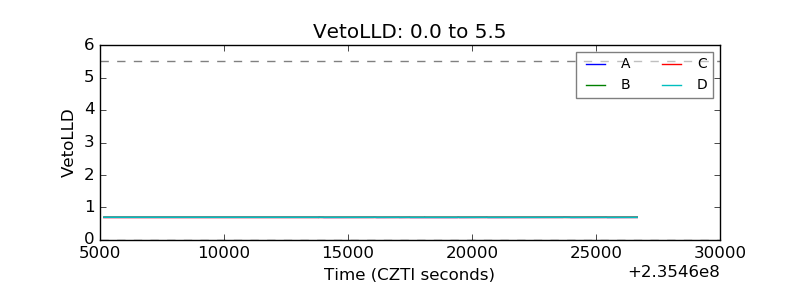 |
| Alpha Counter |  |
| _CPM_Rate | 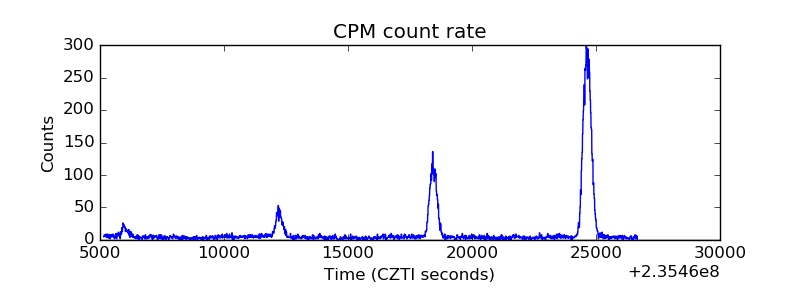 |
| CZT Counter | 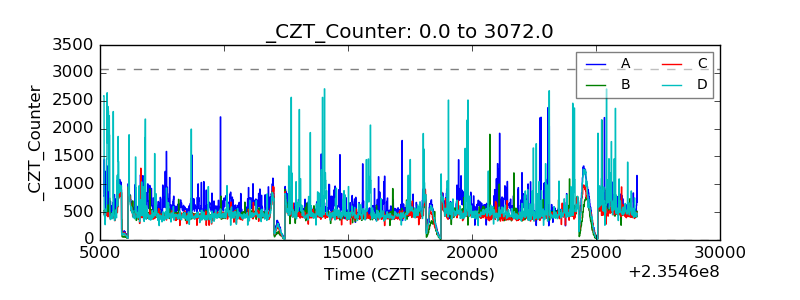 |
| +2.5 Volts monitor |  |
| +5 Volts monitor |  |
| _ROLL_ROT | 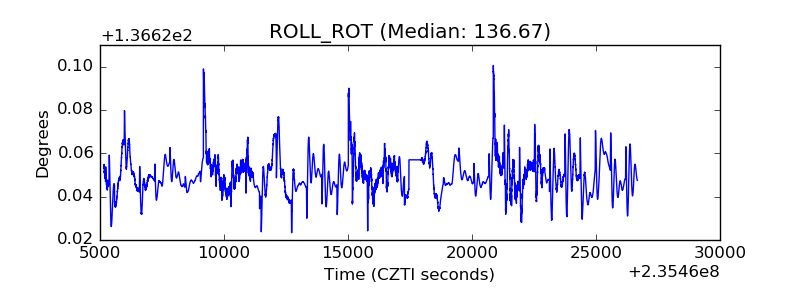 |
| _Roll_DEC | 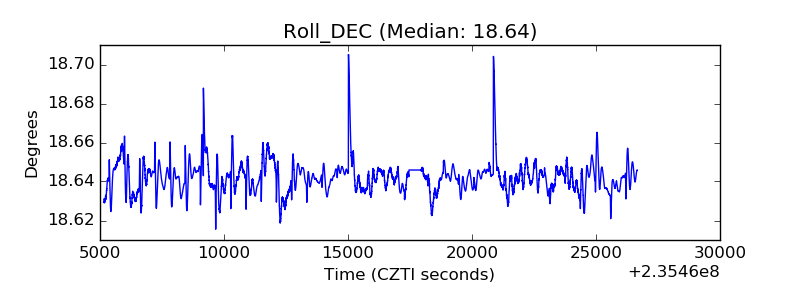 |
| _Roll_RA | 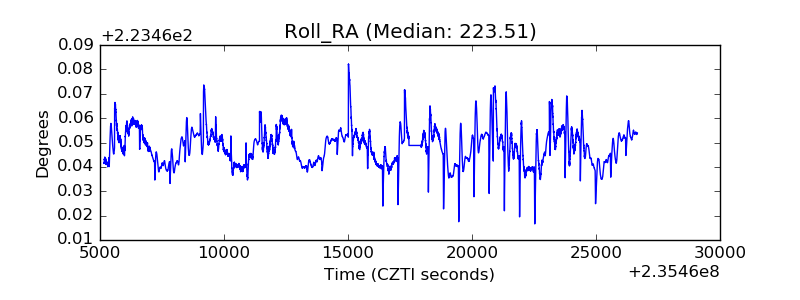 |
| Veto Counter | 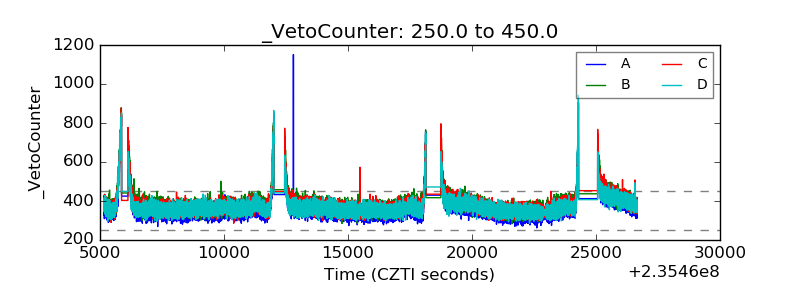 |