| Param | Original file | Final file |
|---|---|---|
| Filename | modeM0/AS1G07_002T01_9000001316_09316cztM0_level2.evt | modeM0/AS1G07_002T01_9000001316_09316cztM0_level2_quad_clean.evt |
| Size (bytes) | 501,235,200 | 91,457,280 |
| Size | 478.0 MB | 87.2 MB |
| Events in quadrant A | 4,609,101 | 578,072 |
| Events in quadrant B | 3,302,191 | 596,548 |
| Events in quadrant C | 2,921,192 | 586,674 |
| Events in quadrant D | 3,915,359 | 564,004 |
| Mode M9 | |||
|---|---|---|---|
| Quadrant | BADHDUFLAG | Total packets | Discarded packets |
| A | 0 | 9 | 0 |
| B | 0 | 9 | 0 |
| C | 0 | 9 | 0 |
| D | 0 | 9 | 0 |
| Mode M0 | |||
|---|---|---|---|
| Quadrant | BADHDUFLAG | Total packets | Discarded packets |
| A | 0 | 18036 | 20 |
| B | 0 | 13972 | 9 |
| C | 0 | 12981 | 5 |
| D | 0 | 15853 | 3 |
| Mode SS | |||
|---|---|---|---|
| Quadrant | BADHDUFLAG | Total packets | Discarded packets |
| A | 0 | 130 | 0 |
| B | 0 | 130 | 0 |
| C | 0 | 130 | 0 |
| D | 0 | 130 | 0 |
| Quadrant | Total seconds | Saturated seconds | Saturation percentage |
|---|---|---|---|
| A | 6363 | 398 | 6.254911% |
| B | 6366 | 99 | 1.555137% |
| C | 6365 | 38 | 0.597015% |
| D | 6366 | 217 | 3.408734% |
Noise dominated data is calculated using 1-second bins in cleaned event files. If a bin has >2000 counts, and if more than 50% of those come from <1% of pixels, then it is considered to be noise-dominated and hence unusable.
| Quadrant | # 1 sec bins | Bins with >0 counts | Bins with >2000 counts | High rate bins dominated by noise | Noise dominated (total time) | Noise dominated (detector-on time) | Marked lightcurve |
|---|---|---|---|---|---|---|---|
| A | 7317 | 6368 | 169 | 169 | 2.31% | 2.65% | 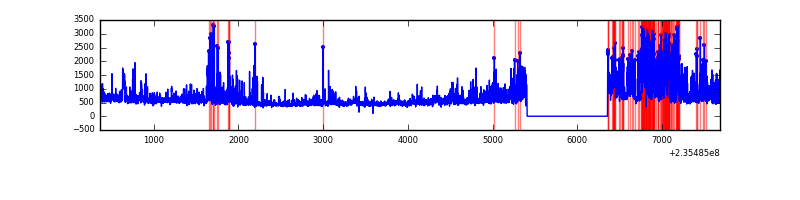 |
| B | 7317 | 6368 | 27 | 27 | 0.37% | 0.42% | 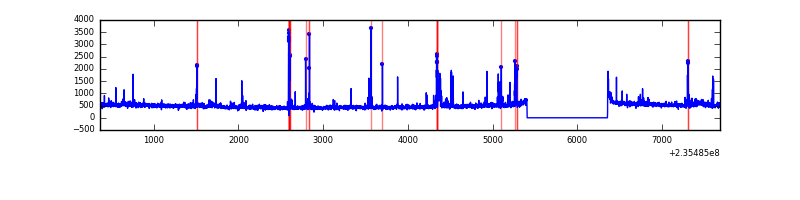 |
| C | 7317 | 6368 | 0 | 0 | 0.00% | 0.00% | 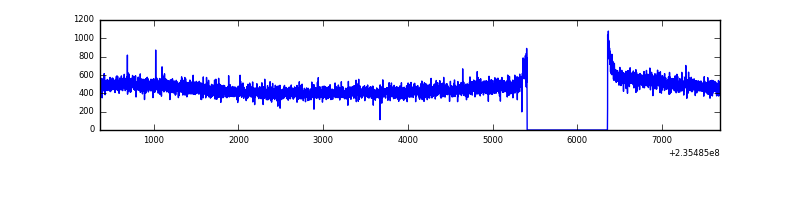 |
| D | 7317 | 6367 | 136 | 136 | 1.86% | 2.14% | 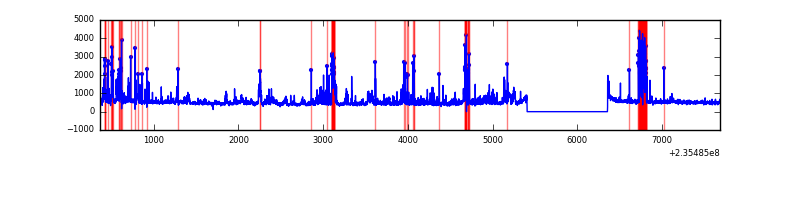 |
Top three noisy pixels from each quadrant. If the there are fewer than three noisy pixels in the level2.evt file, extra rows are filled as -1
| Pixel properties | Quadrant properties | ||||||
|---|---|---|---|---|---|---|---|
| Quadrant | DetID | PixID | Counts | Sigma | Mean | Median | Sigma |
| A | 8 | 5 | 1592103 | 10410.08 | 755 | 739 | 152.9 |
| A | 12 | 236 | 71362 | 461.99 | 755 | 739 | 152.9 |
| A | 1 | 162 | 27990 | 178.27 | 755 | 739 | 152.9 |
| B | 10 | 245 | 247686 | 1668.36 | 764 | 744 | 148.0 |
| B | 0 | 219 | 50924 | 339.02 | 764 | 744 | 148.0 |
| B | 4 | 173 | 23553 | 154.1 | 764 | 744 | 148.0 |
| C | 13 | 61 | 5334 | 26.35 | 747 | 750 | 173.9 |
| C | 14 | 67 | 3060 | 13.28 | 747 | 750 | 173.9 |
| C | 8 | 222 | 2689 | 11.15 | 747 | 750 | 173.9 |
| D | 1 | 52 | 784910 | 4307.84 | 735 | 714 | 182.0 |
| D | 10 | 172 | 153869 | 841.33 | 735 | 714 | 182.0 |
| D | 12 | 227 | 89836 | 489.58 | 735 | 714 | 182.0 |
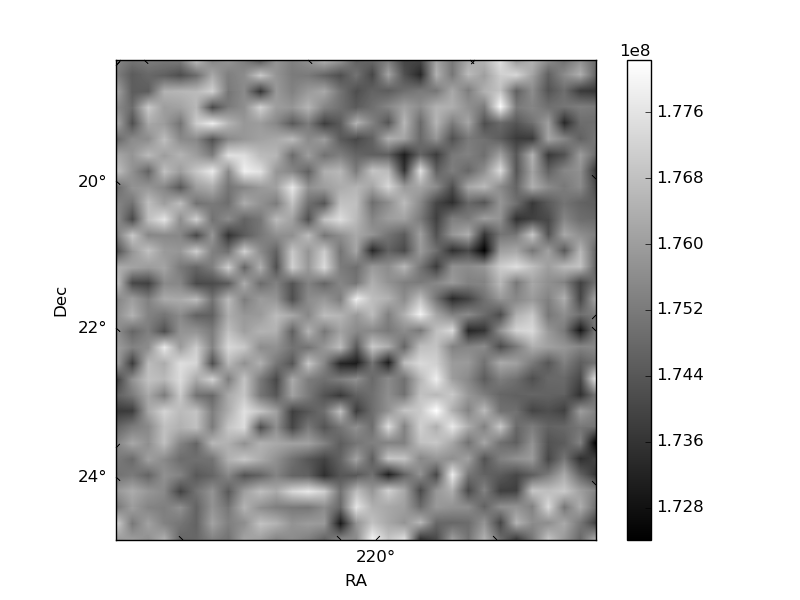
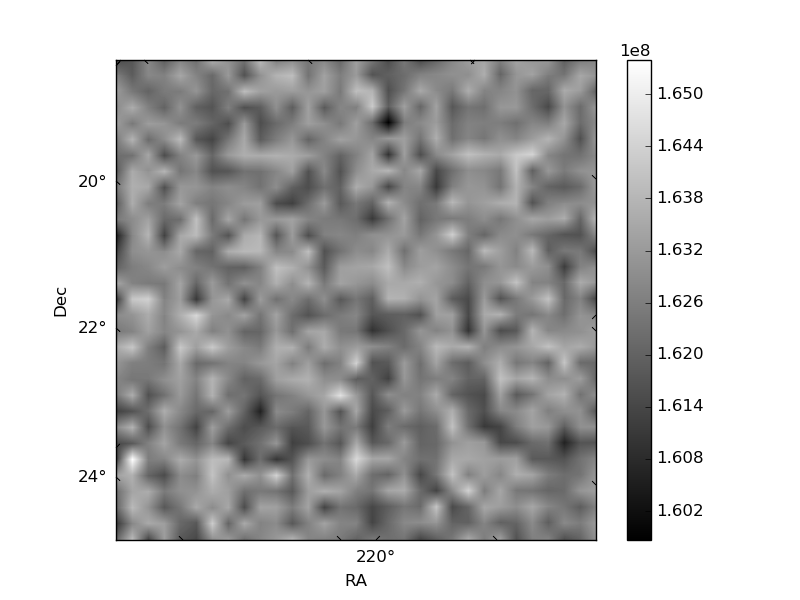
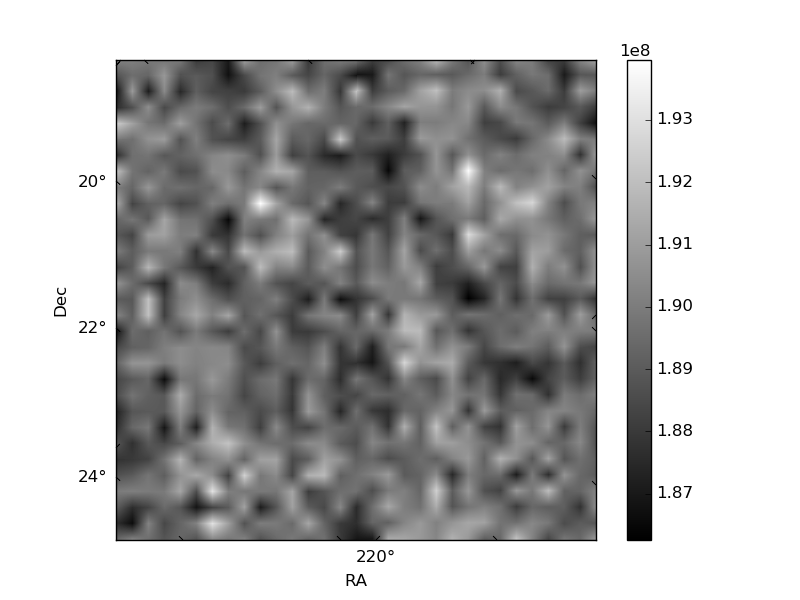
Histogram calculated using DETX and DETY for each event in the final _common_clean file
| Quadrant A | 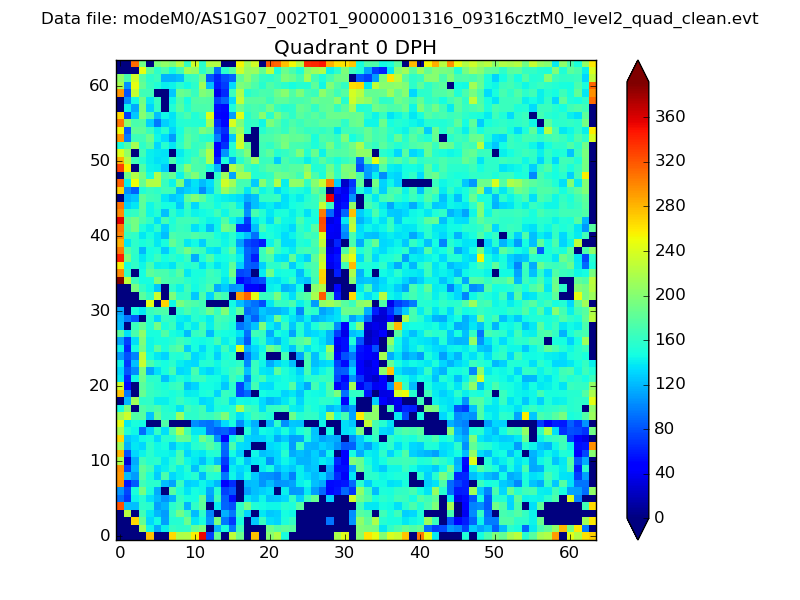 |
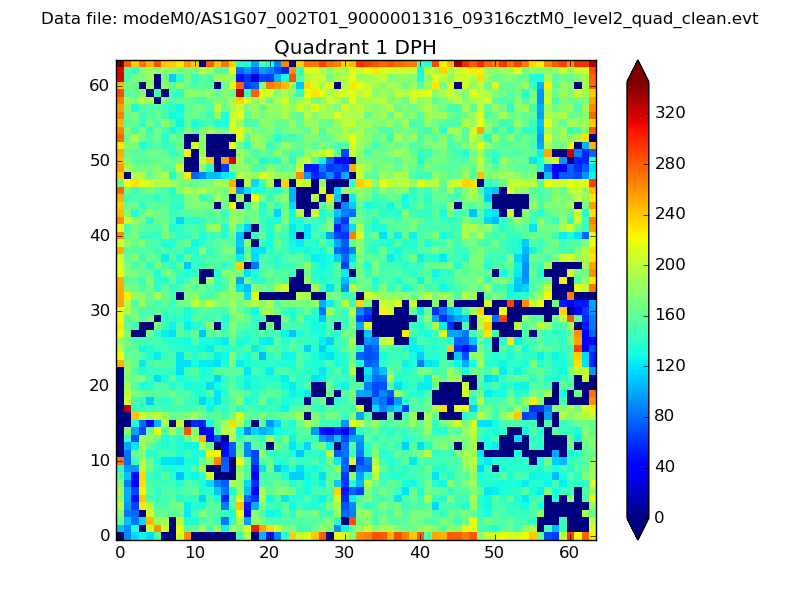 |
Quadrant B |
|---|---|---|---|
| Quadrant D | 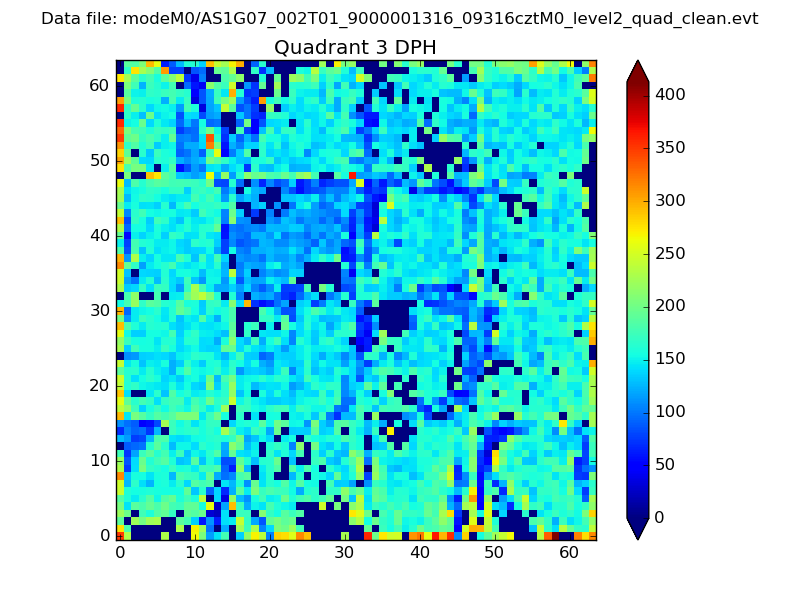 |
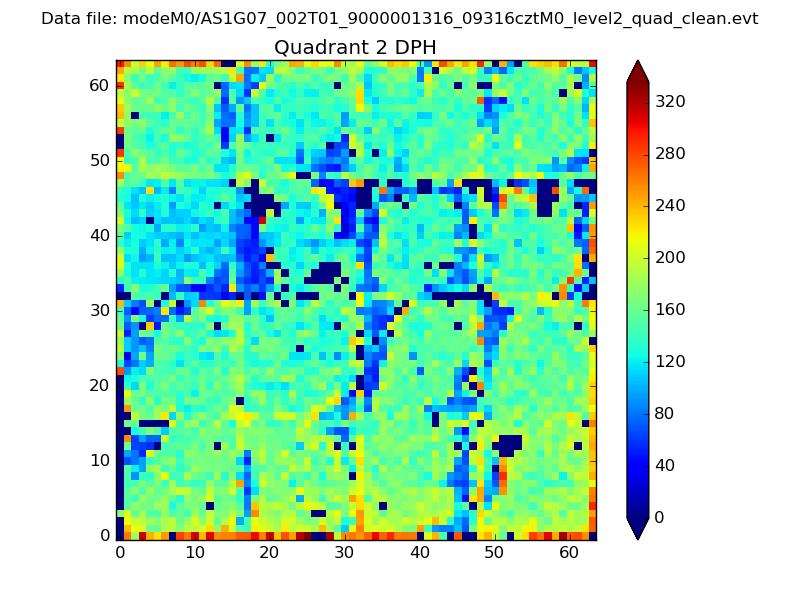 |
Quadrant C |
| Plot type | Count rate plots | Images |
|---|---|---|
| Comparison with Poisson distribution Blue bars denote a histogram of data divided into 1 sec bins. Red curve is a Poisson curve with rate = median count rate of data. |
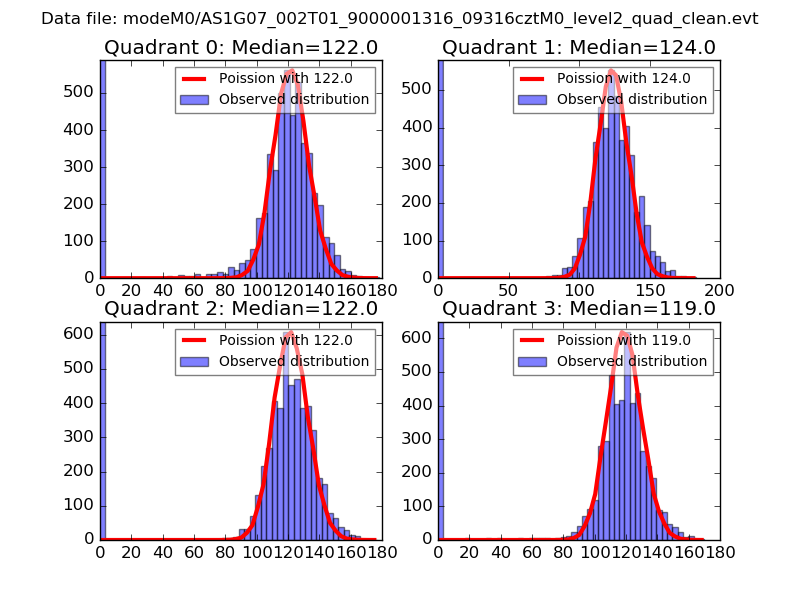 |
 |
| Quadrant-wise count rates Data is divided into 100 sec bins |
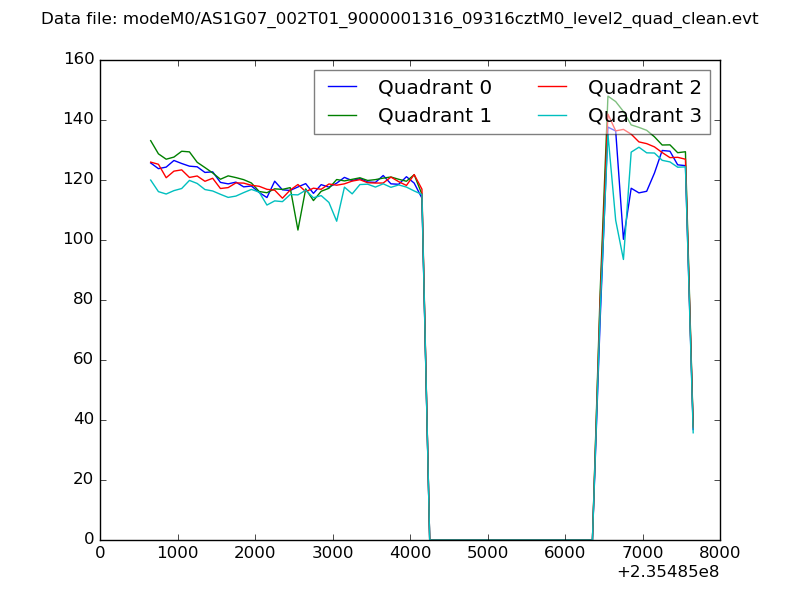 |
|
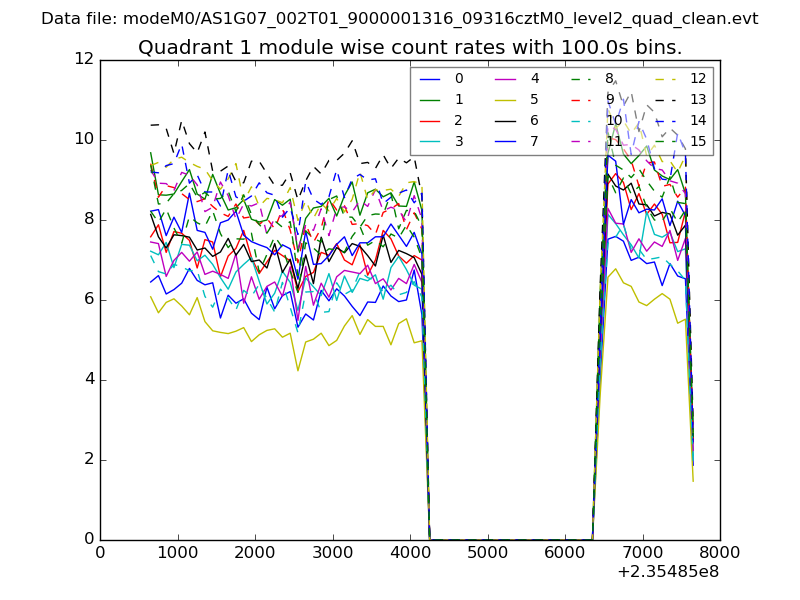
| Module-wise count rates for Quadrant A Data is divided into 100 sec bins |
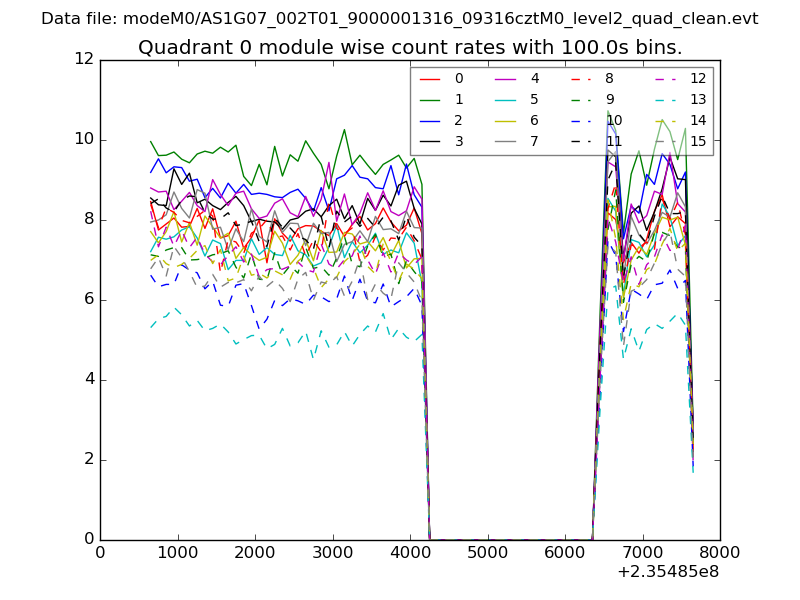 |
 |
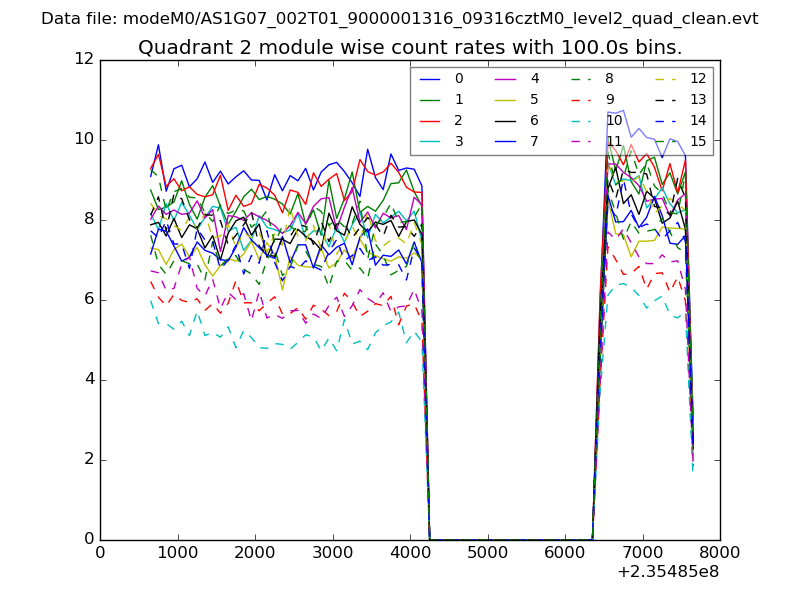
| Module-wise count rates for Quadrant B Data is divided into 100 sec bins |
 |
 |
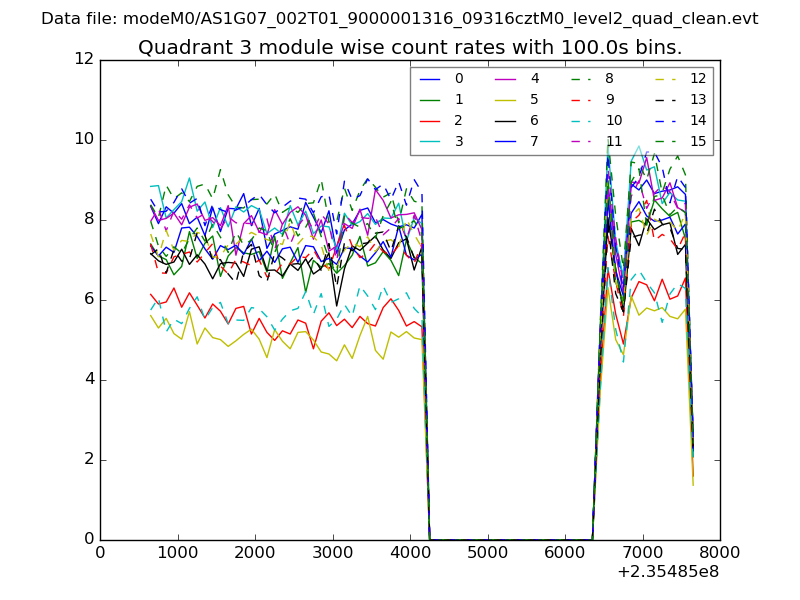
| Module-wise count rates for Quadrant C Data is divided into 100 sec bins |
 |
 |
| Module-wise count rates for Quadrant D Data is divided into 100 sec bins |
 |
 |
| Parameter | Plot |
|---|---|
| CZT HV Monitor | 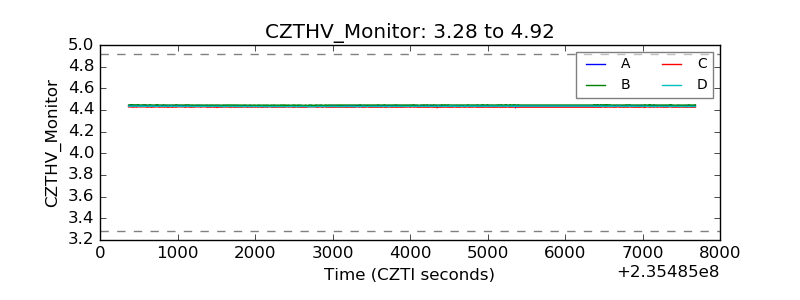 |
| D_VDD | 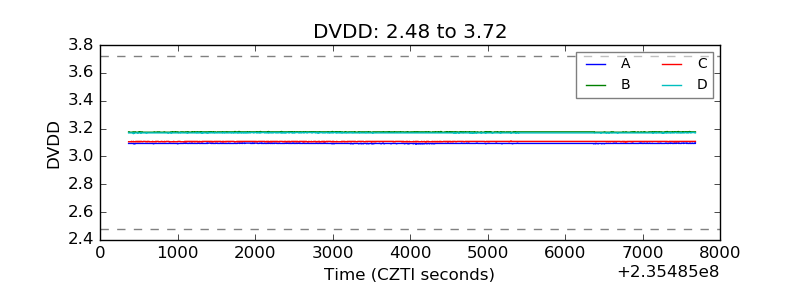 |
| Temperature 1 | 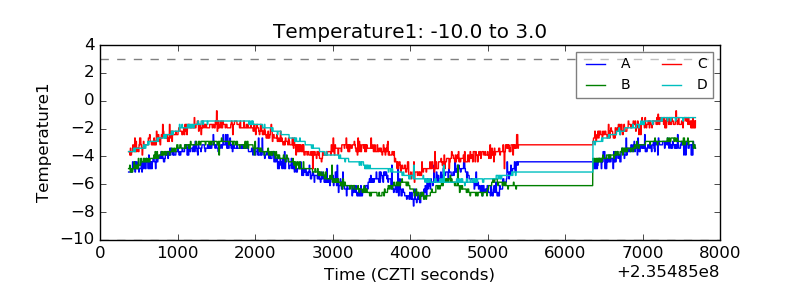 |
| Veto HV Monitor | 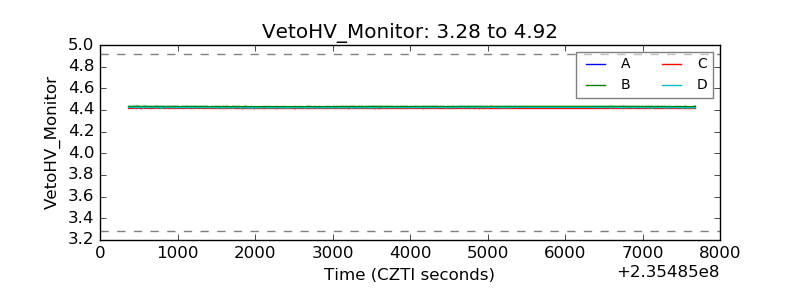 |
| Veto LLD | 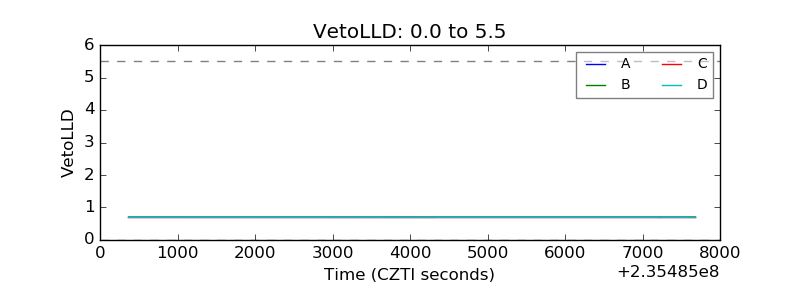 |
| Alpha Counter | 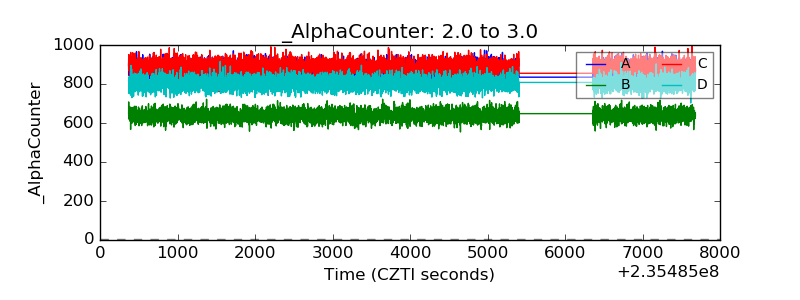 |
| _CPM_Rate | 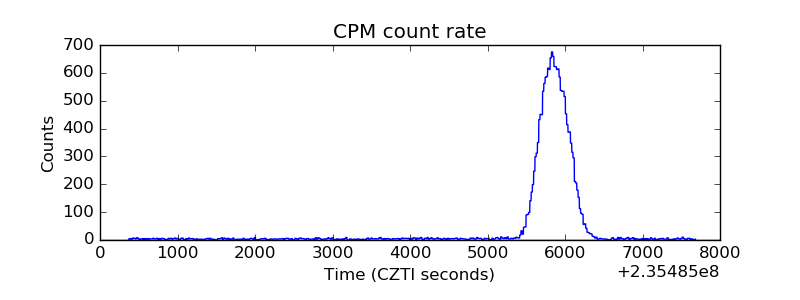 |
| CZT Counter | 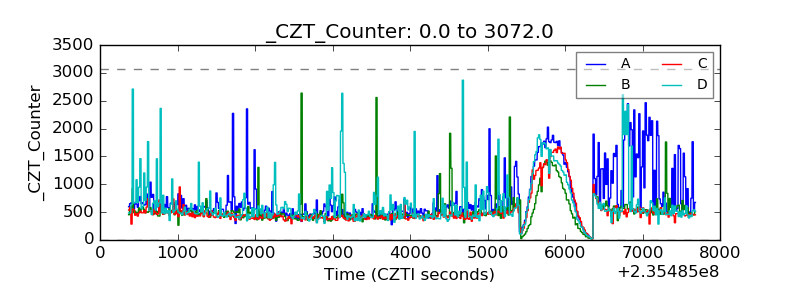 |
| +2.5 Volts monitor |  |
| +5 Volts monitor |  |
| _ROLL_ROT |  |
| _Roll_DEC | 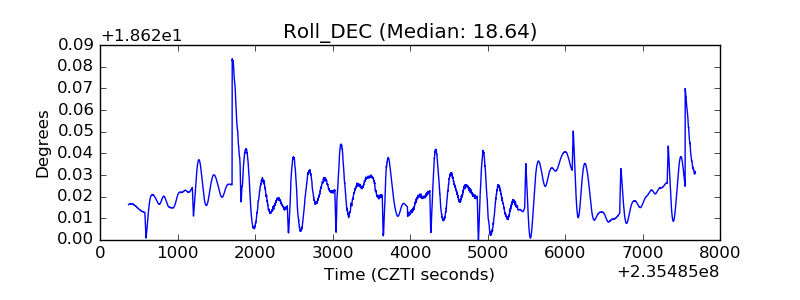 |
| _Roll_RA |  |
| Veto Counter | 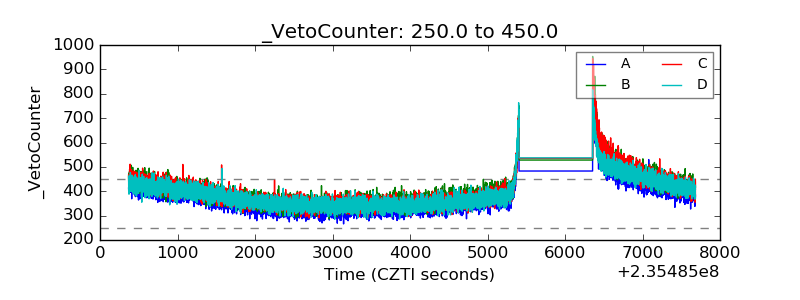 |