| Param | Original file | Final file |
|---|---|---|
| Filename | modeM0/AS1G07_002T01_9000001316_09319cztM0_level2.evt | modeM0/AS1G07_002T01_9000001316_09319cztM0_level2_quad_clean.evt |
| Size (bytes) | 452,001,600 | 93,412,800 |
| Size | 431.1 MB | 89.1 MB |
| Events in quadrant A | 3,456,395 | 604,128 |
| Events in quadrant B | 3,217,938 | 609,149 |
| Events in quadrant C | 2,932,405 | 603,537 |
| Events in quadrant D | 3,662,306 | 580,635 |
| Mode M9 | |||
|---|---|---|---|
| Quadrant | BADHDUFLAG | Total packets | Discarded packets |
| A | 0 | 12 | 0 |
| B | 0 | 12 | 0 |
| C | 0 | 12 | 0 |
| D | 0 | 12 | 0 |
| Mode M0 | |||
|---|---|---|---|
| Quadrant | BADHDUFLAG | Total packets | Discarded packets |
| A | 0 | 14362 | 2 |
| B | 0 | 13698 | 1 |
| C | 0 | 12816 | 3 |
| D | 0 | 15252 | 1 |
| Mode SS | |||
|---|---|---|---|
| Quadrant | BADHDUFLAG | Total packets | Discarded packets |
| A | 0 | 126 | 0 |
| B | 0 | 126 | 0 |
| C | 0 | 126 | 0 |
| D | 0 | 126 | 0 |
| Quadrant | Total seconds | Saturated seconds | Saturation percentage |
|---|---|---|---|
| A | 6180 | 58 | 0.938511% |
| B | 6180 | 79 | 1.278317% |
| C | 6179 | 45 | 0.728273% |
| D | 6180 | 180 | 2.912621% |
Noise dominated data is calculated using 1-second bins in cleaned event files. If a bin has >2000 counts, and if more than 50% of those come from <1% of pixels, then it is considered to be noise-dominated and hence unusable.
| Quadrant | # 1 sec bins | Bins with >0 counts | Bins with >2000 counts | High rate bins dominated by noise | Noise dominated (total time) | Noise dominated (detector-on time) | Marked lightcurve |
|---|---|---|---|---|---|---|---|
| A | 7400 | 6181 | 4 | 4 | 0.05% | 0.06% | 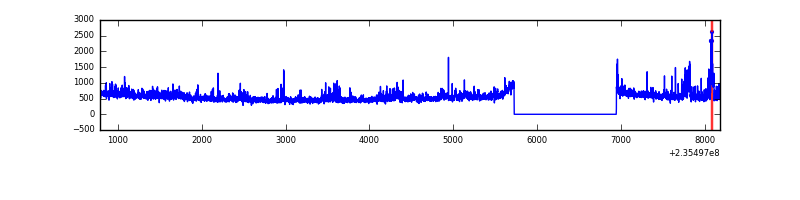 |
| B | 7400 | 6181 | 20 | 20 | 0.27% | 0.32% | 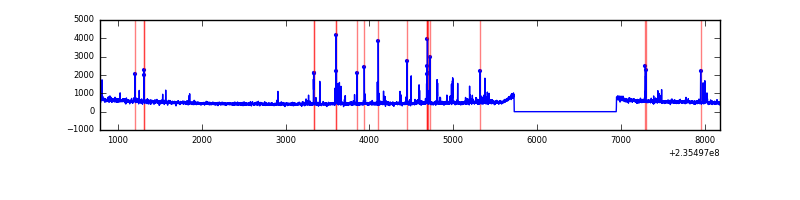 |
| C | 7400 | 6181 | 0 | 0 | 0.00% | 0.00% | 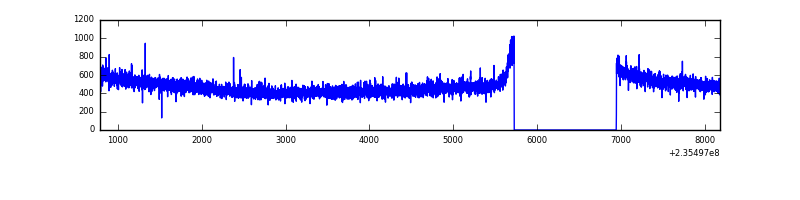 |
| D | 7400 | 6181 | 113 | 113 | 1.53% | 1.83% | 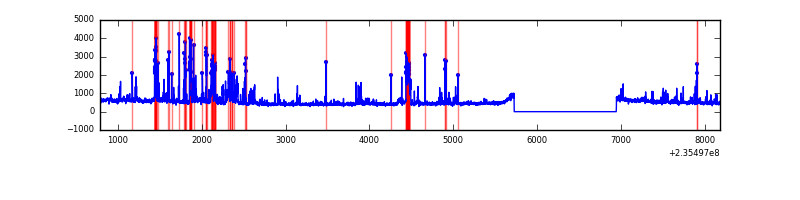 |
Top three noisy pixels from each quadrant. If the there are fewer than three noisy pixels in the level2.evt file, extra rows are filled as -1
| Pixel properties | Quadrant properties | ||||||
|---|---|---|---|---|---|---|---|
| Quadrant | DetID | PixID | Counts | Sigma | Mean | Median | Sigma |
| A | 8 | 5 | 475596 | 3079.43 | 762 | 748 | 154.2 |
| A | 1 | 162 | 32413 | 205.35 | 762 | 748 | 154.2 |
| A | 0 | 226 | 7080 | 41.06 | 762 | 748 | 154.2 |
| B | 10 | 245 | 163917 | 1125.28 | 763 | 744 | 145.0 |
| B | 8 | 234 | 33640 | 226.86 | 763 | 744 | 145.0 |
| B | 0 | 187 | 28773 | 193.29 | 763 | 744 | 145.0 |
| C | 13 | 61 | 5708 | 28.57 | 749 | 753 | 173.4 |
| C | 14 | 67 | 5421 | 26.92 | 749 | 753 | 173.4 |
| C | 9 | 68 | 3608 | 16.46 | 749 | 753 | 173.4 |
| D | 12 | 227 | 439378 | 2451.94 | 740 | 724 | 178.9 |
| D | 1 | 52 | 218646 | 1218.12 | 740 | 724 | 178.9 |
| D | 10 | 172 | 115971 | 644.19 | 740 | 724 | 178.9 |
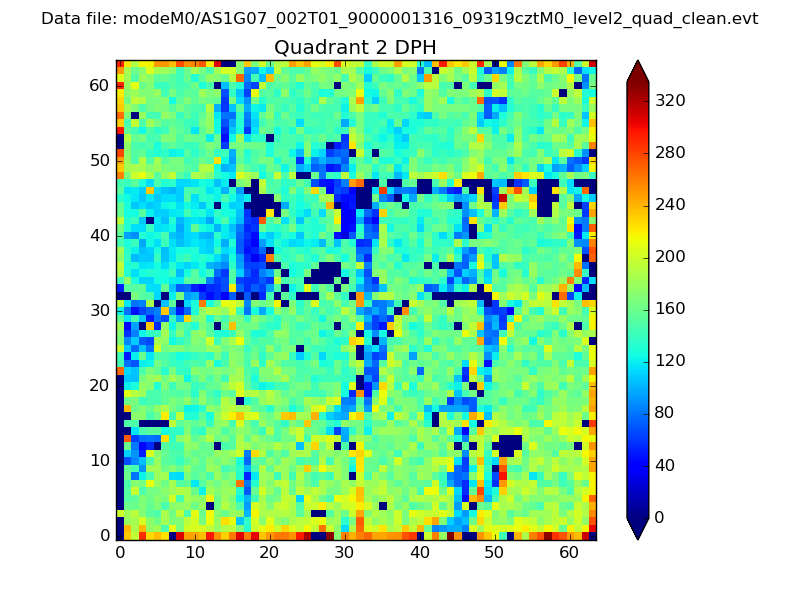
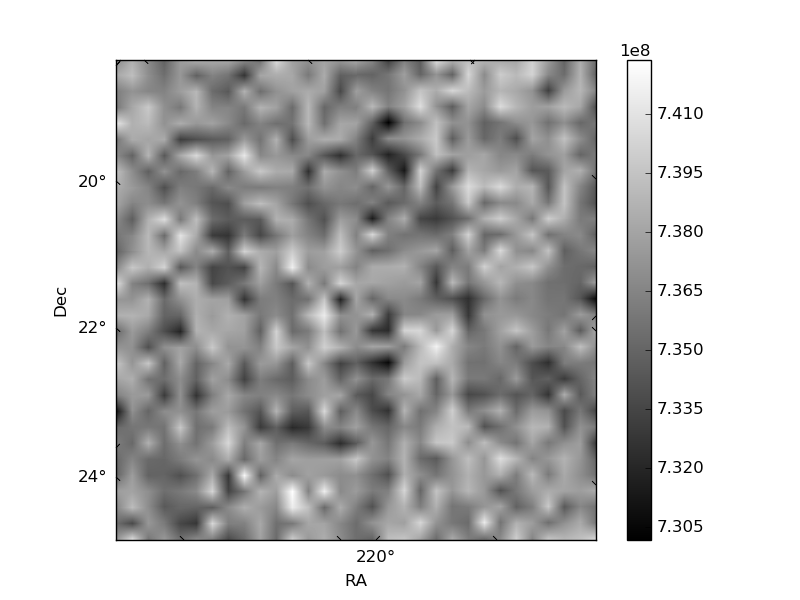
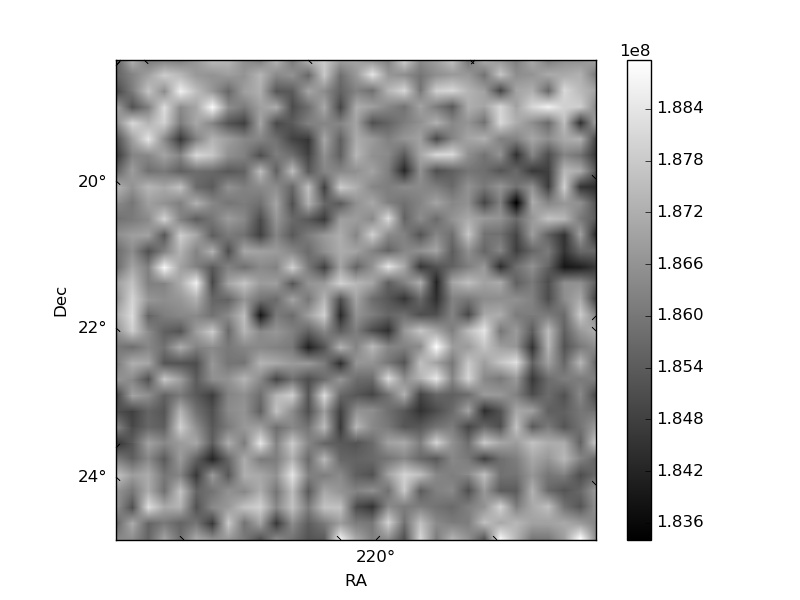
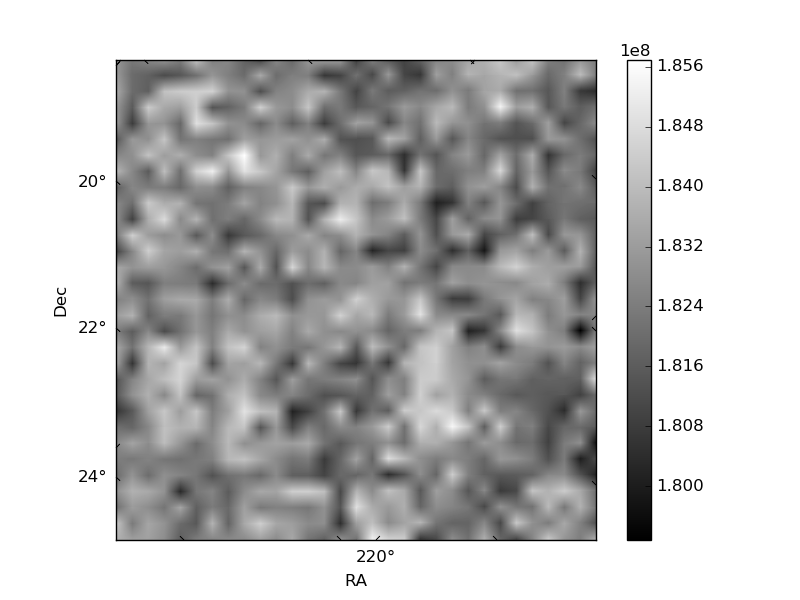
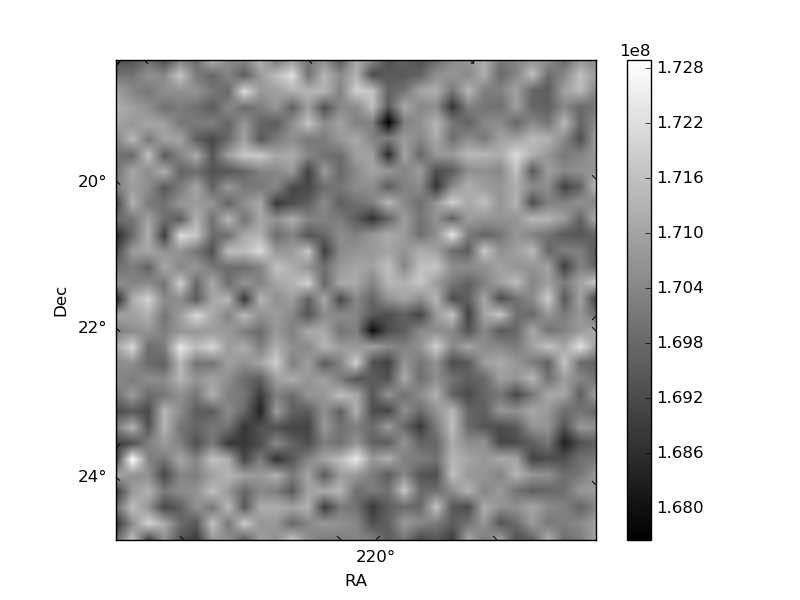
Histogram calculated using DETX and DETY for each event in the final _common_clean file
| Quadrant A | 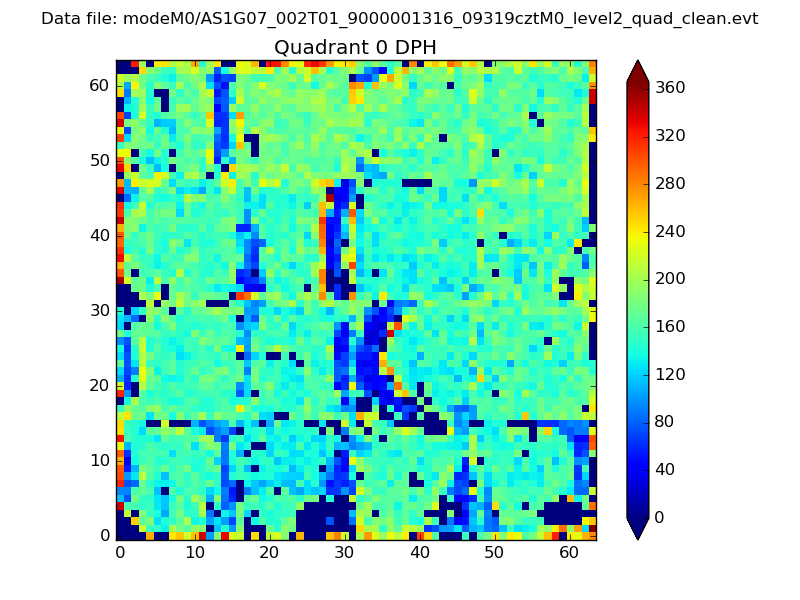 |
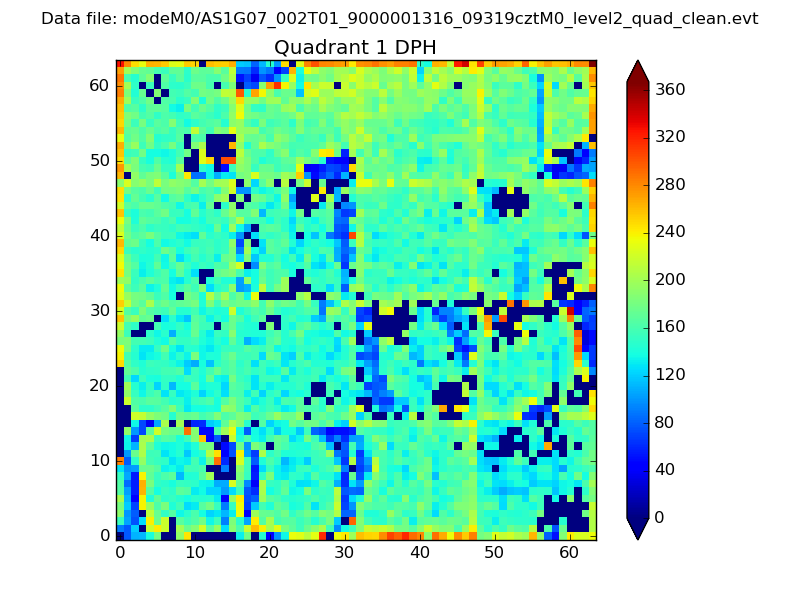 |
Quadrant B |
|---|---|---|---|
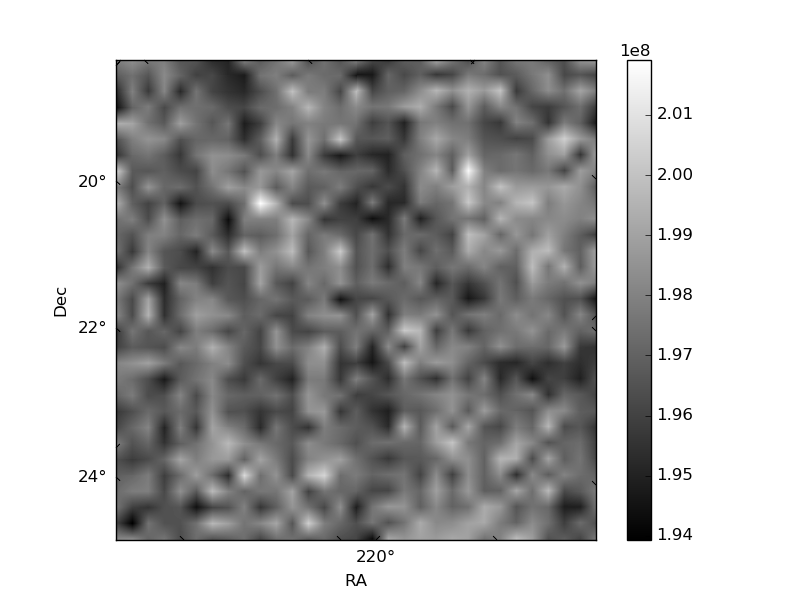
| Quadrant D | 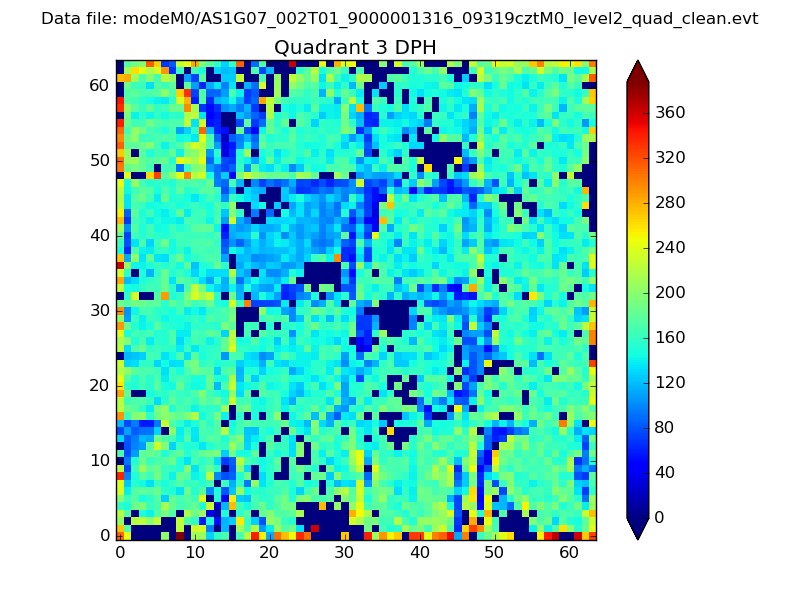 |
 |
Quadrant C |
| Plot type | Count rate plots | Images |
|---|---|---|
| Comparison with Poisson distribution Blue bars denote a histogram of data divided into 1 sec bins. Red curve is a Poisson curve with rate = median count rate of data. |
 |
 |
| Quadrant-wise count rates Data is divided into 100 sec bins |
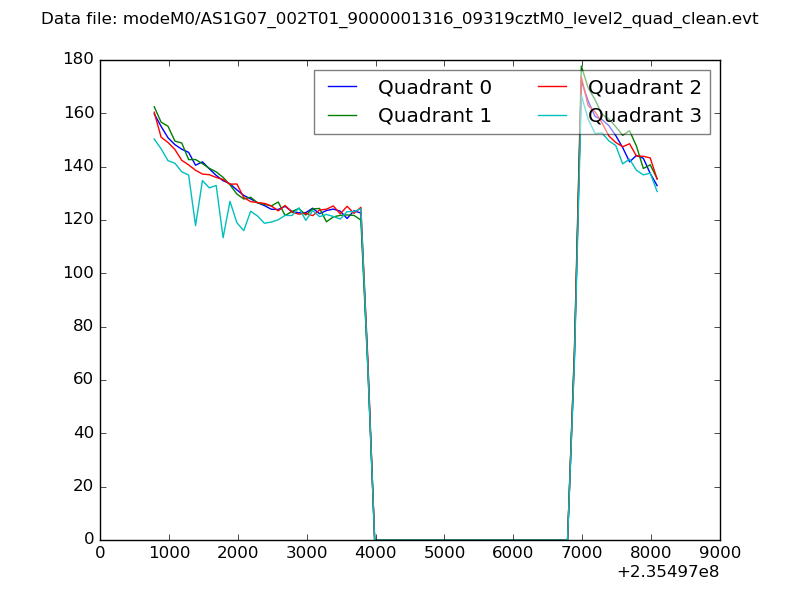 |
|
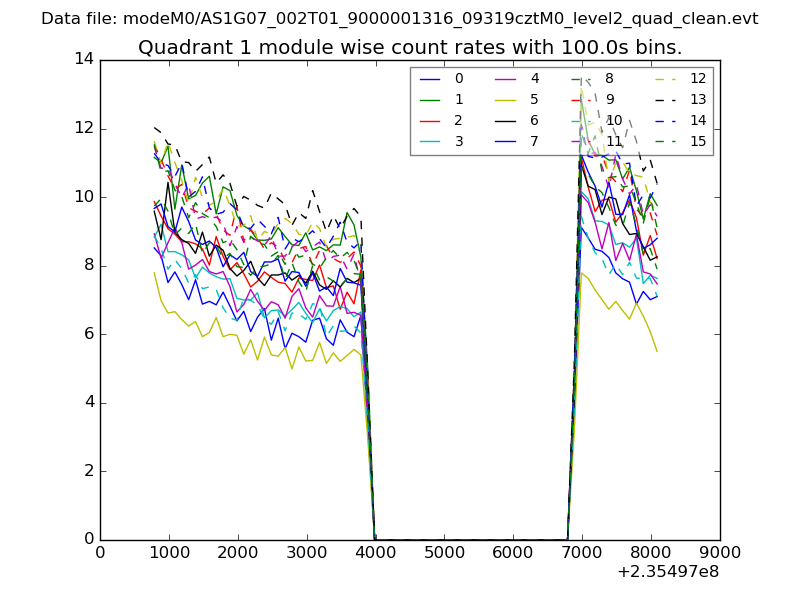
| Module-wise count rates for Quadrant A Data is divided into 100 sec bins |
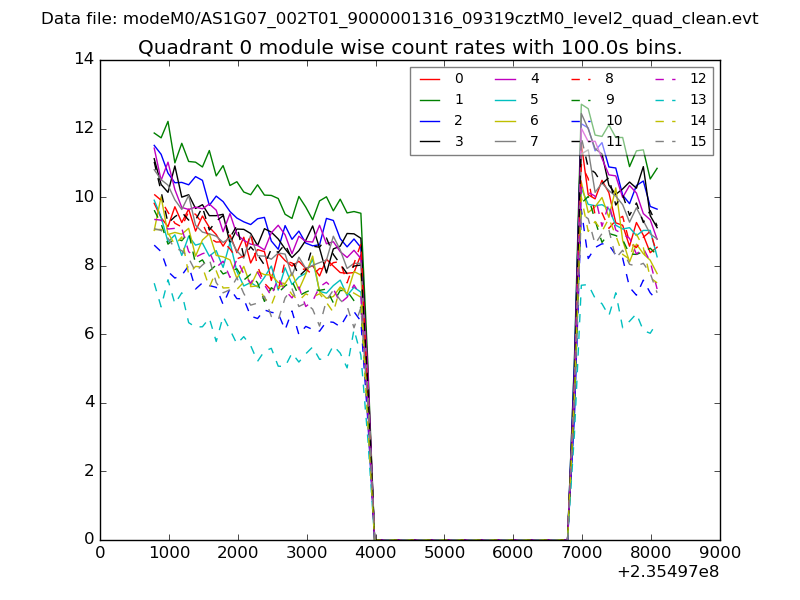 |
 |
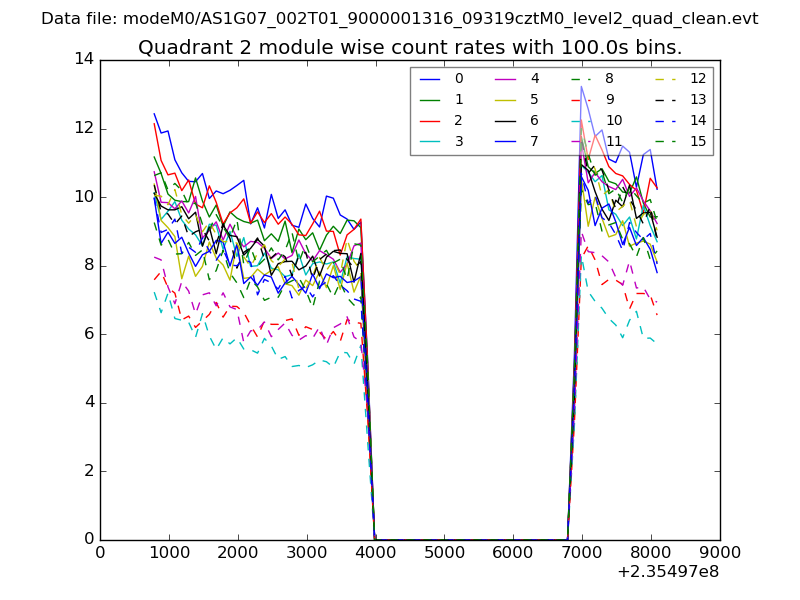
| Module-wise count rates for Quadrant B Data is divided into 100 sec bins |
 |
 |
| Module-wise count rates for Quadrant C Data is divided into 100 sec bins |
 |
 |
| Module-wise count rates for Quadrant D Data is divided into 100 sec bins |
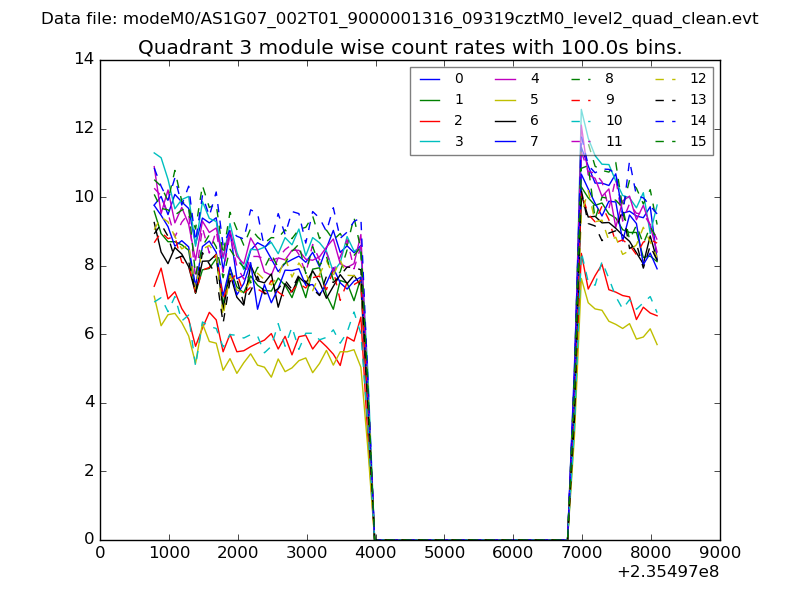 |
 |
| Parameter | Plot |
|---|---|
| CZT HV Monitor | 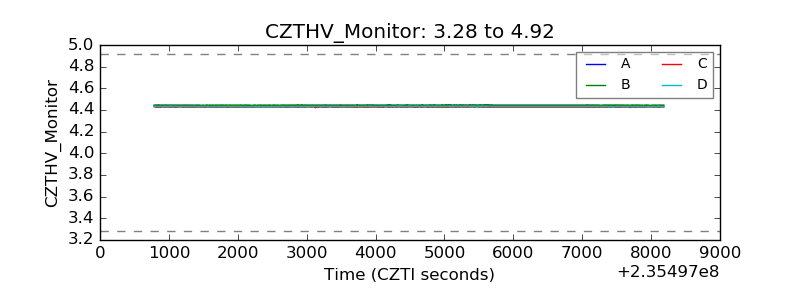 |
| D_VDD | 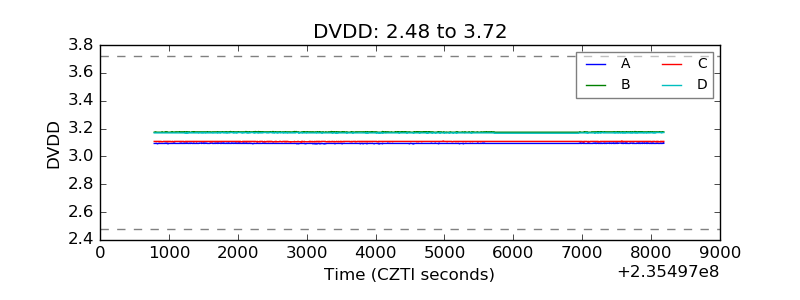 |
| Temperature 1 | 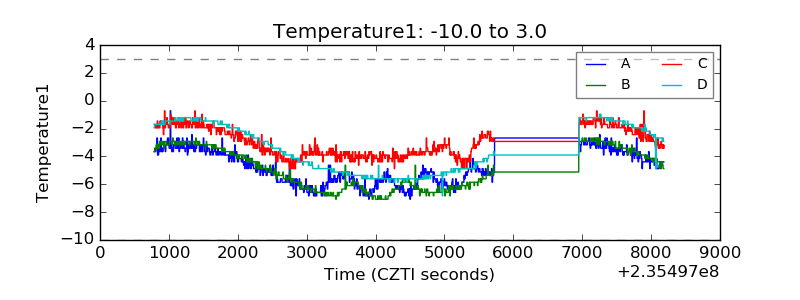 |
| Veto HV Monitor | 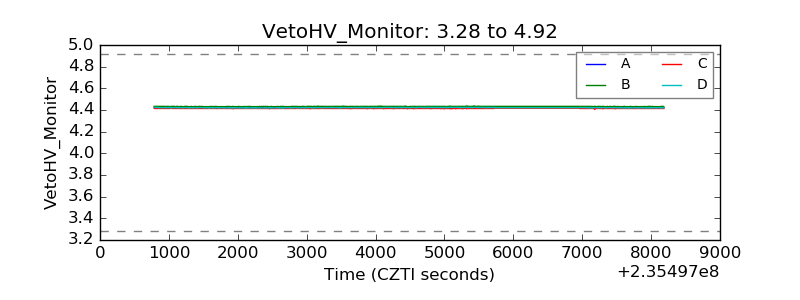 |
| Veto LLD | 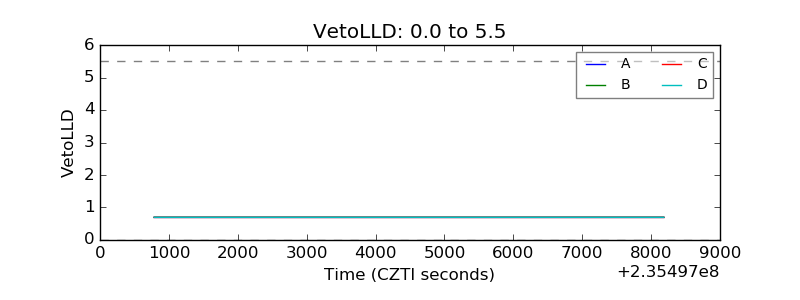 |
| Alpha Counter | 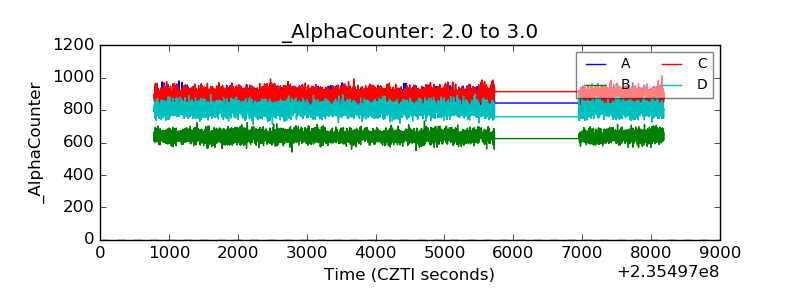 |
| _CPM_Rate | 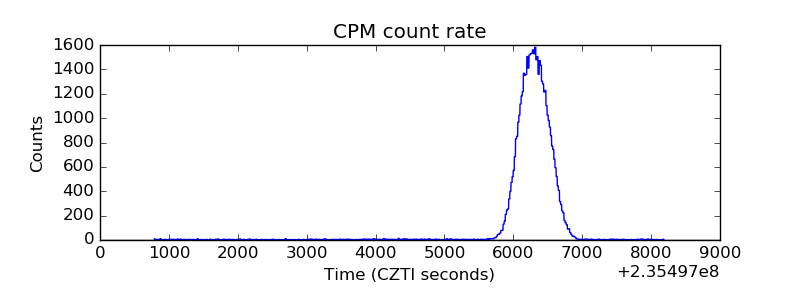 |
| CZT Counter | 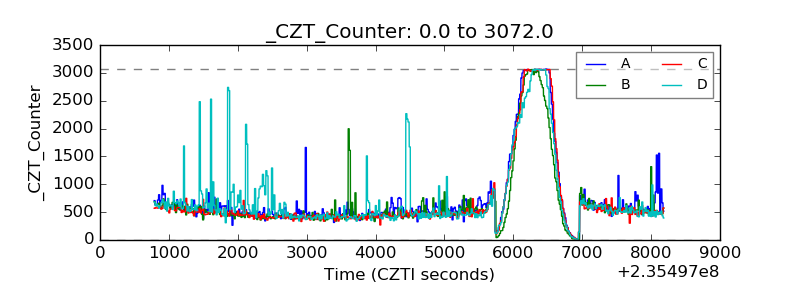 |
| +2.5 Volts monitor | 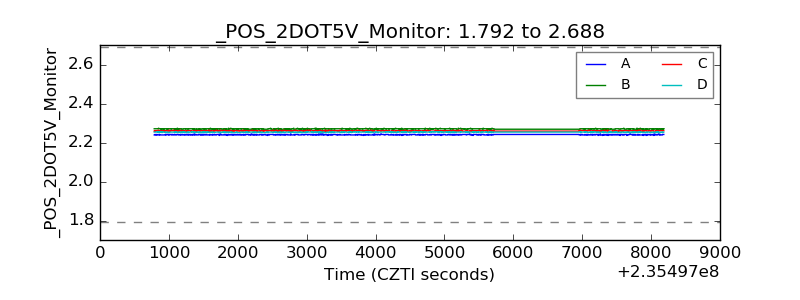 |
| +5 Volts monitor |  |
| _ROLL_ROT | 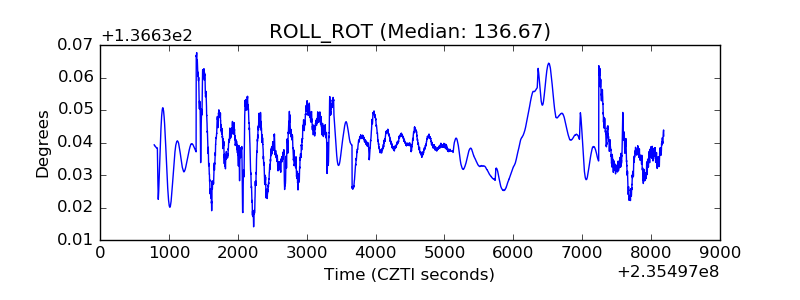 |
| _Roll_DEC | 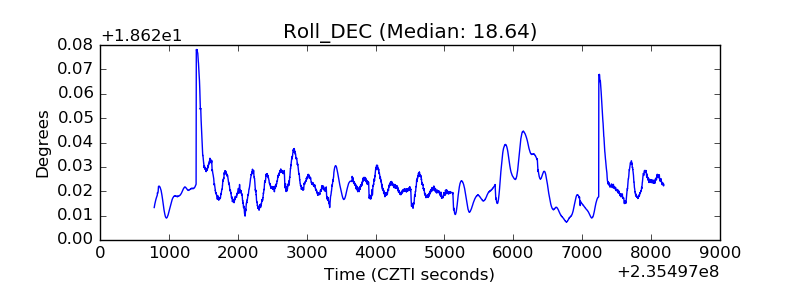 |
| _Roll_RA | 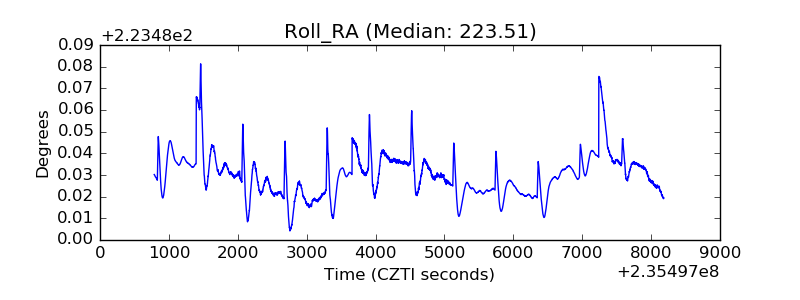 |
| Veto Counter | 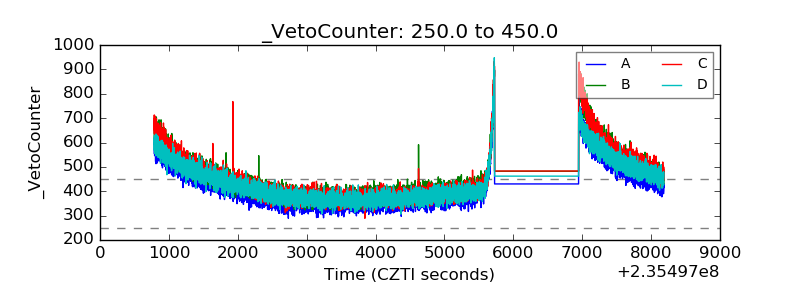 |