| Param | Original file | Final file |
|---|---|---|
| Filename | modeM0/AS1G07_009T01_9000001318cztM0_level2.fits | modeM0/AS1G07_009T01_9000001318cztM0_level2_quad_clean.evt |
| Size (bytes) | 455,425,920 | 427,057,920 |
| Size | 434.3 MB | 407.3 MB |
| Events in quadrant A | 2,703,500 | 2,476,098 |
| Events in quadrant B | 2,670,277 | 2,522,309 |
| Events in quadrant C | 2,729,318 | 2,391,785 |
| Events in quadrant D | 2,324,988 | 2,183,076 |
| Mode M9 | |||
|---|---|---|---|
| Quadrant | BADHDUFLAG | Total packets | Discarded packets |
| A | 0 | 74 | 0 |
| B | 0 | 76 | 0 |
| C | 0 | 73 | 0 |
| D | 0 | 75 | 0 |
| Mode M0 | |||
|---|---|---|---|
| Quadrant | BADHDUFLAG | Total packets | Discarded packets |
| A | 0 | 110044 | 0 |
| B | 0 | 103194 | 0 |
| C | 0 | 100605 | 0 |
| D | 0 | 117368 | 0 |
| Mode SS | |||
|---|---|---|---|
| Quadrant | BADHDUFLAG | Total packets | Discarded packets |
| A | 0 | 1016 | 0 |
| B | 0 | 1018 | 0 |
| C | 0 | 1017 | 0 |
| D | 0 | 988 | 0 |
| Quadrant | Total seconds | Saturated seconds | Saturation percentage |
|---|---|---|---|
| A | 48627 | 750 | 1.542353% |
| B | 48997 | 753 | 1.536829% |
| C | 49071 | 413 | 0.841638% |
| D | 48831 | 1813 | 3.712805% |
Noise dominated data is calculated using 1-second bins in cleaned event files. If a bin has >2000 counts, and if more than 50% of those come from <1% of pixels, then it is considered to be noise-dominated and hence unusable.
| Quadrant | # 1 sec bins | Bins with >0 counts | Bins with >2000 counts | High rate bins dominated by noise | Noise dominated (total time) | Noise dominated (detector-on time) | Marked lightcurve |
|---|---|---|---|---|---|---|---|
| A | 62855 | 51928 | 0 | 0 | 0.00% | 0.00% |  |
| B | 62855 | 52213 | 0 | 0 | 0.00% | 0.00% |  |
| C | 62855 | 52301 | 0 | 0 | 0.00% | 0.00% |  |
| D | 62855 | 52090 | 0 | 0 | 0.00% | 0.00% |  |
Top three noisy pixels from each quadrant. If the there are fewer than three noisy pixels in the level2.evt file, extra rows are filled as -1
| Pixel properties | Quadrant properties | ||||||
|---|---|---|---|---|---|---|---|
| Quadrant | DetID | PixID | Counts | Sigma | Mean | Median | Sigma |
| A | 0 | 29 | 2651 | 10.94 | 703 | 655 | 182.4 |
| A | 7 | 110 | 2365 | 9.37 | 703 | 655 | 182.4 |
| A | 0 | 30 | 2102 | 7.93 | 703 | 655 | 182.4 |
| B | 2 | 9 | 2301 | 11.42 | 703 | 666 | 143.1 |
| B | 12 | 226 | 1807 | 7.97 | 703 | 666 | 143.1 |
| B | 3 | 17 | 1806 | 7.96 | 703 | 666 | 143.1 |
| C | 1 | 80 | 2008 | 7.05 | 721 | 666 | 190.4 |
| C | 1 | 81 | 1985 | 6.93 | 721 | 666 | 190.4 |
| C | 3 | 126 | 1857 | 6.26 | 721 | 666 | 190.4 |
| D | 3 | 14 | 1789 | 6.6 | 661 | 598 | 180.4 |
| D | 3 | 31 | 1692 | 6.06 | 661 | 598 | 180.4 |
| D | 6 | 231 | 1659 | 5.88 | 661 | 598 | 180.4 |
Histogram calculated using DETX and DETY for each event in the final _common_clean file
| Quadrant A | 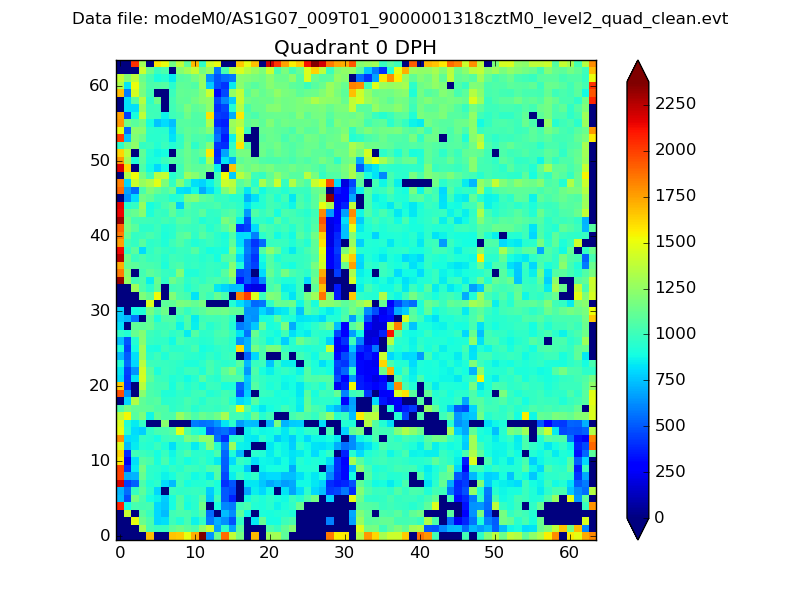 |
 |
Quadrant B |
|---|---|---|---|
| Quadrant D | 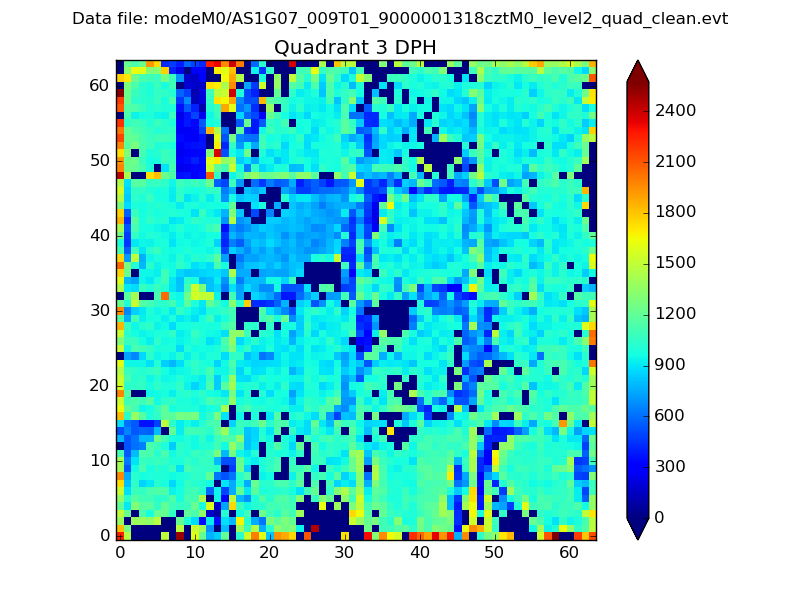 |
 |
Quadrant C |
| Plot type | Count rate plots | Images |
|---|---|---|
| Comparison with Poisson distribution Blue bars denote a histogram of data divided into 1 sec bins. Red curve is a Poisson curve with rate = median count rate of data. |
 |
 |
| Quadrant-wise count rates Data is divided into 100 sec bins |
 |
|
| Module-wise count rates for Quadrant A Data is divided into 100 sec bins |
 |
 |
| Module-wise count rates for Quadrant B Data is divided into 100 sec bins |
 |
 |
| Module-wise count rates for Quadrant C Data is divided into 100 sec bins |
 |
 |
| Module-wise count rates for Quadrant D Data is divided into 100 sec bins |
 |
 |
| Parameter | Plot |
|---|---|
| CZT HV Monitor |  |
| D_VDD |  |
| Temperature 1 |  |
| Veto HV Monitor |  |
| Veto LLD |  |
| Alpha Counter |  |
| _CPM_Rate |  |
| CZT Counter |  |
| +2.5 Volts monitor |  |
| +5 Volts monitor |  |
| _ROLL_ROT |  |
| _Roll_DEC |  |
| _Roll_RA |  |
| Veto Counter |  |