| Param | Original file | Final file |
|---|---|---|
| Filename | modeM0/AS1G07_009T01_9000001318_09320cztM0_level2.evt | modeM0/AS1G07_009T01_9000001318_09320cztM0_level2_quad_clean.evt |
| Size (bytes) | 291,752,640 | 53,997,120 |
| Size | 278.2 MB | 51.5 MB |
| Events in quadrant A | 2,336,324 | 351,937 |
| Events in quadrant B | 1,934,140 | 360,652 |
| Events in quadrant C | 1,722,726 | 354,911 |
| Events in quadrant D | 2,600,466 | 316,446 |
| Mode M9 | |||
|---|---|---|---|
| Quadrant | BADHDUFLAG | Total packets | Discarded packets |
| A | 0 | 13 | 0 |
| B | 0 | 13 | 0 |
| C | 0 | 13 | 0 |
| D | 0 | 13 | 0 |
| Mode M0 | |||
|---|---|---|---|
| Quadrant | BADHDUFLAG | Total packets | Discarded packets |
| A | 0 | 9339 | 2 |
| B | 0 | 8072 | 5 |
| C | 0 | 7498 | 3 |
| D | 0 | 10172 | 1 |
| Mode SS | |||
|---|---|---|---|
| Quadrant | BADHDUFLAG | Total packets | Discarded packets |
| A | 0 | 74 | 0 |
| B | 0 | 74 | 0 |
| C | 0 | 74 | 0 |
| D | 0 | 74 | 0 |
| Quadrant | Total seconds | Saturated seconds | Saturation percentage |
|---|---|---|---|
| A | 3538 | 84 | 2.374223% |
| B | 3537 | 81 | 2.290076% |
| C | 3537 | 32 | 0.904722% |
| D | 3538 | 352 | 9.949124% |
Noise dominated data is calculated using 1-second bins in cleaned event files. If a bin has >2000 counts, and if more than 50% of those come from <1% of pixels, then it is considered to be noise-dominated and hence unusable.
| Quadrant | # 1 sec bins | Bins with >0 counts | Bins with >2000 counts | High rate bins dominated by noise | Noise dominated (total time) | Noise dominated (detector-on time) | Marked lightcurve |
|---|---|---|---|---|---|---|---|
| A | 4852 | 3538 | 11 | 11 | 0.23% | 0.31% | 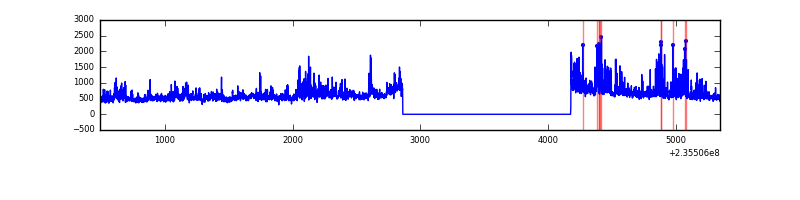 |
| B | 4853 | 3538 | 28 | 28 | 0.58% | 0.79% | 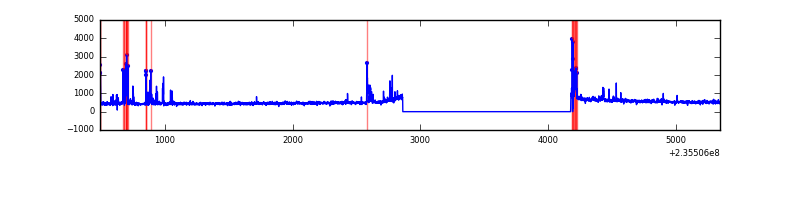 |
| C | 4852 | 3538 | 0 | 0 | 0.00% | 0.00% | 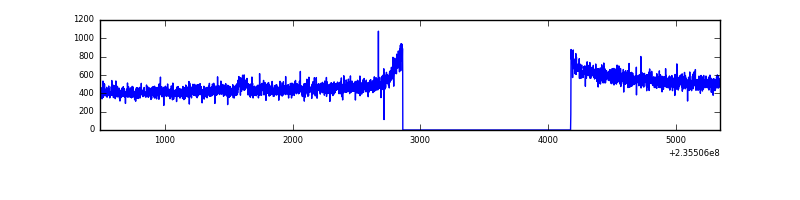 |
| D | 4852 | 3538 | 259 | 259 | 5.34% | 7.32% |  |
Top three noisy pixels from each quadrant. If the there are fewer than three noisy pixels in the level2.evt file, extra rows are filled as -1
| Pixel properties | Quadrant properties | ||||||
|---|---|---|---|---|---|---|---|
| Quadrant | DetID | PixID | Counts | Sigma | Mean | Median | Sigma |
| A | 8 | 5 | 512872 | 5573.3 | 446 | 438 | 91.9 |
| A | 1 | 162 | 68012 | 734.94 | 446 | 438 | 91.9 |
| A | 1 | 178 | 15898 | 168.15 | 446 | 438 | 91.9 |
| B | 10 | 245 | 166781 | 1911.74 | 447 | 437 | 87.0 |
| B | 12 | 111 | 9494 | 104.09 | 447 | 437 | 87.0 |
| B | 4 | 80 | 8622 | 94.07 | 447 | 437 | 87.0 |
| C | 9 | 68 | 12742 | 120.18 | 438 | 440 | 102.4 |
| C | 13 | 61 | 3279 | 27.73 | 438 | 440 | 102.4 |
| C | 8 | 222 | 1797 | 13.25 | 438 | 440 | 102.4 |
| D | 12 | 227 | 924047 | 9321.42 | 410 | 400 | 99.1 |
| D | 1 | 52 | 53493 | 535.81 | 410 | 400 | 99.1 |
| D | 12 | 233 | 36307 | 362.37 | 410 | 400 | 99.1 |
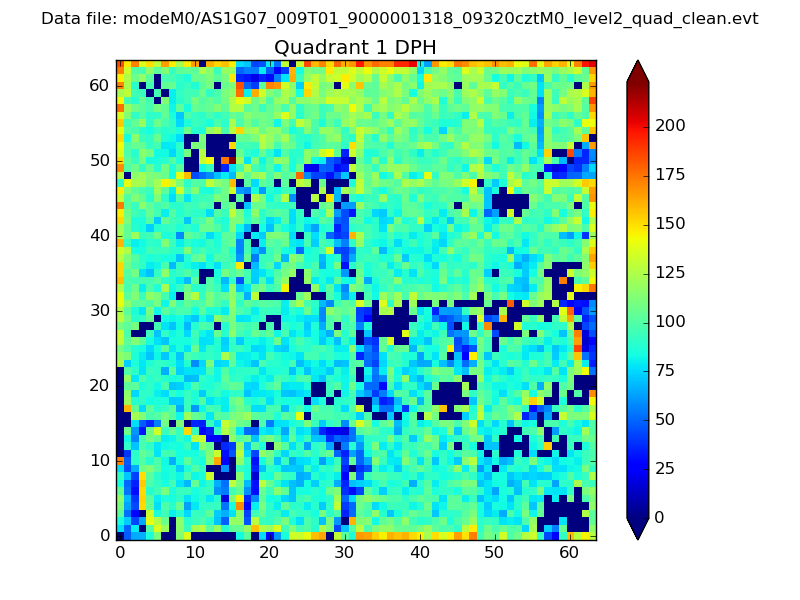
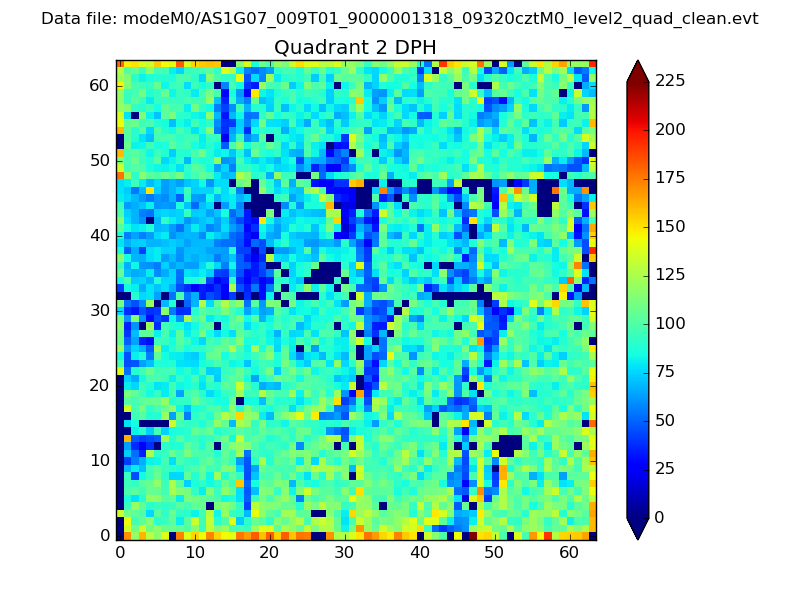
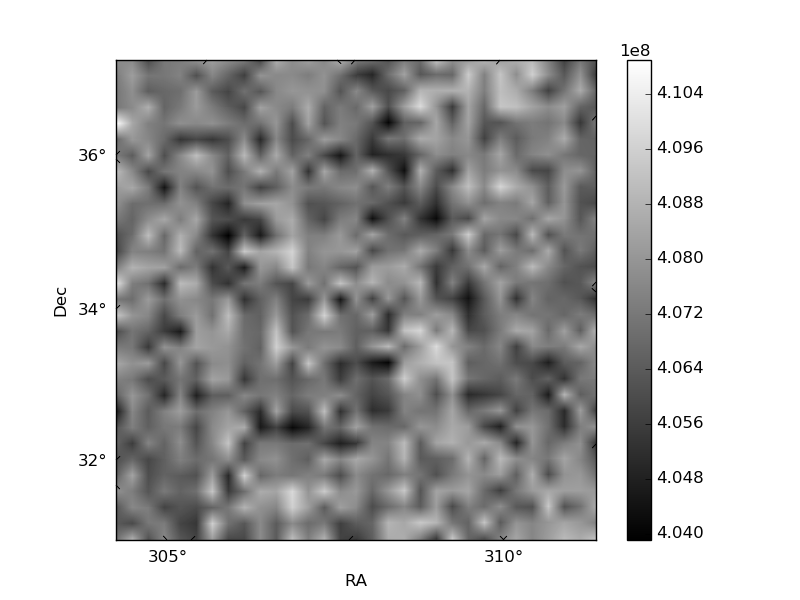
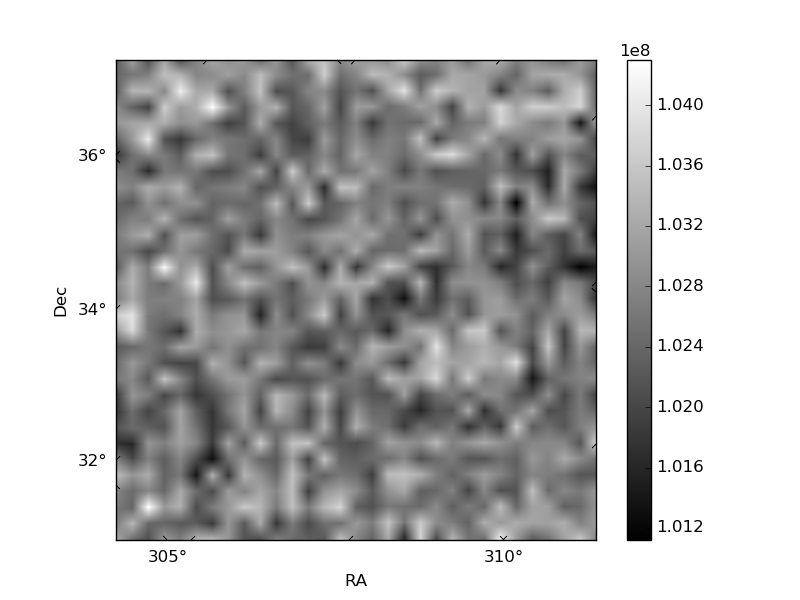
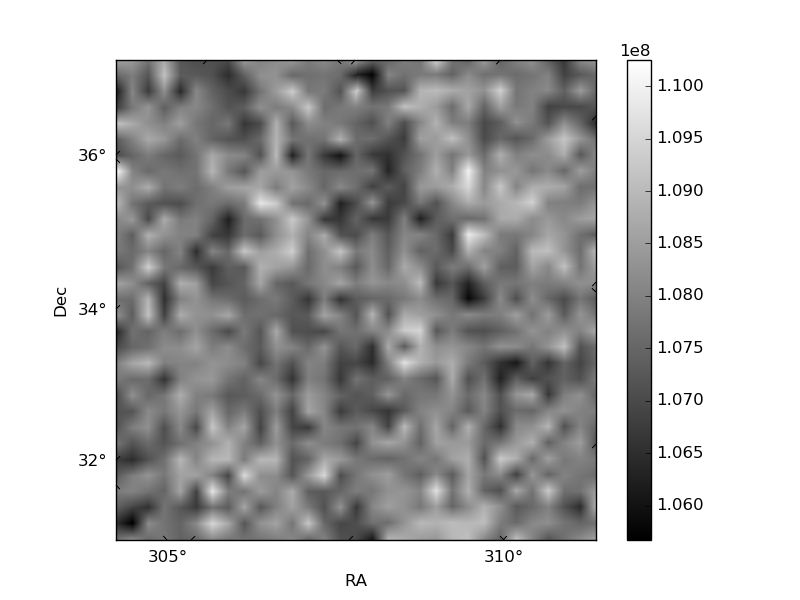
Histogram calculated using DETX and DETY for each event in the final _common_clean file
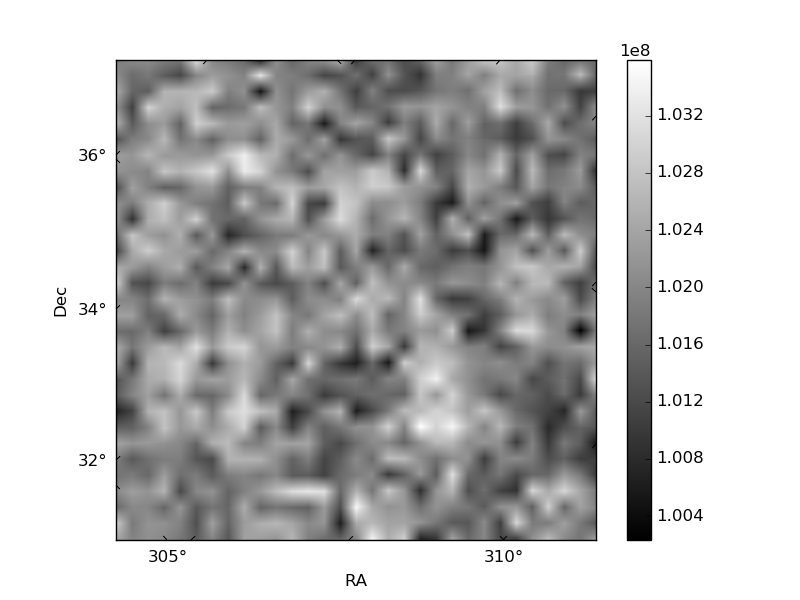
| Quadrant A | 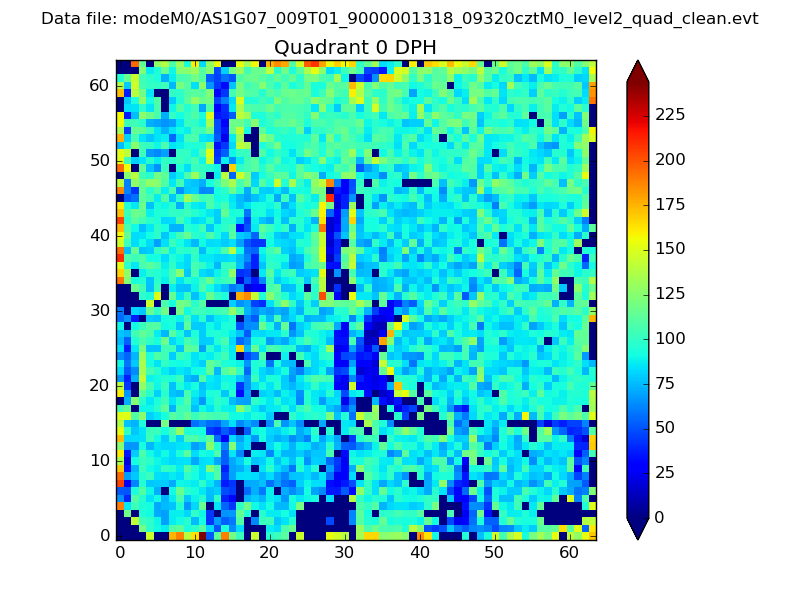 |
 |
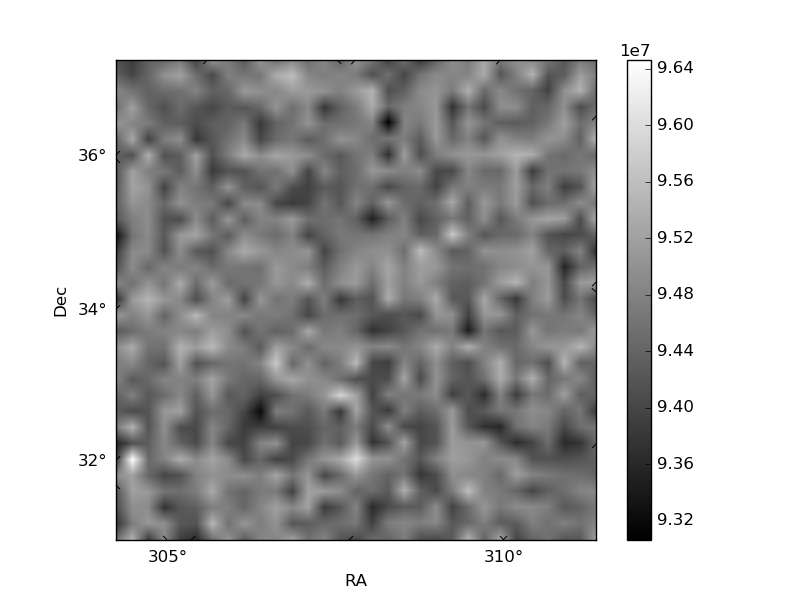
Quadrant B |
|---|---|---|---|
| Quadrant D | 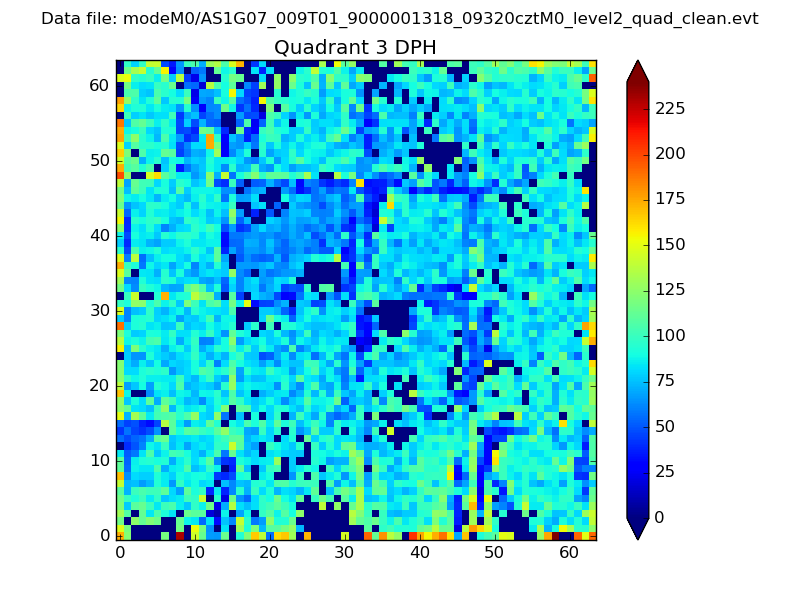 |
 |
Quadrant C |
| Plot type | Count rate plots | Images |
|---|---|---|
| Comparison with Poisson distribution Blue bars denote a histogram of data divided into 1 sec bins. Red curve is a Poisson curve with rate = median count rate of data. |
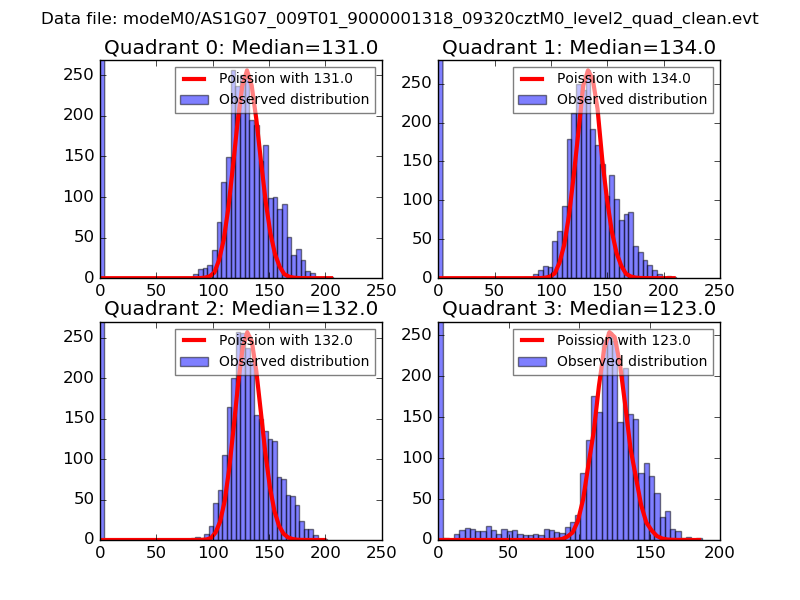 |
 |
| Quadrant-wise count rates Data is divided into 100 sec bins |
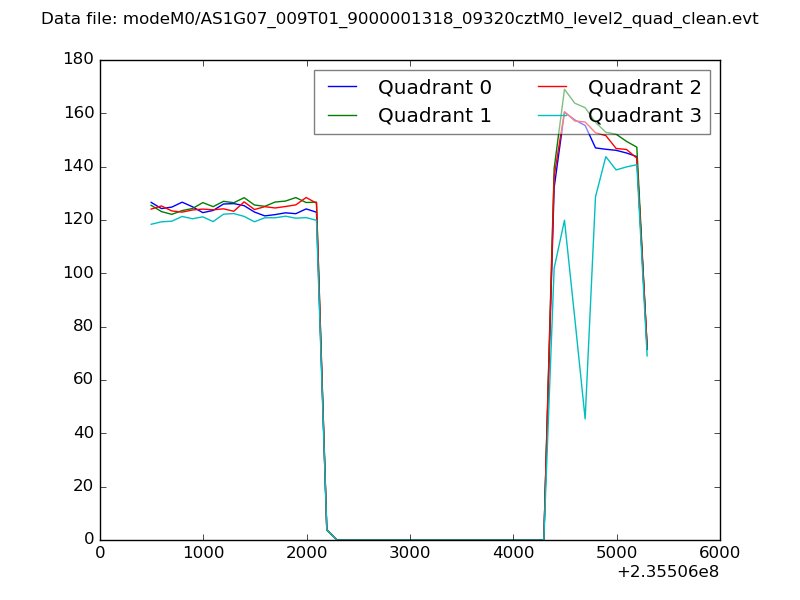 |
|
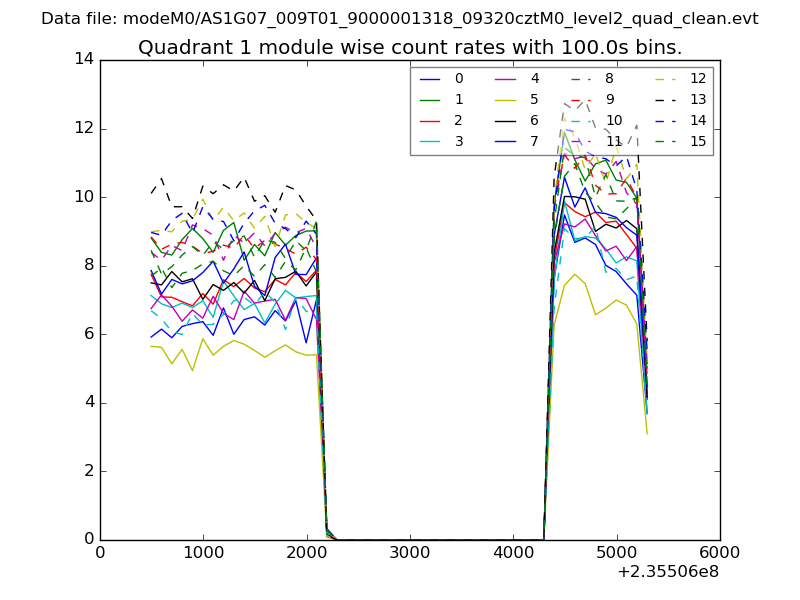
| Module-wise count rates for Quadrant A Data is divided into 100 sec bins |
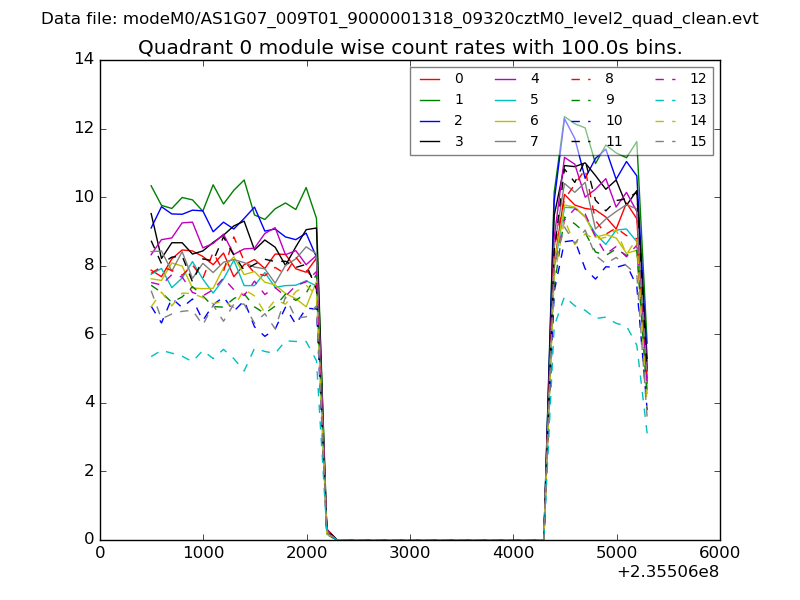 |
 |
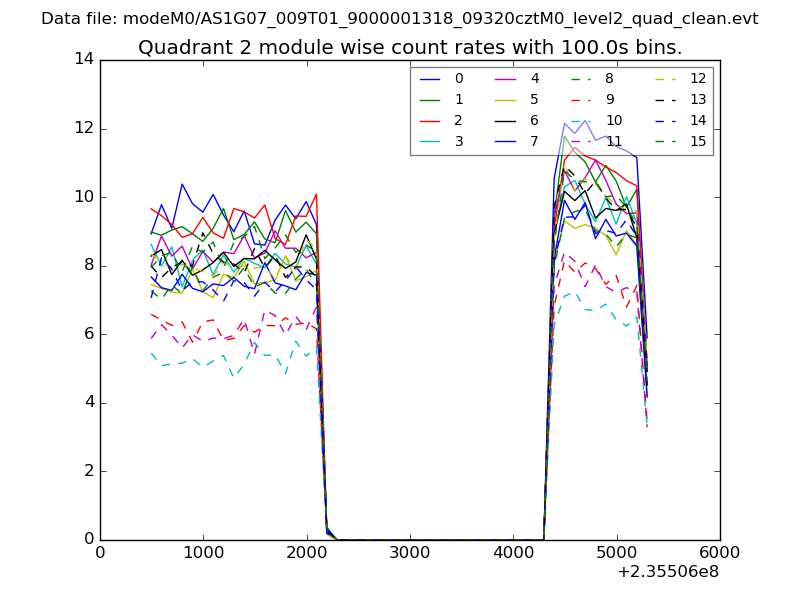
| Module-wise count rates for Quadrant B Data is divided into 100 sec bins |
 |
 |
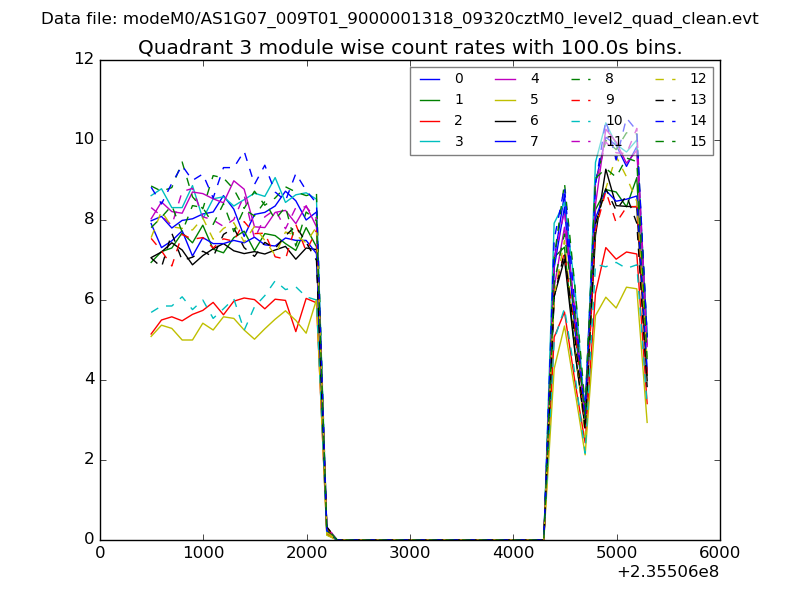
| Module-wise count rates for Quadrant C Data is divided into 100 sec bins |
 |
 |
| Module-wise count rates for Quadrant D Data is divided into 100 sec bins |
 |
 |
| Parameter | Plot |
|---|---|
| CZT HV Monitor | 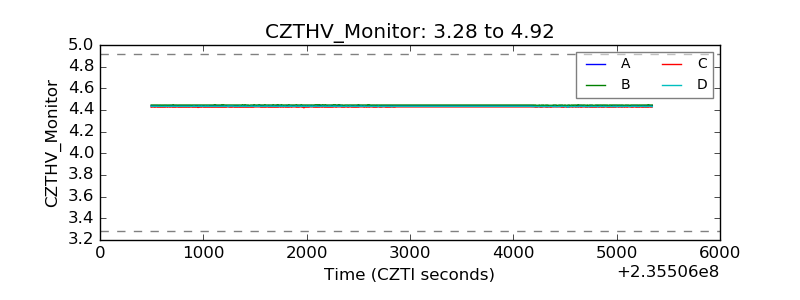 |
| D_VDD |  |
| Temperature 1 | 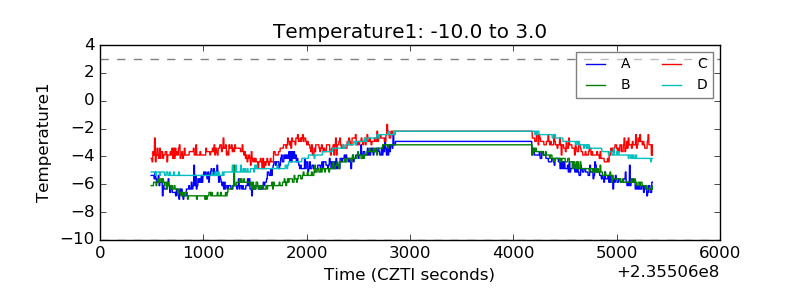 |
| Veto HV Monitor | 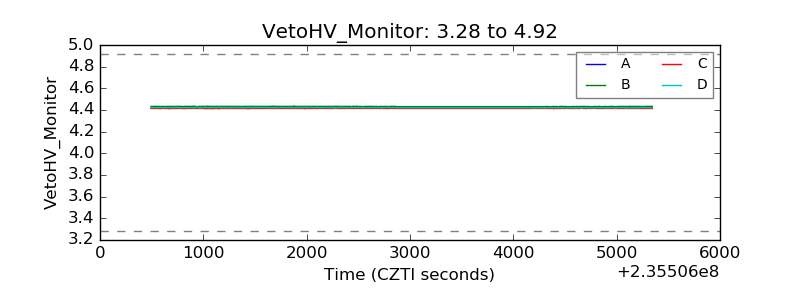 |
| Veto LLD |  |
| Alpha Counter | 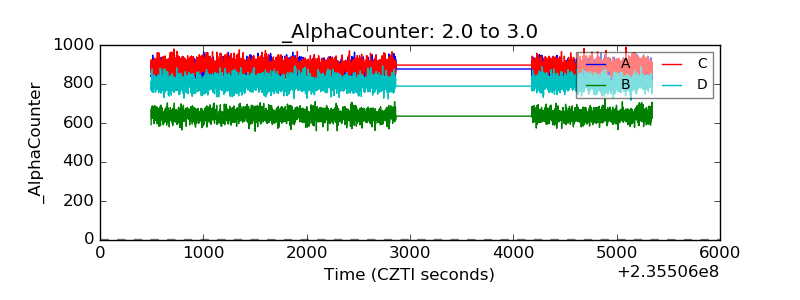 |
| _CPM_Rate | 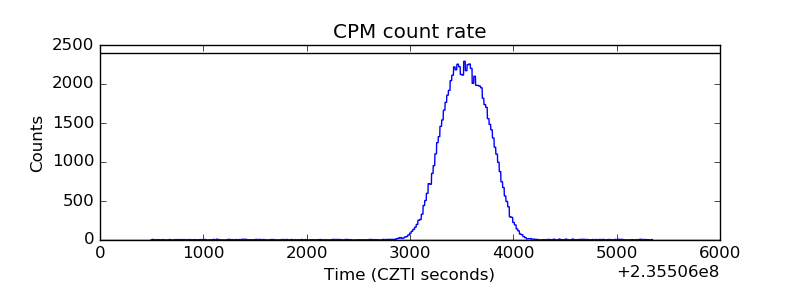 |
| CZT Counter | 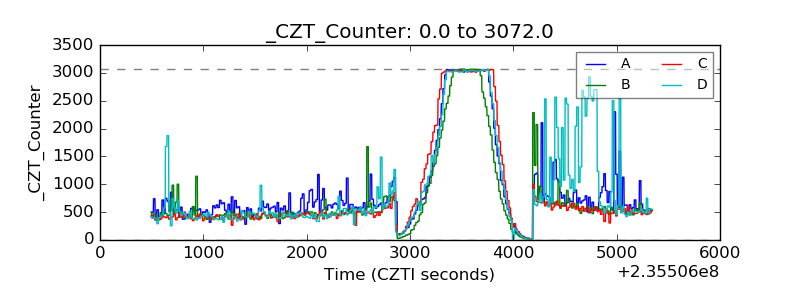 |
| +2.5 Volts monitor | 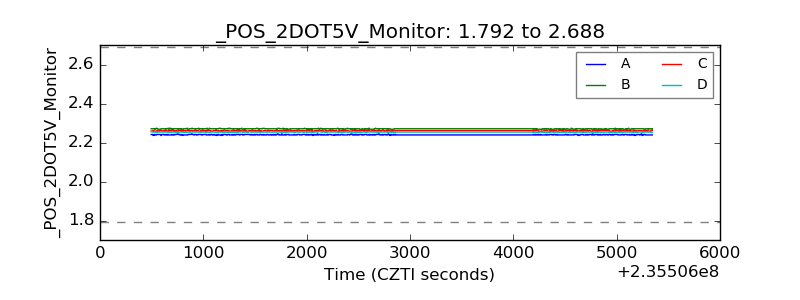 |
| +5 Volts monitor |  |
| _ROLL_ROT | 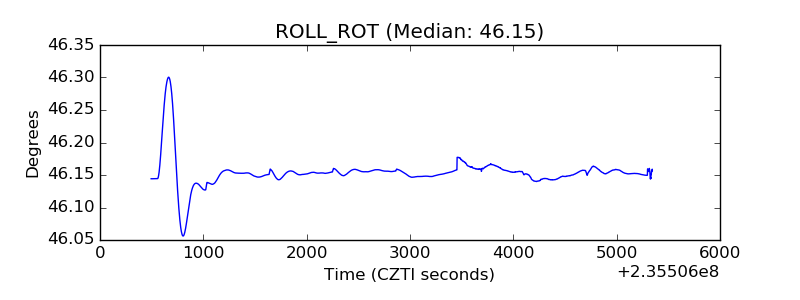 |
| _Roll_DEC | 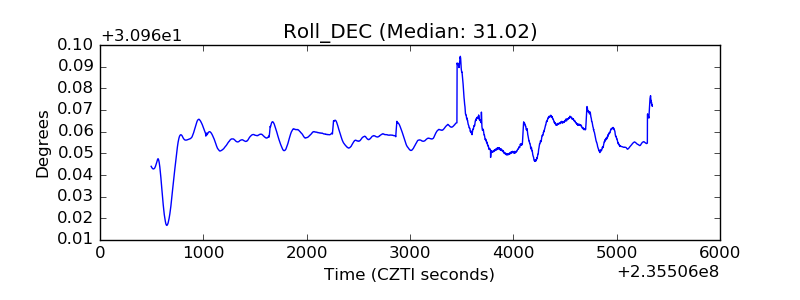 |
| _Roll_RA | 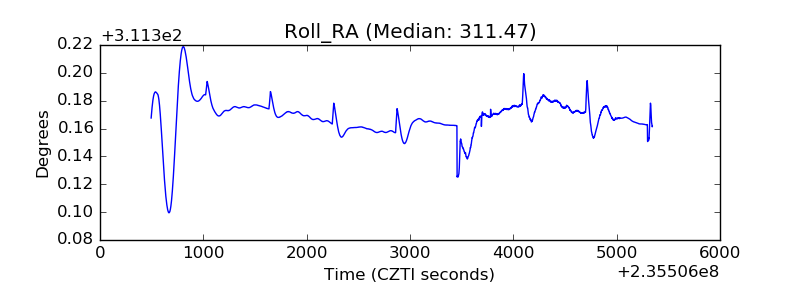 |
| Veto Counter | 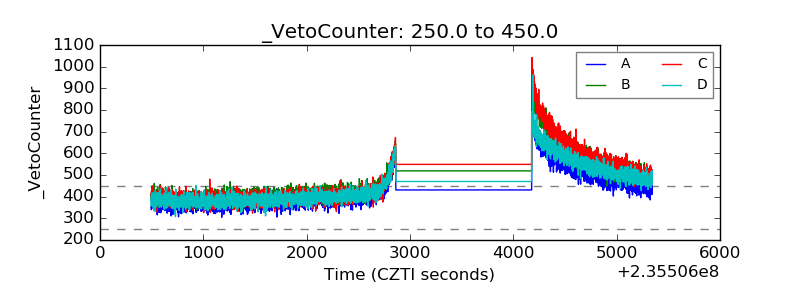 |