| Param | Original file | Final file |
|---|---|---|
| Filename | modeM0/AS1G07_009T01_9000001318_09321cztM0_level2.evt | modeM0/AS1G07_009T01_9000001318_09321cztM0_level2_quad_clean.evt |
| Size (bytes) | 512,519,040 | 101,828,160 |
| Size | 488.8 MB | 97.1 MB |
| Events in quadrant A | 3,775,528 | 662,874 |
| Events in quadrant B | 3,592,760 | 684,691 |
| Events in quadrant C | 3,198,047 | 671,213 |
| Events in quadrant D | 4,515,815 | 613,597 |
| Mode M9 | |||
|---|---|---|---|
| Quadrant | BADHDUFLAG | Total packets | Discarded packets |
| A | 0 | 26 | 0 |
| B | 0 | 25 | 0 |
| C | 0 | 26 | 0 |
| D | 0 | 26 | 0 |
| Mode M0 | |||
|---|---|---|---|
| Quadrant | BADHDUFLAG | Total packets | Discarded packets |
| A | 0 | 15372 | 0 |
| B | 0 | 14841 | 0 |
| C | 0 | 13720 | 0 |
| D | 0 | 17720 | 0 |
| Mode SS | |||
|---|---|---|---|
| Quadrant | BADHDUFLAG | Total packets | Discarded packets |
| A | 0 | 134 | 0 |
| B | 0 | 134 | 0 |
| C | 0 | 134 | 0 |
| D | 0 | 134 | 0 |
| Quadrant | Total seconds | Saturated seconds | Saturation percentage |
|---|---|---|---|
| A | 6475 | 139 | 2.146718% |
| B | 6476 | 192 | 2.964793% |
| C | 6482 | 90 | 1.388460% |
| D | 6447 | 494 | 7.662479% |
Noise dominated data is calculated using 1-second bins in cleaned event files. If a bin has >2000 counts, and if more than 50% of those come from <1% of pixels, then it is considered to be noise-dominated and hence unusable.
| Quadrant | # 1 sec bins | Bins with >0 counts | Bins with >2000 counts | High rate bins dominated by noise | Noise dominated (total time) | Noise dominated (detector-on time) | Marked lightcurve |
|---|---|---|---|---|---|---|---|
| A | 9150 | 6531 | 11 | 11 | 0.12% | 0.17% | 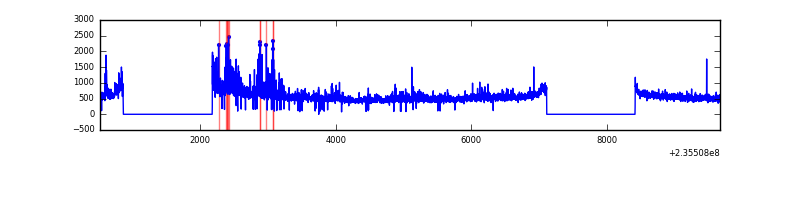 |
| B | 9150 | 6529 | 56 | 56 | 0.61% | 0.86% | 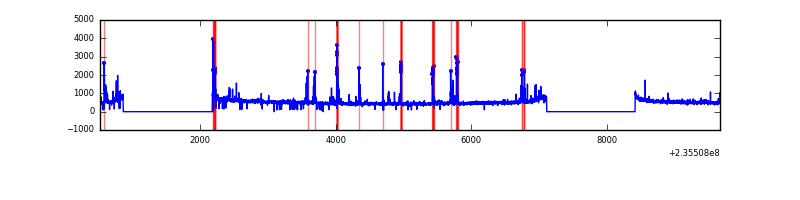 |
| C | 9150 | 6530 | 0 | 0 | 0.00% | 0.00% | 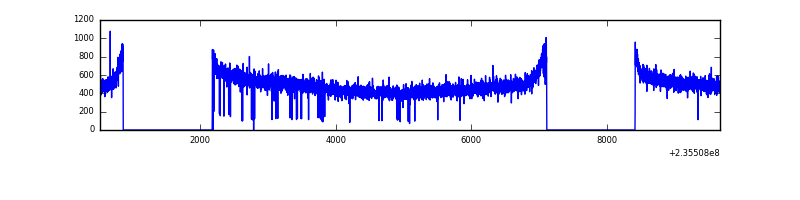 |
| D | 9150 | 6523 | 323 | 323 | 3.53% | 4.95% | 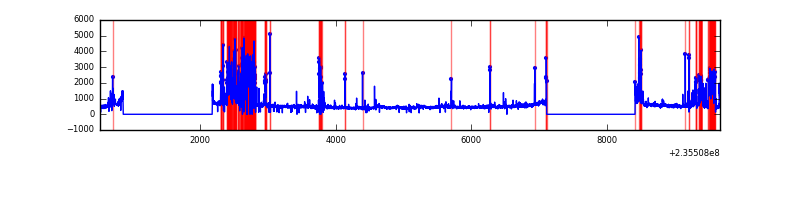 |
Top three noisy pixels from each quadrant. If the there are fewer than three noisy pixels in the level2.evt file, extra rows are filled as -1
| Pixel properties | Quadrant properties | ||||||
|---|---|---|---|---|---|---|---|
| Quadrant | DetID | PixID | Counts | Sigma | Mean | Median | Sigma |
| A | 8 | 5 | 467896 | 2785.56 | 821 | 803 | 167.7 |
| A | 1 | 162 | 96998 | 573.67 | 821 | 803 | 167.7 |
| A | 1 | 178 | 21662 | 124.4 | 821 | 803 | 167.7 |
| B | 10 | 245 | 324964 | 2043.15 | 829 | 809 | 158.7 |
| B | 0 | 219 | 17319 | 104.06 | 829 | 809 | 158.7 |
| B | 12 | 111 | 17054 | 102.39 | 829 | 809 | 158.7 |
| C | 9 | 68 | 8056 | 38.56 | 817 | 820 | 187.7 |
| C | 13 | 61 | 6026 | 27.74 | 817 | 820 | 187.7 |
| C | 10 | 22 | 3579 | 14.7 | 817 | 820 | 187.7 |
| D | 12 | 227 | 1320027 | 7106.28 | 776 | 761 | 185.6 |
| D | 12 | 233 | 155268 | 832.26 | 776 | 761 | 185.6 |
| D | 1 | 52 | 37700 | 198.97 | 776 | 761 | 185.6 |
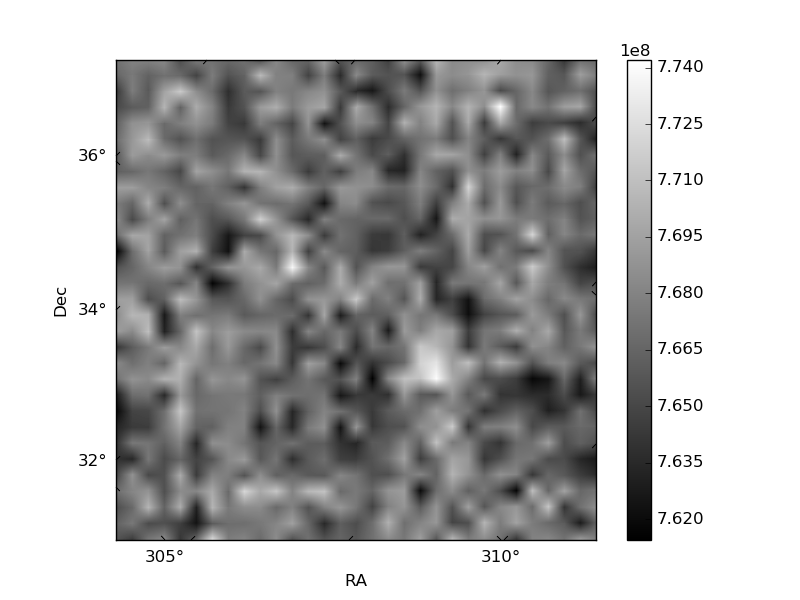
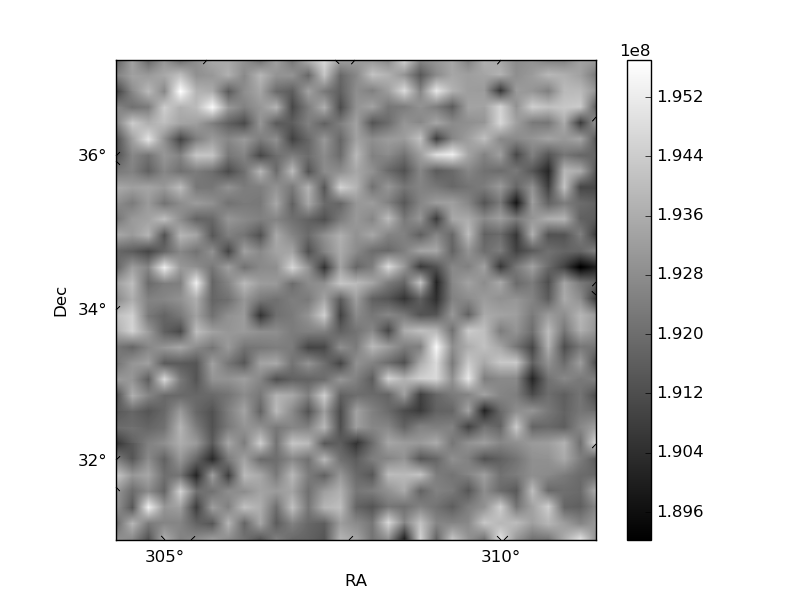
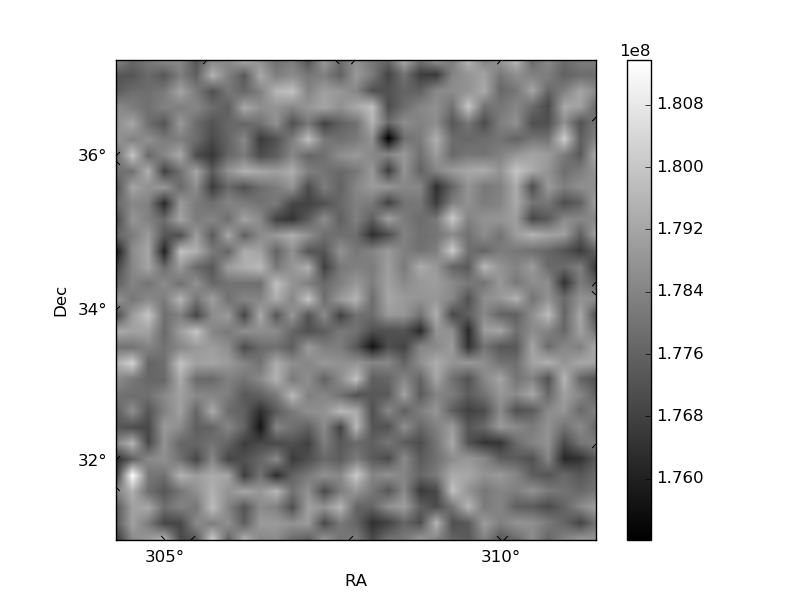
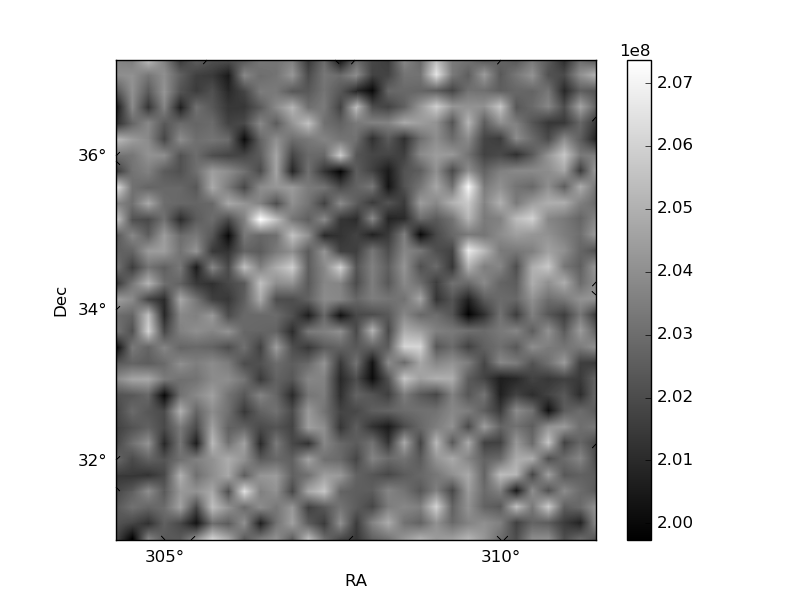
Histogram calculated using DETX and DETY for each event in the final _common_clean file
| Quadrant A | 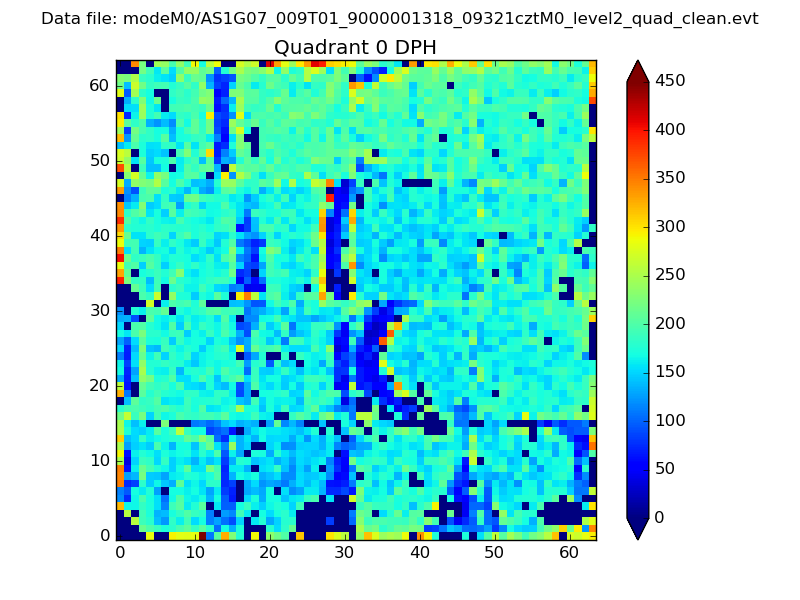 |
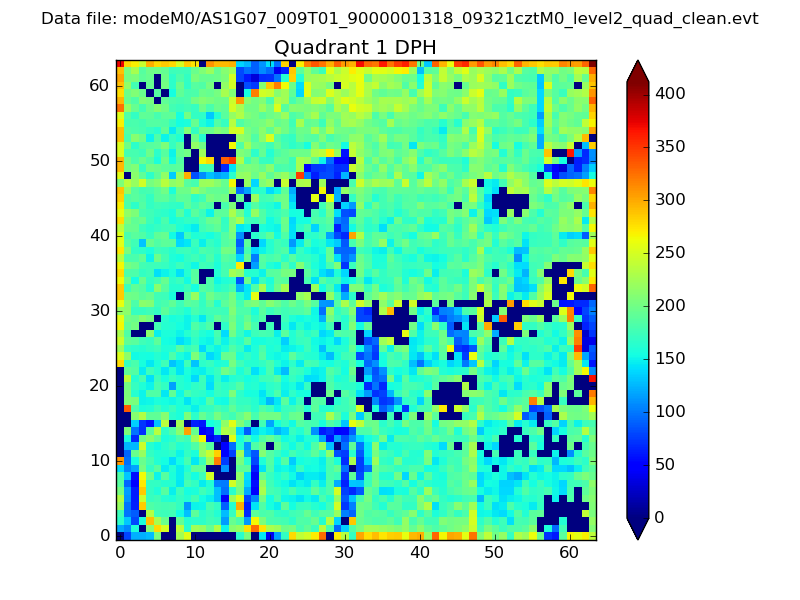 |
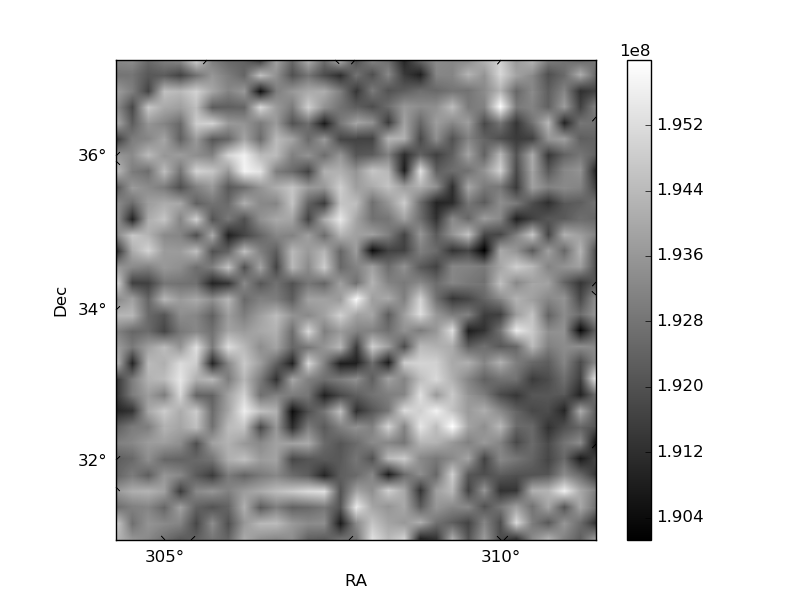
Quadrant B |
|---|---|---|---|
| Quadrant D | 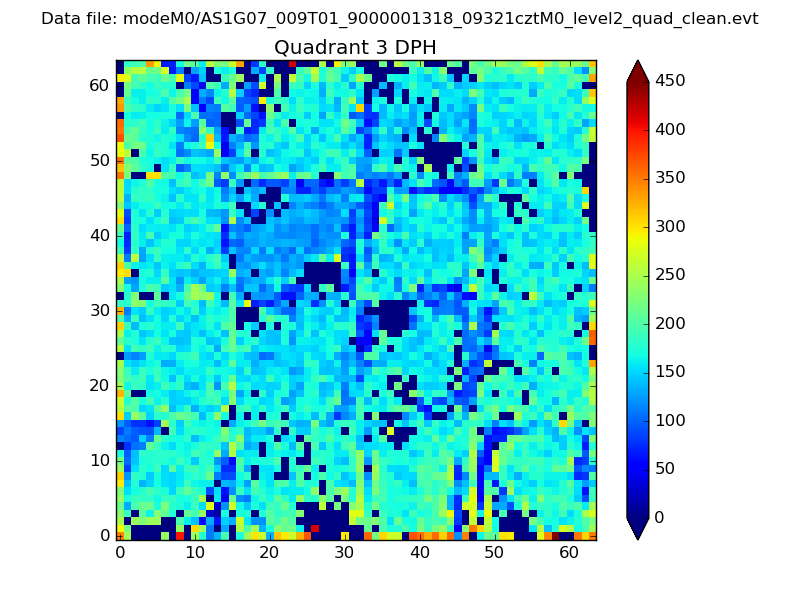 |
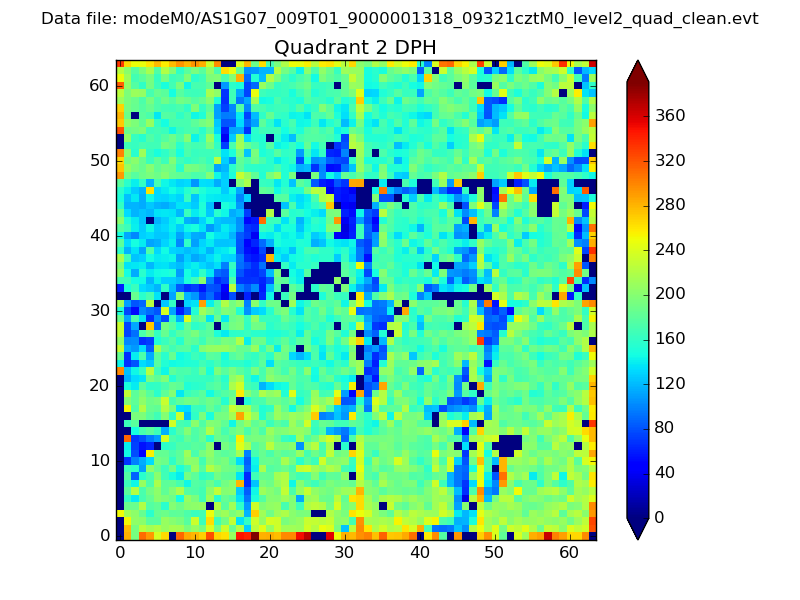 |
Quadrant C |
| Plot type | Count rate plots | Images |
|---|---|---|
| Comparison with Poisson distribution Blue bars denote a histogram of data divided into 1 sec bins. Red curve is a Poisson curve with rate = median count rate of data. |
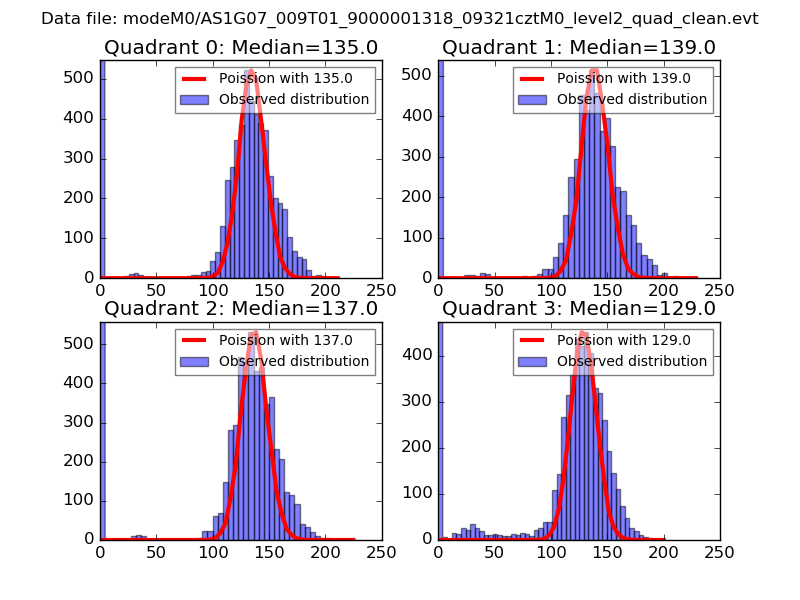 |
 |
| Quadrant-wise count rates Data is divided into 100 sec bins |
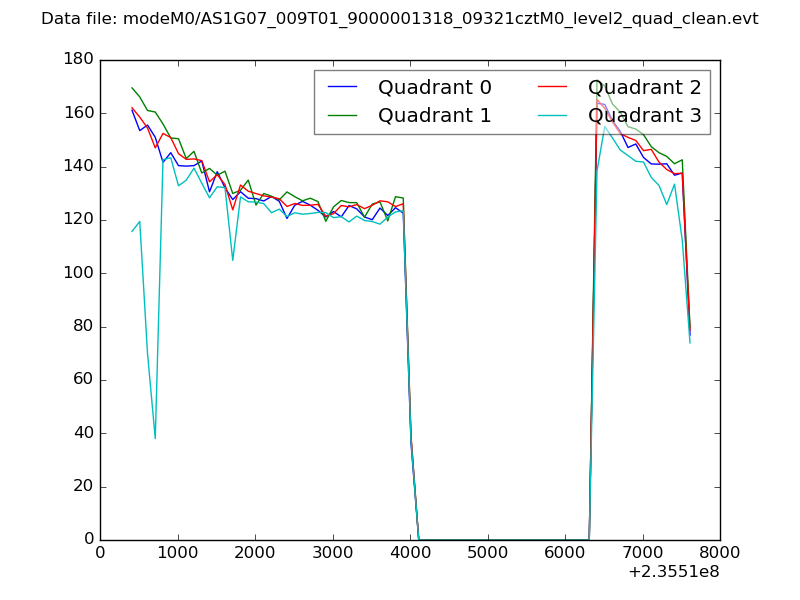 |
|
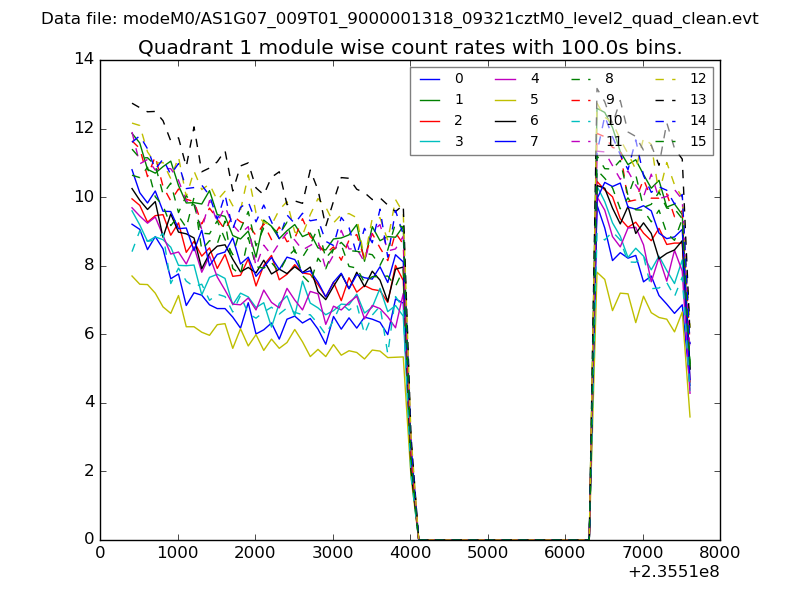
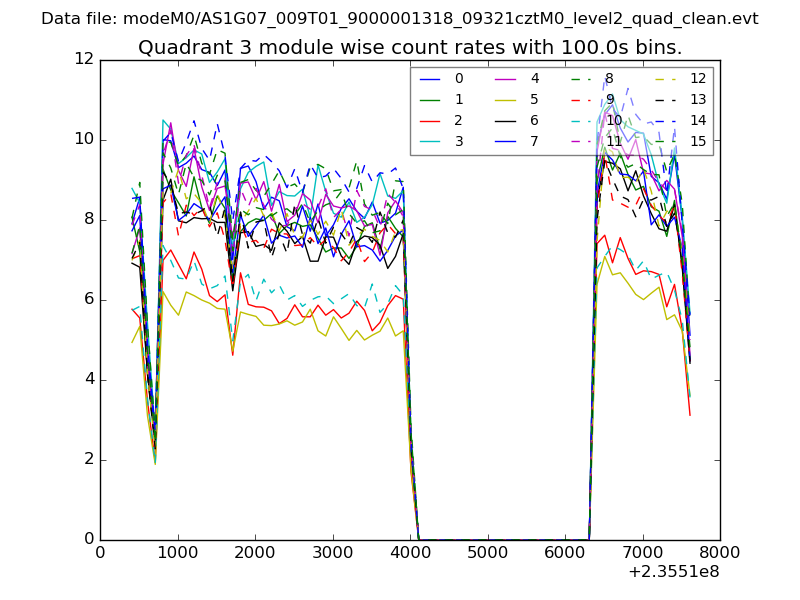
| Module-wise count rates for Quadrant A Data is divided into 100 sec bins |
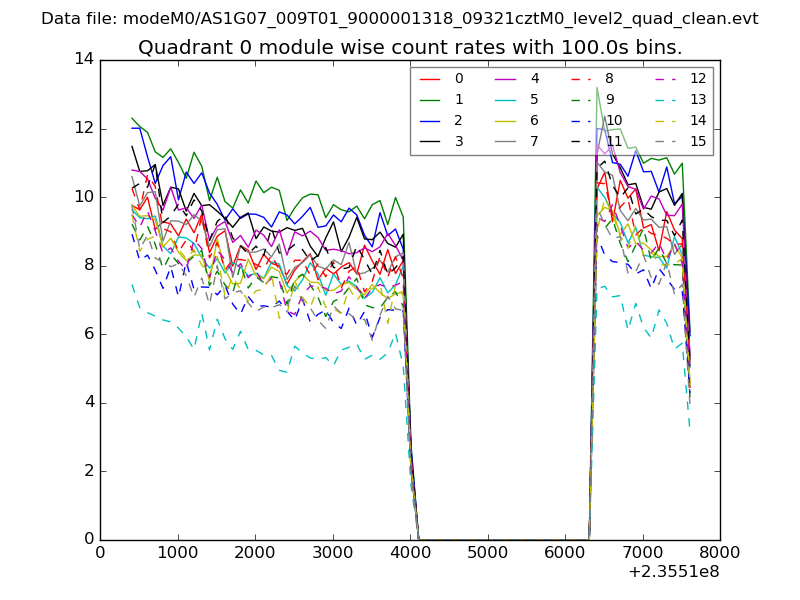 |
 |
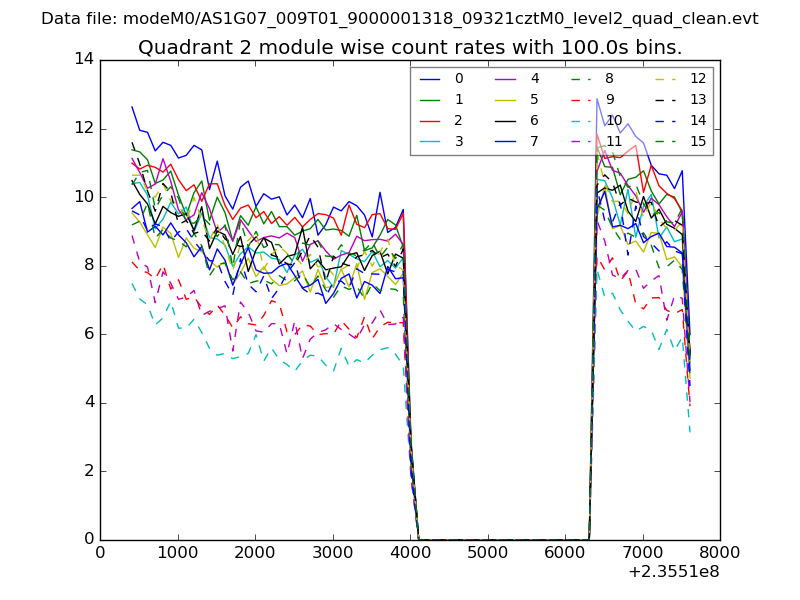
| Module-wise count rates for Quadrant B Data is divided into 100 sec bins |
 |
 |
| Module-wise count rates for Quadrant C Data is divided into 100 sec bins |
 |
 |
| Module-wise count rates for Quadrant D Data is divided into 100 sec bins |
 |
 |
| Parameter | Plot |
|---|---|
| CZT HV Monitor | 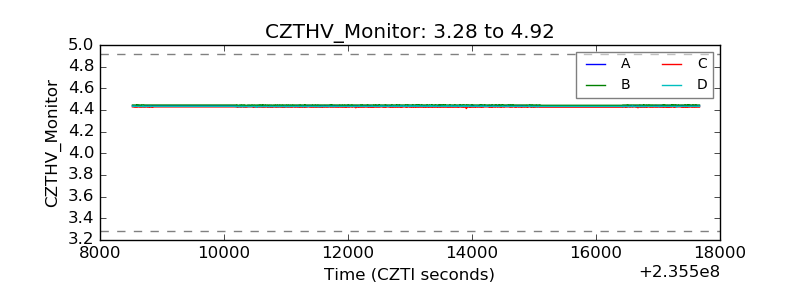 |
| D_VDD | 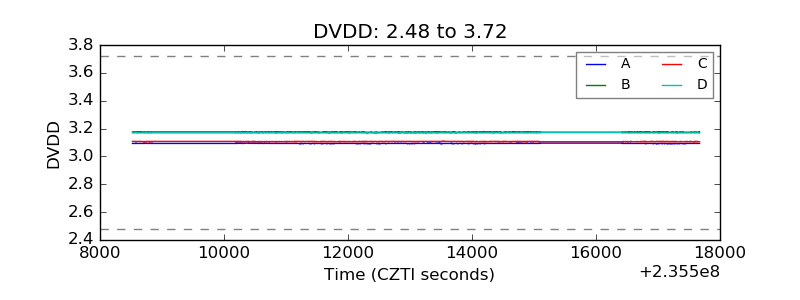 |
| Temperature 1 |  |
| Veto HV Monitor | 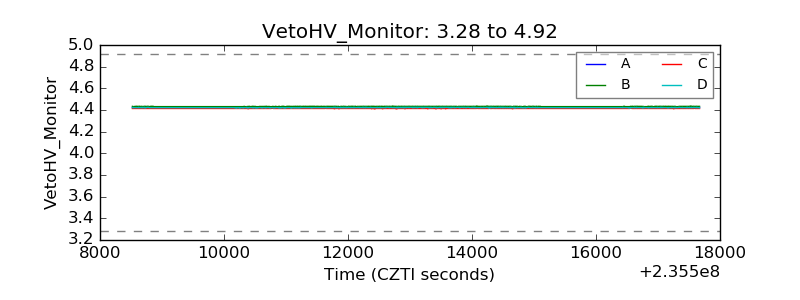 |
| Veto LLD |  |
| Alpha Counter | 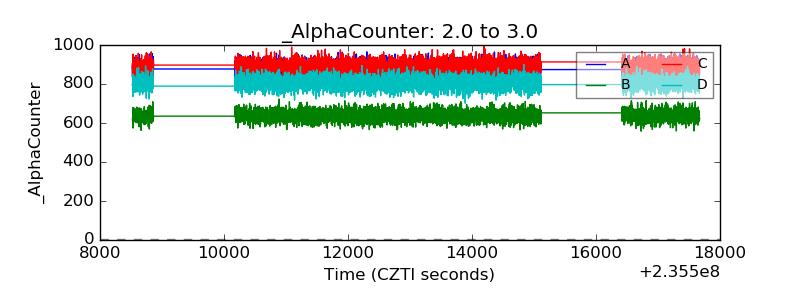 |
| _CPM_Rate | 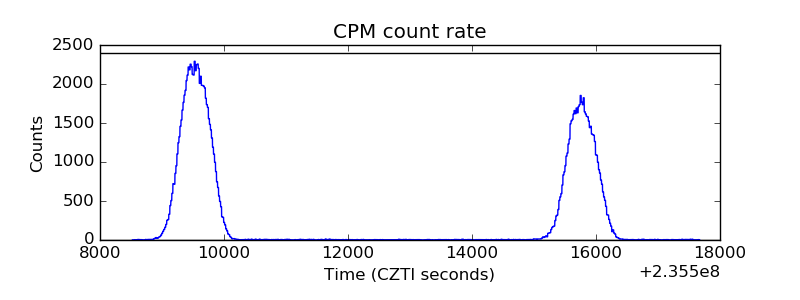 |
| CZT Counter | 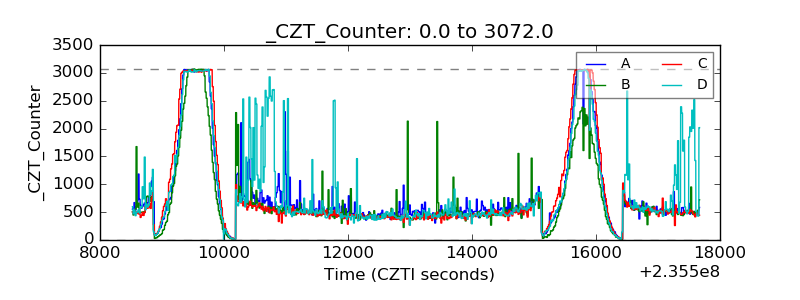 |
| +2.5 Volts monitor |  |
| +5 Volts monitor |  |
| _ROLL_ROT | 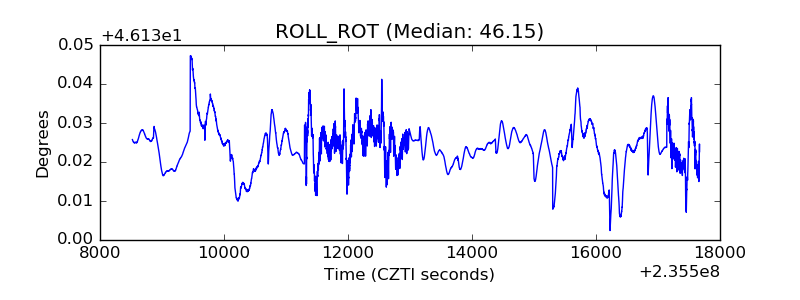 |
| _Roll_DEC | 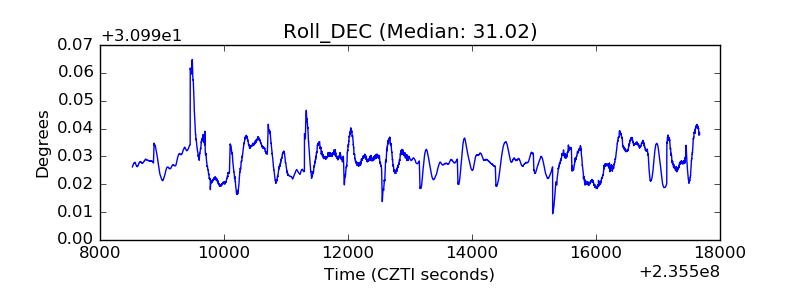 |
| _Roll_RA | 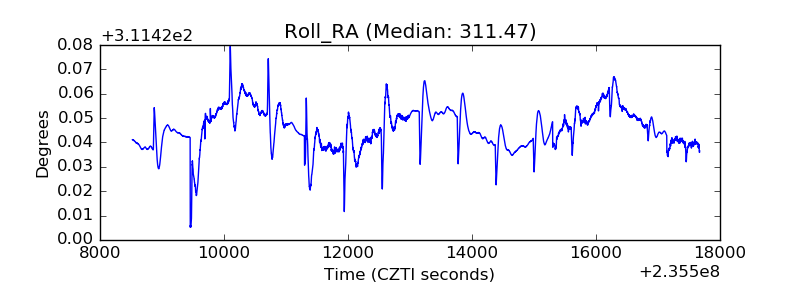 |
| Veto Counter | 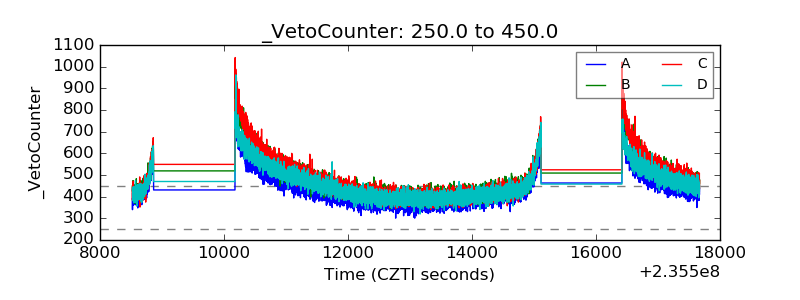 |