| Param | Original file | Final file |
|---|---|---|
| Filename | modeM0/AS1G07_009T01_9000001318_09323cztM0_level2.evt | modeM0/AS1G07_009T01_9000001318_09323cztM0_level2_quad_clean.evt |
| Size (bytes) | 373,708,800 | 75,294,720 |
| Size | 356.4 MB | 71.8 MB |
| Events in quadrant A | 2,913,974 | 574,209 |
| Events in quadrant B | 2,631,952 | 465,139 |
| Events in quadrant C | 2,474,030 | 448,880 |
| Events in quadrant D | 2,931,661 | 416,129 |
| Mode M9 | |||
|---|---|---|---|
| Quadrant | BADHDUFLAG | Total packets | Discarded packets |
| A | 0 | 24 | 3 |
| B | 0 | 24 | 1 |
| C | 0 | 24 | 4 |
| D | 0 | 24 | 3 |
| Mode M0 | |||
|---|---|---|---|
| Quadrant | BADHDUFLAG | Total packets | Discarded packets |
| A | 0 | 14743 | 2610 |
| B | 0 | 13870 | 2411 |
| C | 0 | 13545 | 2414 |
| D | 0 | 16286 | 3895 |
| Mode SS | |||
|---|---|---|---|
| Quadrant | BADHDUFLAG | Total packets | Discarded packets |
| A | 0 | 132 | 26 |
| B | 0 | 132 | 22 |
| C | 0 | 132 | 12 |
| D | 0 | 132 | 36 |
| Quadrant | Total seconds | Saturated seconds | Saturation percentage |
|---|---|---|---|
| A | 5392 | 45 | 0.834570% |
| B | 5411 | 57 | 1.053410% |
| C | 5362 | 33 | 0.615442% |
| D | 5288 | 116 | 2.193646% |
Noise dominated data is calculated using 1-second bins in cleaned event files. If a bin has >2000 counts, and if more than 50% of those come from <1% of pixels, then it is considered to be noise-dominated and hence unusable.
| Quadrant | # 1 sec bins | Bins with >0 counts | Bins with >2000 counts | High rate bins dominated by noise | Noise dominated (total time) | Noise dominated (detector-on time) | Marked lightcurve |
|---|---|---|---|---|---|---|---|
| A | 8874 | 6101 | 0 | 0 | 0.00% | 0.00% | 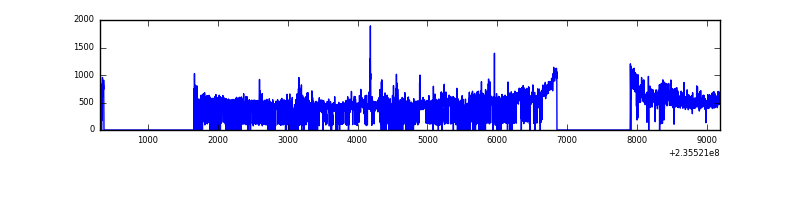 |
| B | 8874 | 6145 | 1 | 1 | 0.01% | 0.02% | 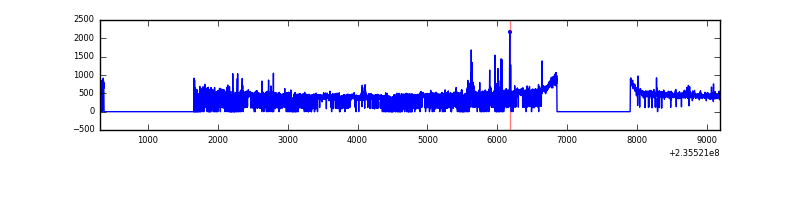 |
| C | 8875 | 6138 | 0 | 0 | 0.00% | 0.00% | 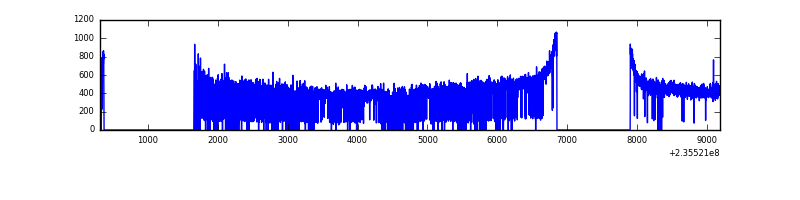 |
| D | 8874 | 6015 | 51 | 51 | 0.57% | 0.85% | 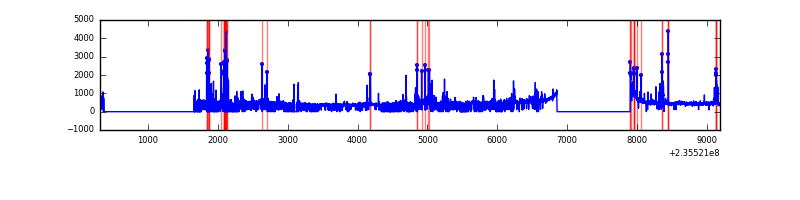 |
Top three noisy pixels from each quadrant. If the there are fewer than three noisy pixels in the level2.evt file, extra rows are filled as -1
| Pixel properties | Quadrant properties | ||||||
|---|---|---|---|---|---|---|---|
| Quadrant | DetID | PixID | Counts | Sigma | Mean | Median | Sigma |
| A | 8 | 5 | 408547 | 3074.44 | 646 | 631 | 132.7 |
| A | 1 | 162 | 13516 | 97.11 | 646 | 631 | 132.7 |
| A | 0 | 226 | 5900 | 39.71 | 646 | 631 | 132.7 |
| B | 10 | 245 | 59861 | 467.29 | 657 | 640 | 126.7 |
| B | 0 | 219 | 19905 | 152.01 | 657 | 640 | 126.7 |
| B | 12 | 111 | 14235 | 107.27 | 657 | 640 | 126.7 |
| C | 13 | 61 | 4804 | 28.16 | 634 | 636 | 148.0 |
| C | 8 | 222 | 1744 | 7.49 | 634 | 636 | 148.0 |
| C | 3 | 202 | 1575 | 6.34 | 634 | 636 | 148.0 |
| D | 12 | 227 | 426555 | 2725.32 | 607 | 592 | 156.3 |
| D | 1 | 52 | 85516 | 543.35 | 607 | 592 | 156.3 |
| D | 10 | 172 | 46811 | 295.71 | 607 | 592 | 156.3 |
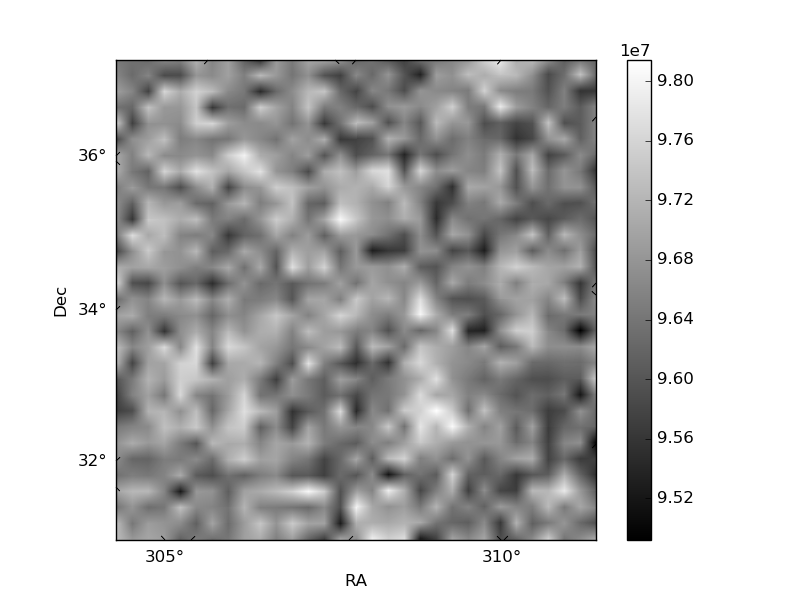
Histogram calculated using DETX and DETY for each event in the final _common_clean file
| Quadrant A | 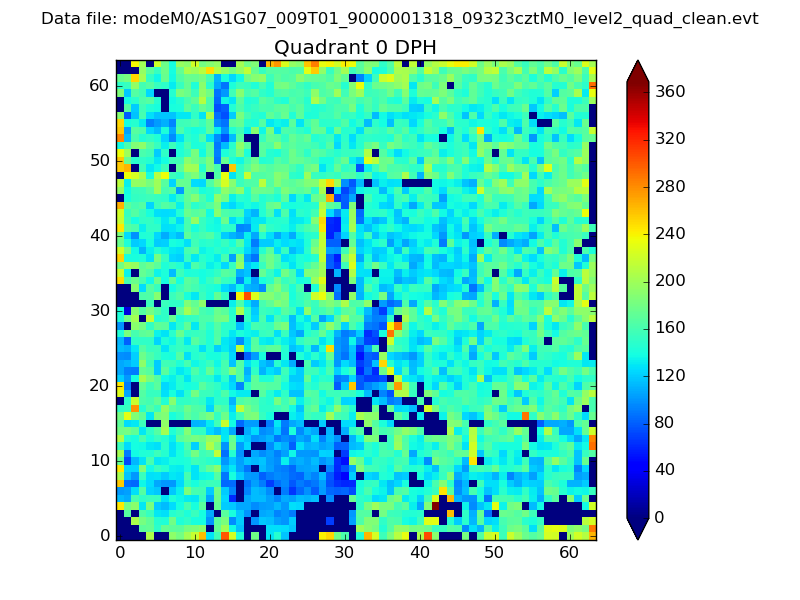 |
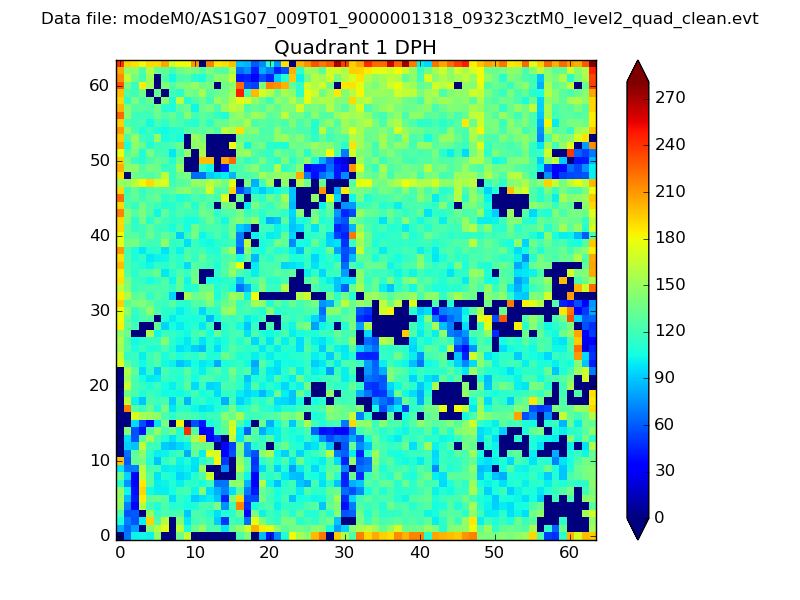 |
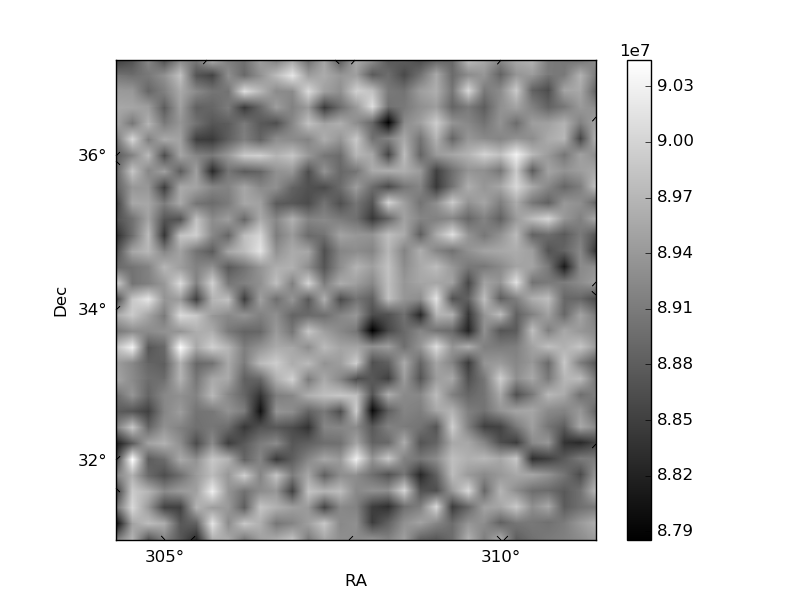
Quadrant B |
|---|---|---|---|
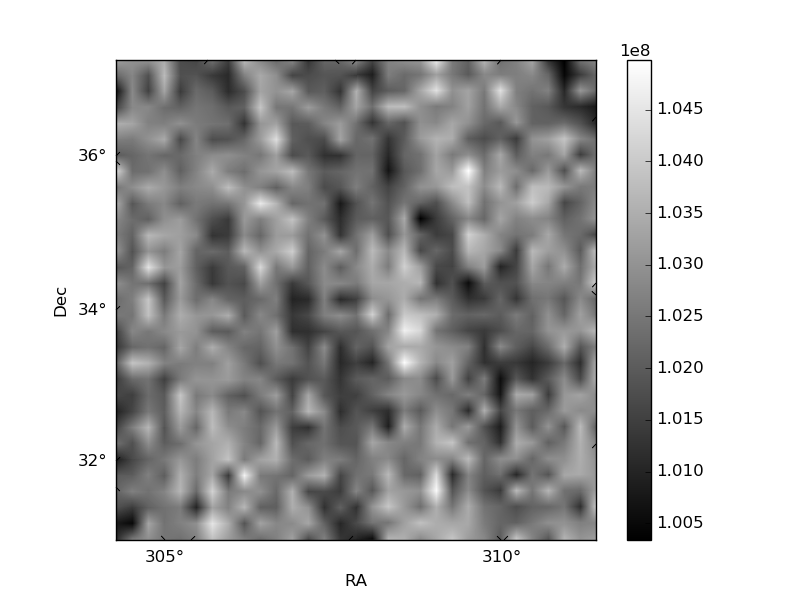
| Quadrant D | 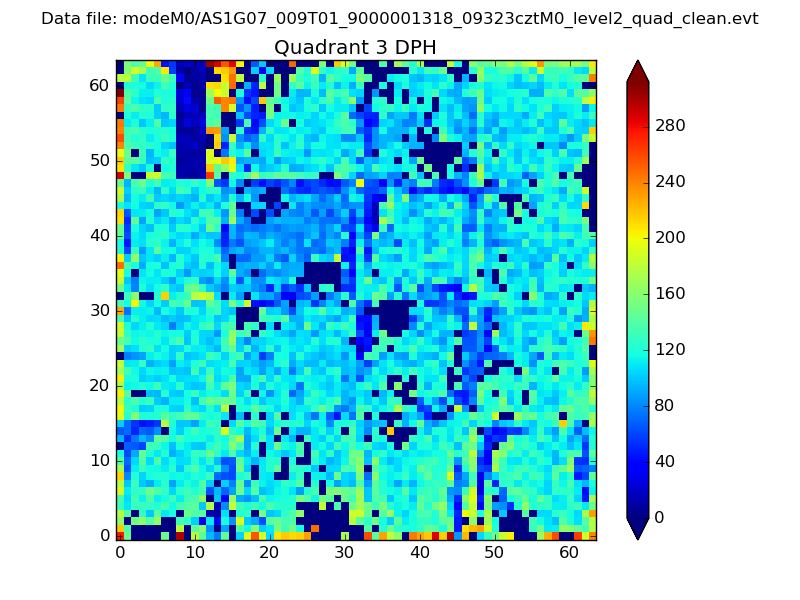 |
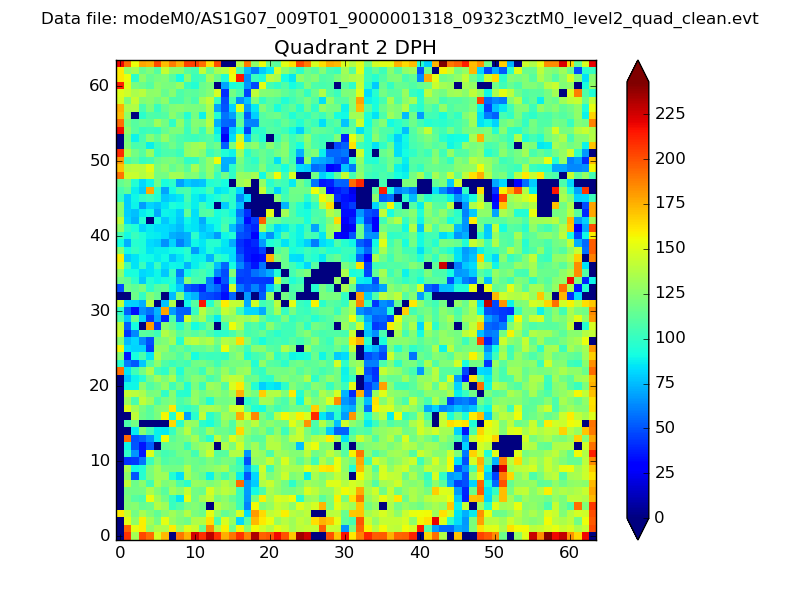 |
Quadrant C |
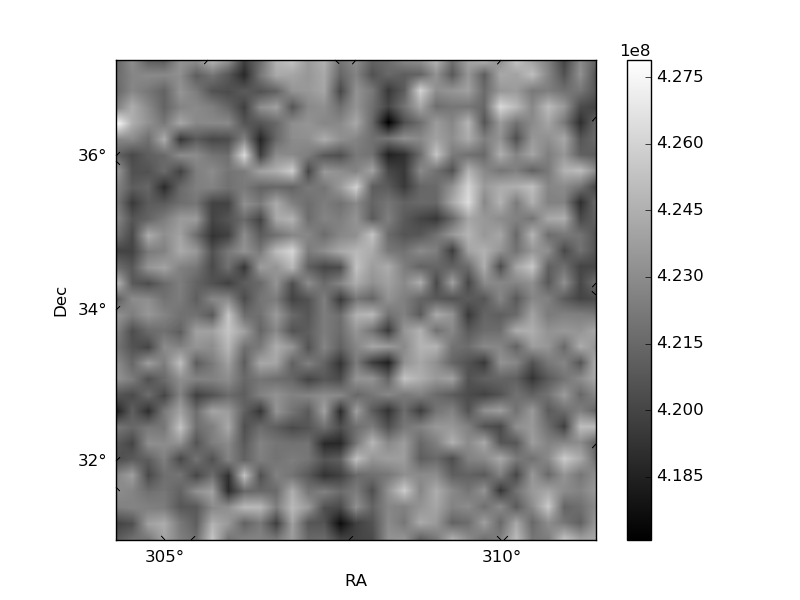
| Plot type | Count rate plots | Images |
|---|---|---|
| Comparison with Poisson distribution Blue bars denote a histogram of data divided into 1 sec bins. Red curve is a Poisson curve with rate = median count rate of data. |
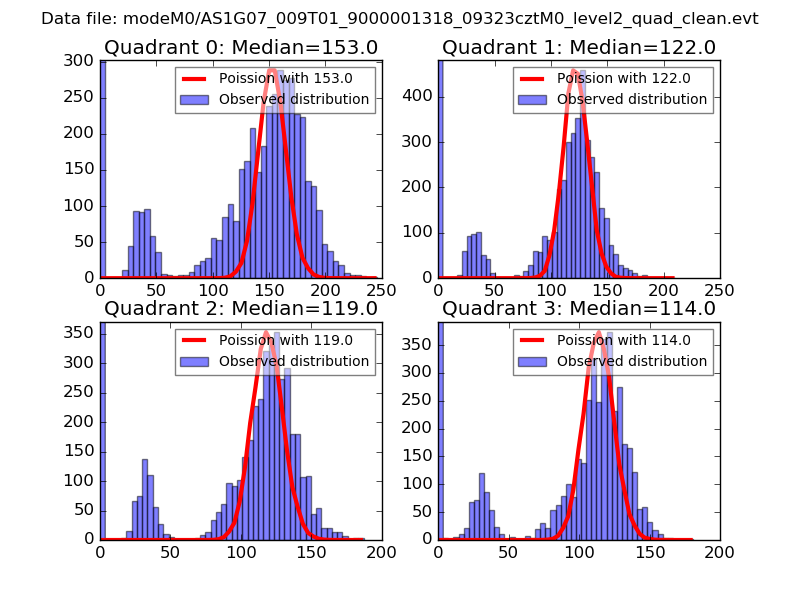 |
 |
| Quadrant-wise count rates Data is divided into 100 sec bins |
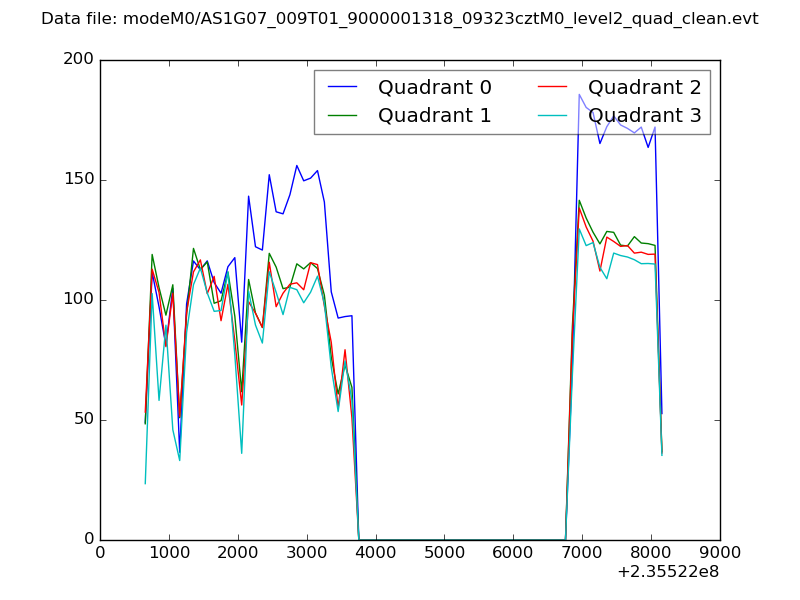 |
|
| Module-wise count rates for Quadrant A Data is divided into 100 sec bins |
 |
 |
| Module-wise count rates for Quadrant B Data is divided into 100 sec bins |
 |
 |
| Module-wise count rates for Quadrant C Data is divided into 100 sec bins |
 |
 |
| Module-wise count rates for Quadrant D Data is divided into 100 sec bins |
 |
 |
| Parameter | Plot |
|---|---|
| CZT HV Monitor |  |
| D_VDD | 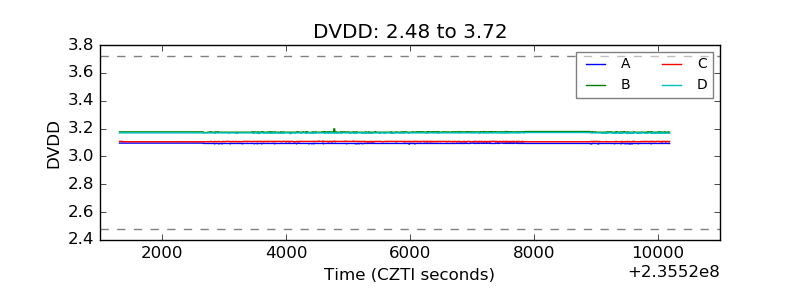 |
| Temperature 1 | 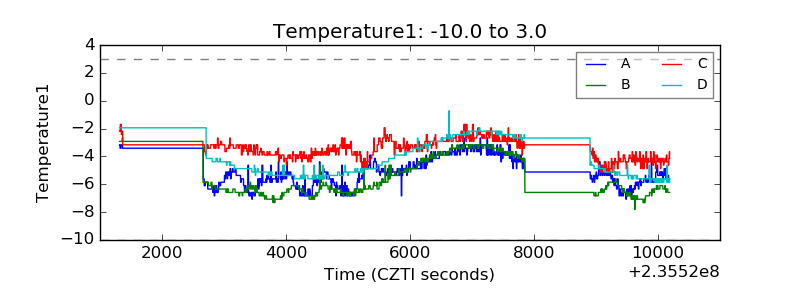 |
| Veto HV Monitor | 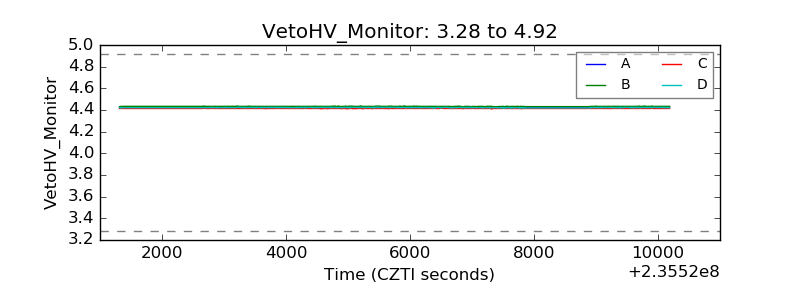 |
| Veto LLD | 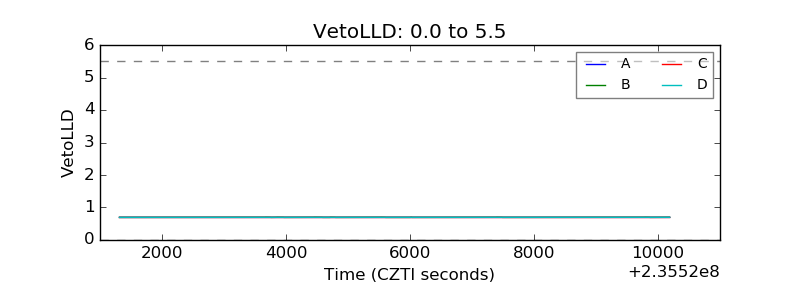 |
| Alpha Counter | 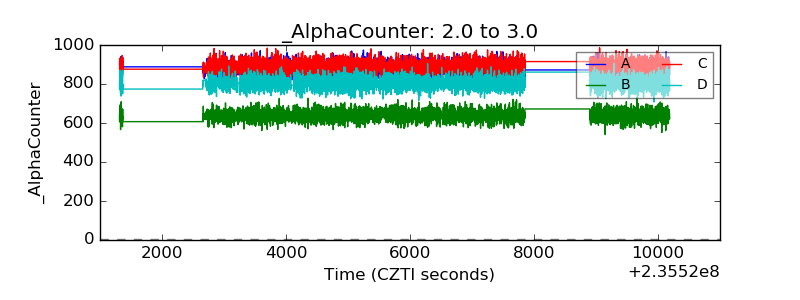 |
| _CPM_Rate | 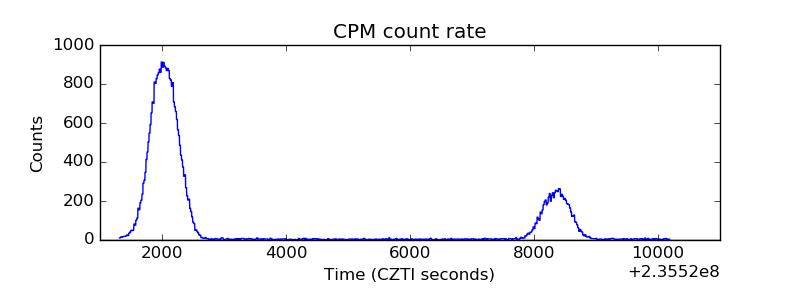 |
| CZT Counter | 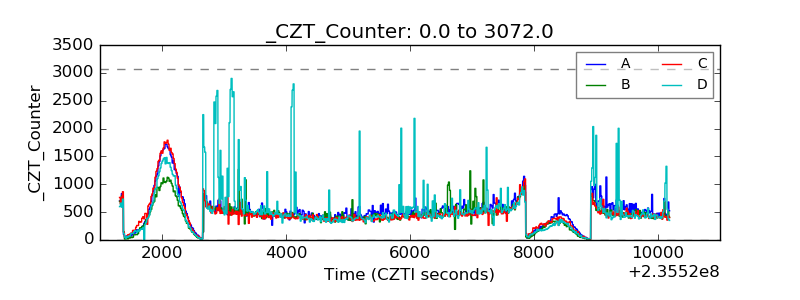 |
| +2.5 Volts monitor | 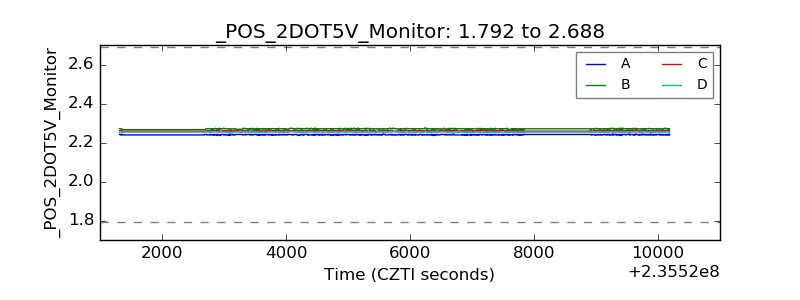 |
| +5 Volts monitor |  |
| _ROLL_ROT | 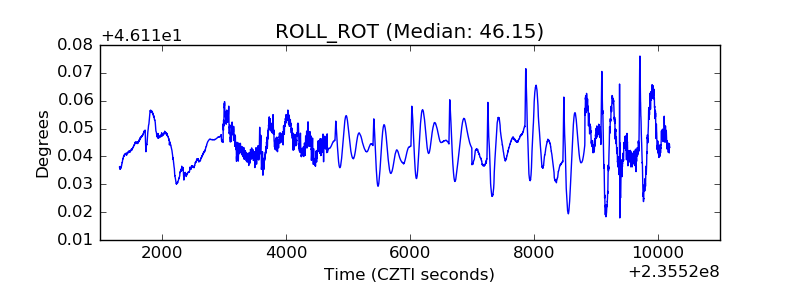 |
| _Roll_DEC | 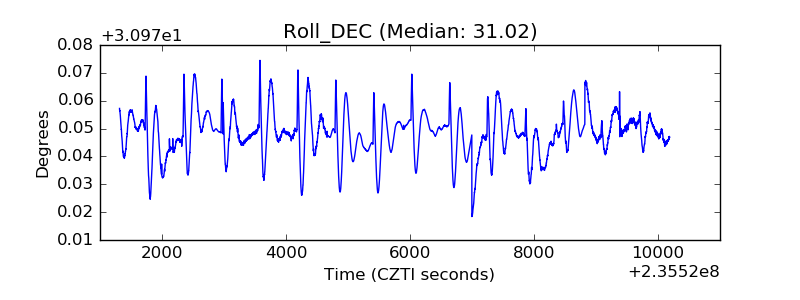 |
| _Roll_RA | 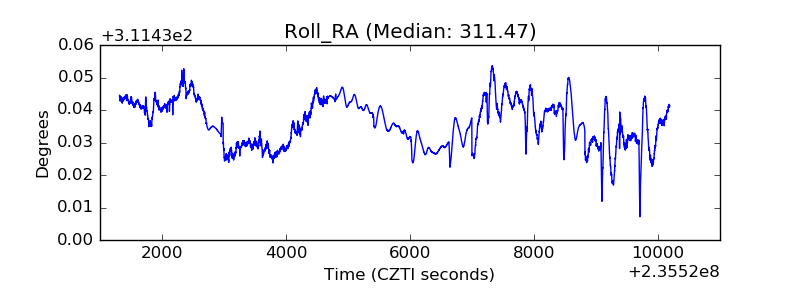 |
| Veto Counter |  |