| Param | Original file | Final file |
|---|---|---|
| Filename | modeM0/AS1G07_009T01_9000001318_09324cztM0_level2.evt | modeM0/AS1G07_009T01_9000001318_09324cztM0_level2_quad_clean.evt |
| Size (bytes) | 842,091,840 | 149,880,960 |
| Size | 803.1 MB | 142.9 MB |
| Events in quadrant A | 6,433,003 | 931,828 |
| Events in quadrant B | 5,674,641 | 956,586 |
| Events in quadrant C | 5,349,138 | 937,591 |
| Events in quadrant D | 7,237,185 | 887,209 |
| Mode M9 | |||
|---|---|---|---|
| Quadrant | BADHDUFLAG | Total packets | Discarded packets |
| A | 0 | 18 | 0 |
| B | 0 | 18 | 0 |
| C | 0 | 18 | 0 |
| D | 0 | 18 | 0 |
| Mode M0 | |||
|---|---|---|---|
| Quadrant | BADHDUFLAG | Total packets | Discarded packets |
| A | 0 | 26834 | 27 |
| B | 0 | 25024 | 20 |
| C | 0 | 24531 | 16 |
| D | 0 | 29973 | 27 |
| Mode SS | |||
|---|---|---|---|
| Quadrant | BADHDUFLAG | Total packets | Discarded packets |
| A | 0 | 242 | 0 |
| B | 0 | 242 | 0 |
| C | 0 | 242 | 0 |
| D | 0 | 242 | 0 |
| Quadrant | Total seconds | Saturated seconds | Saturation percentage |
|---|---|---|---|
| A | 11947 | 96 | 0.803549% |
| B | 11948 | 106 | 0.887178% |
| C | 11950 | 49 | 0.410042% |
| D | 11947 | 445 | 3.724784% |
Noise dominated data is calculated using 1-second bins in cleaned event files. If a bin has >2000 counts, and if more than 50% of those come from <1% of pixels, then it is considered to be noise-dominated and hence unusable.
| Quadrant | # 1 sec bins | Bins with >0 counts | Bins with >2000 counts | High rate bins dominated by noise | Noise dominated (total time) | Noise dominated (detector-on time) | Marked lightcurve |
|---|---|---|---|---|---|---|---|
| A | 13711 | 11959 | 3 | 3 | 0.02% | 0.03% | 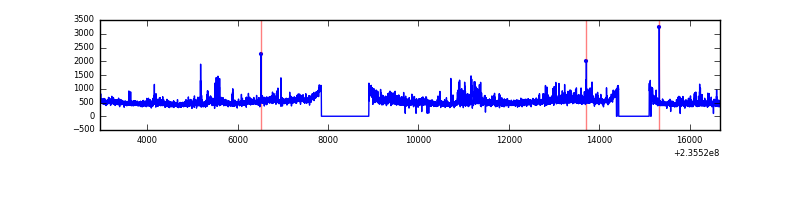 |
| B | 13711 | 11960 | 2 | 2 | 0.01% | 0.02% | 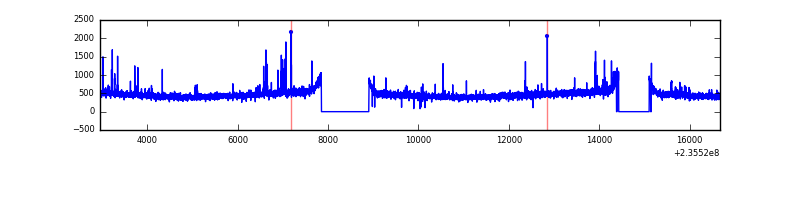 |
| C | 13711 | 11959 | 0 | 0 | 0.00% | 0.00% | 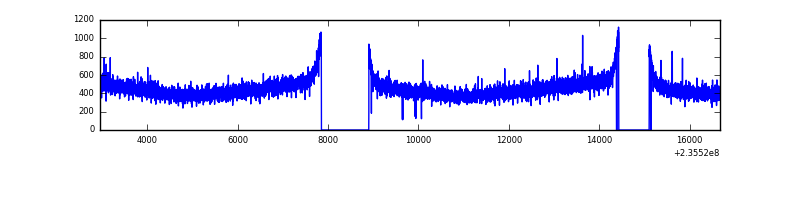 |
| D | 13711 | 11959 | 342 | 342 | 2.49% | 2.86% | 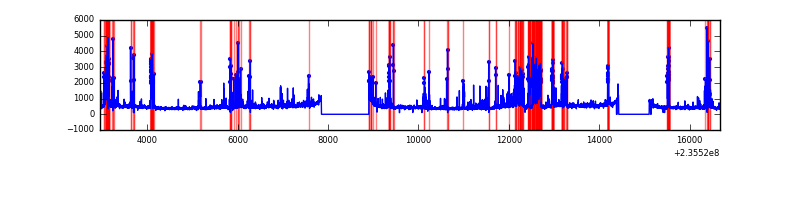 |
Top three noisy pixels from each quadrant. If the there are fewer than three noisy pixels in the level2.evt file, extra rows are filled as -1
| Pixel properties | Quadrant properties | ||||||
|---|---|---|---|---|---|---|---|
| Quadrant | DetID | PixID | Counts | Sigma | Mean | Median | Sigma |
| A | 8 | 5 | 991476 | 3471.33 | 1403 | 1373 | 285.2 |
| A | 1 | 162 | 27607 | 91.98 | 1403 | 1373 | 285.2 |
| A | 0 | 226 | 12662 | 39.58 | 1403 | 1373 | 285.2 |
| B | 10 | 245 | 99449 | 361.63 | 1415 | 1382 | 271.2 |
| B | 8 | 234 | 51705 | 185.57 | 1415 | 1382 | 271.2 |
| B | 12 | 111 | 31011 | 109.26 | 1415 | 1382 | 271.2 |
| C | 13 | 61 | 10412 | 28.47 | 1369 | 1377 | 317.4 |
| C | 8 | 222 | 5528 | 13.08 | 1369 | 1377 | 317.4 |
| C | 10 | 22 | 3969 | 8.17 | 1369 | 1377 | 317.4 |
| D | 12 | 227 | 1512325 | 4403.38 | 1331 | 1300 | 343.2 |
| D | 1 | 52 | 181170 | 524.17 | 1331 | 1300 | 343.2 |
| D | 12 | 233 | 179612 | 519.63 | 1331 | 1300 | 343.2 |
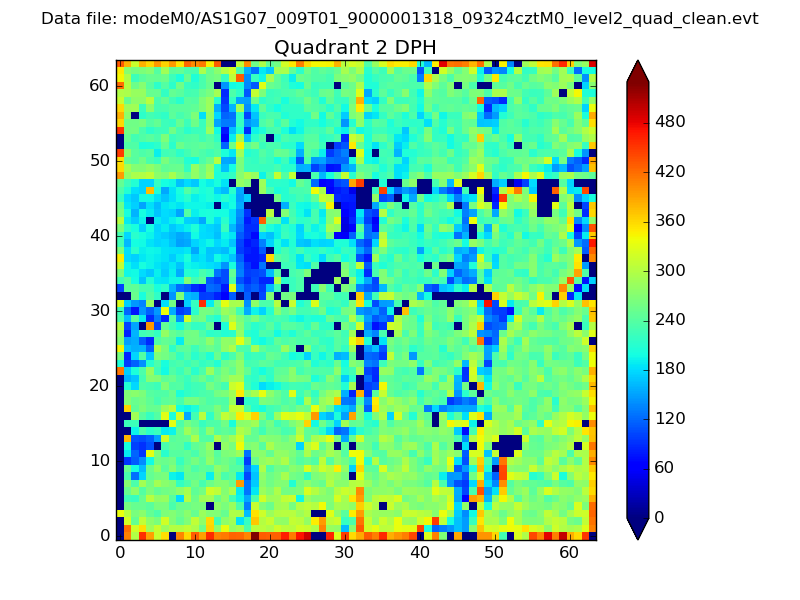
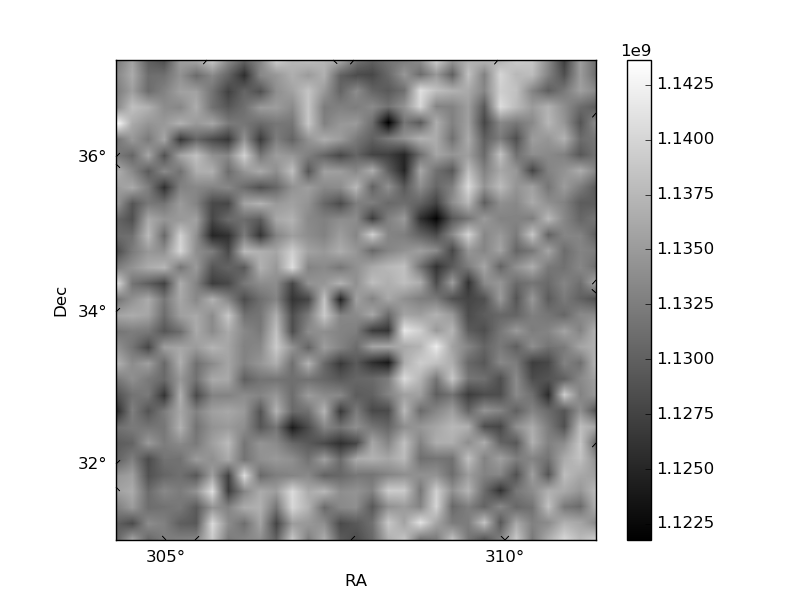
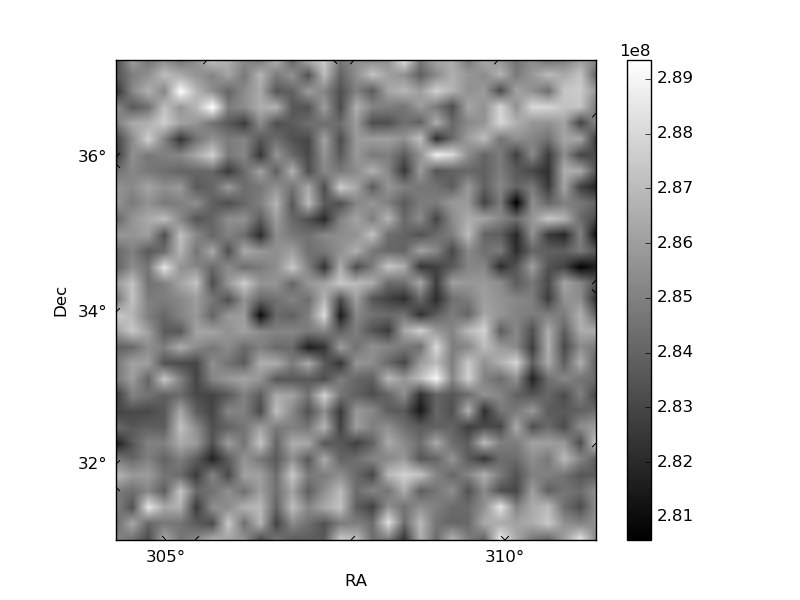
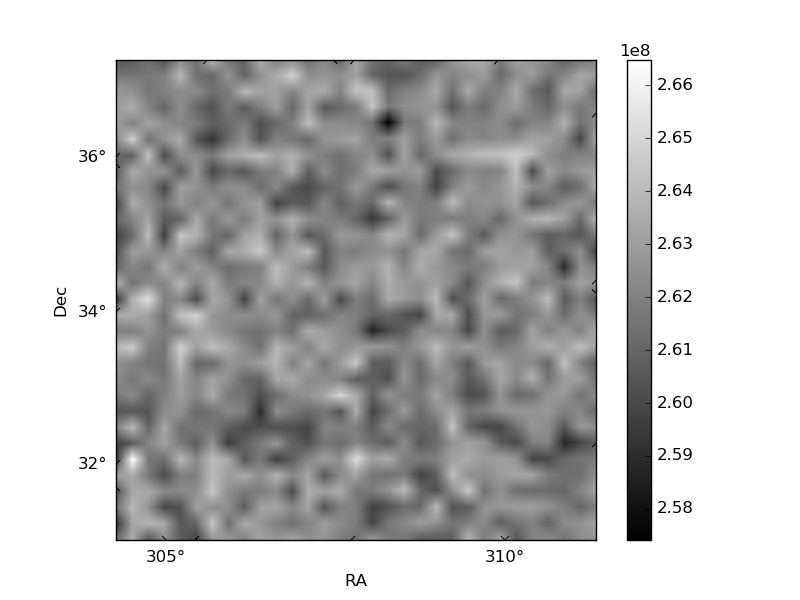
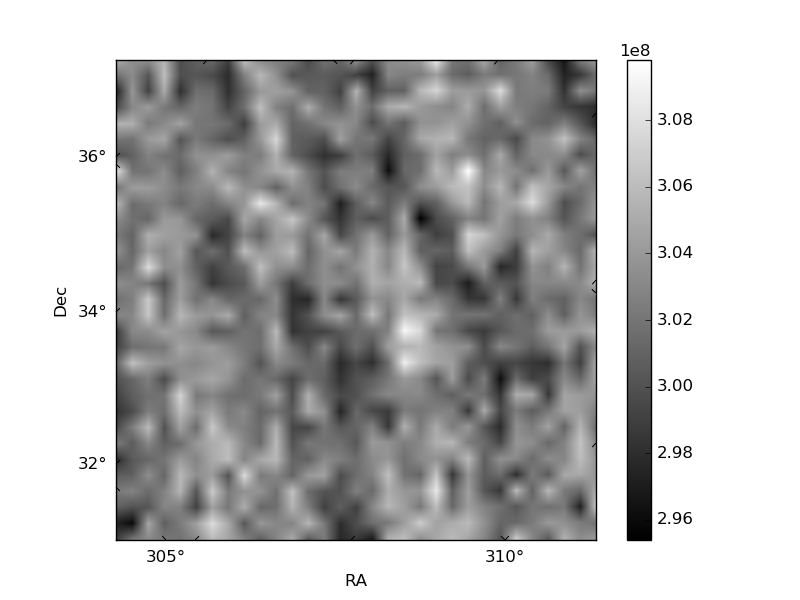
Histogram calculated using DETX and DETY for each event in the final _common_clean file
| Quadrant A | 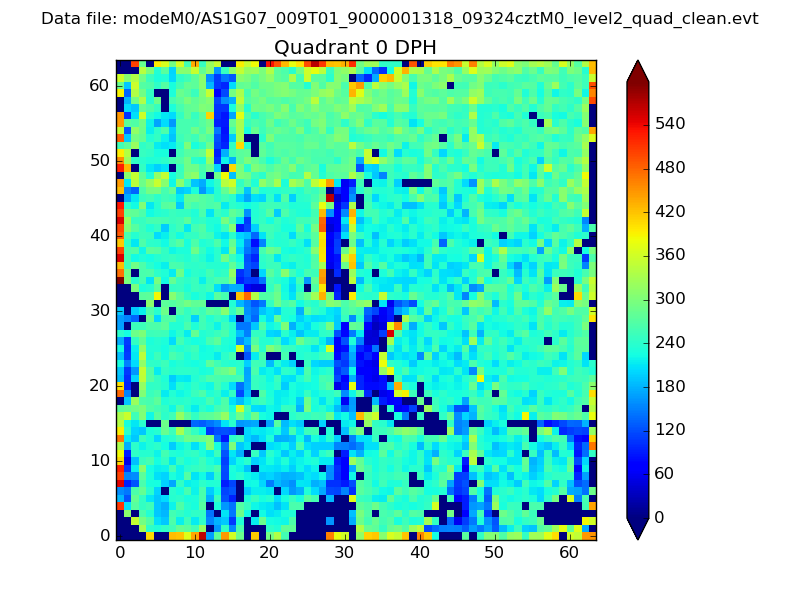 |
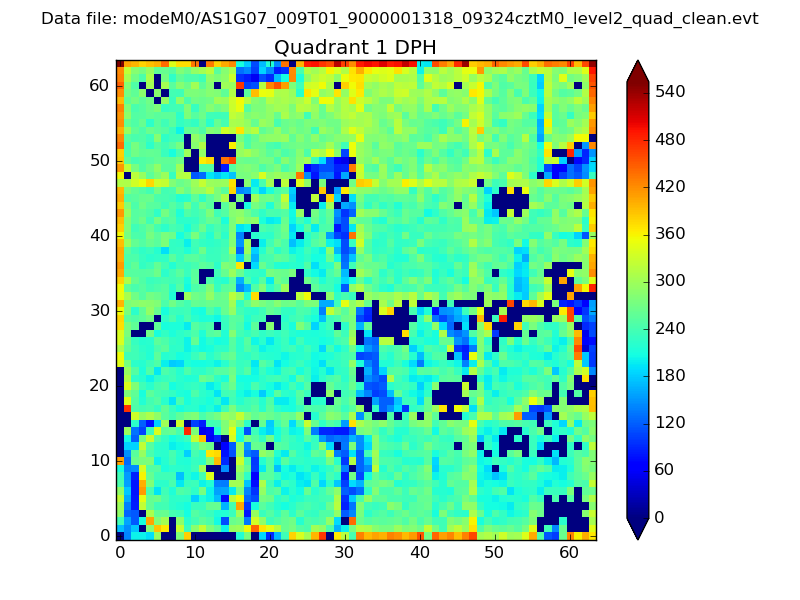 |
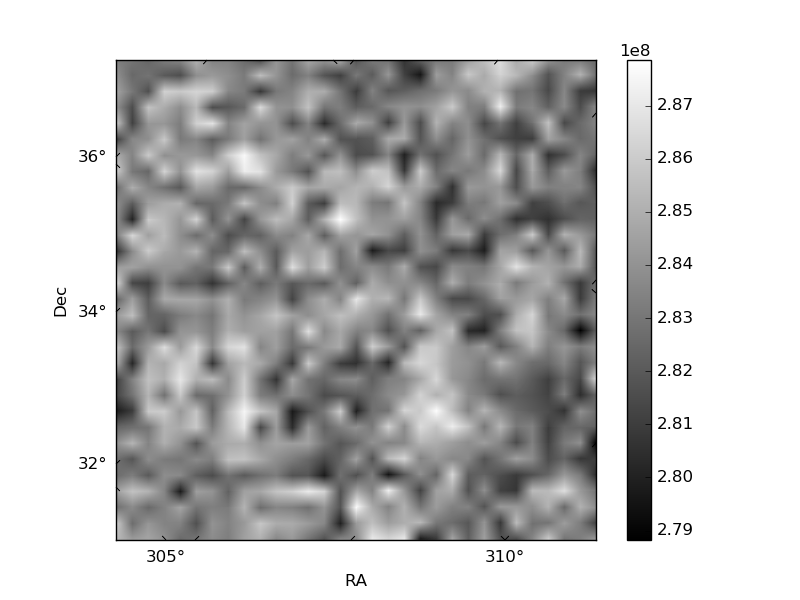
Quadrant B |
|---|---|---|---|
| Quadrant D | 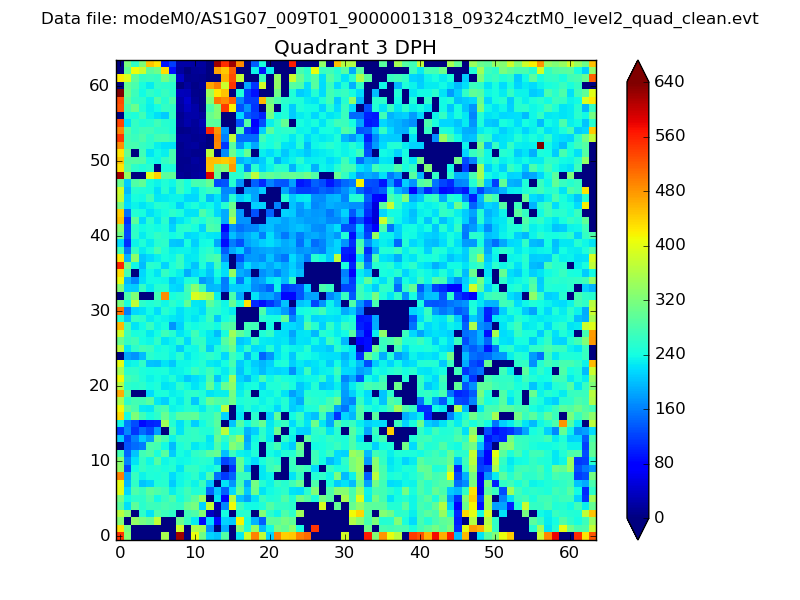 |
 |
Quadrant C |
| Plot type | Count rate plots | Images |
|---|---|---|
| Comparison with Poisson distribution Blue bars denote a histogram of data divided into 1 sec bins. Red curve is a Poisson curve with rate = median count rate of data. |
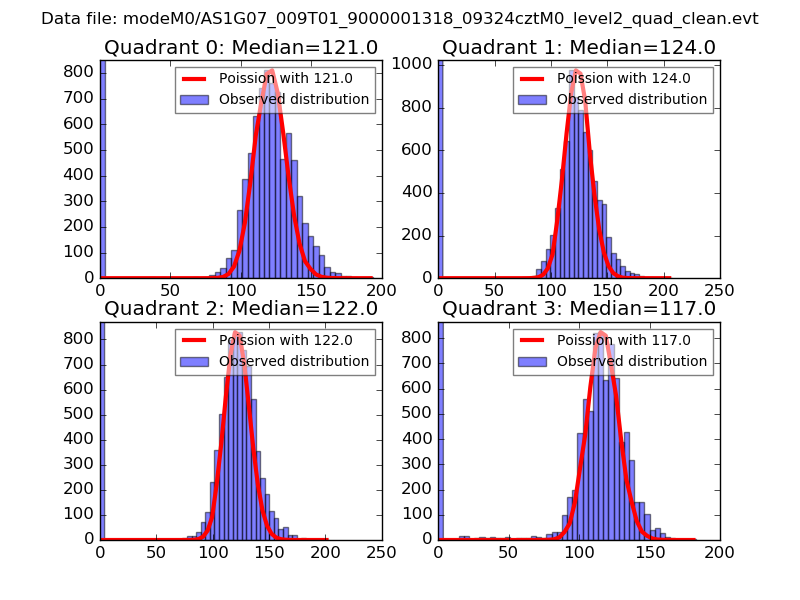 |
 |
| Quadrant-wise count rates Data is divided into 100 sec bins |
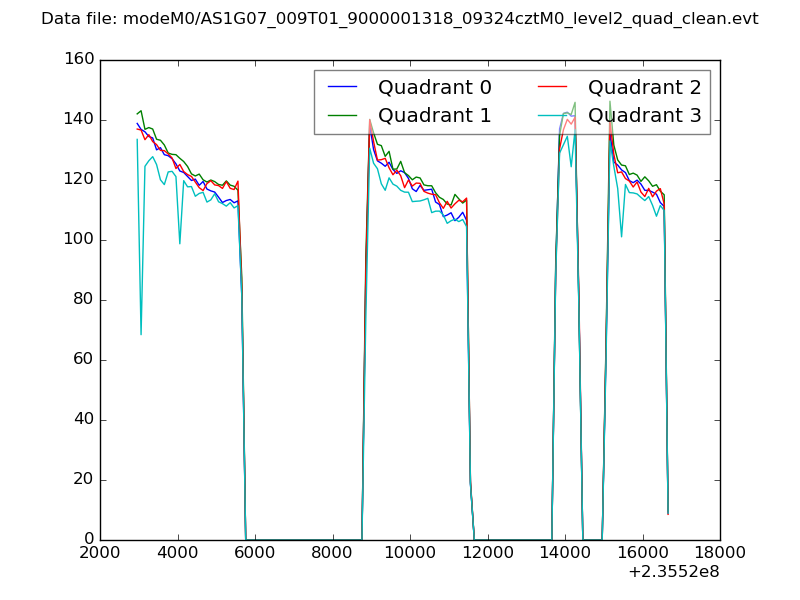 |
|
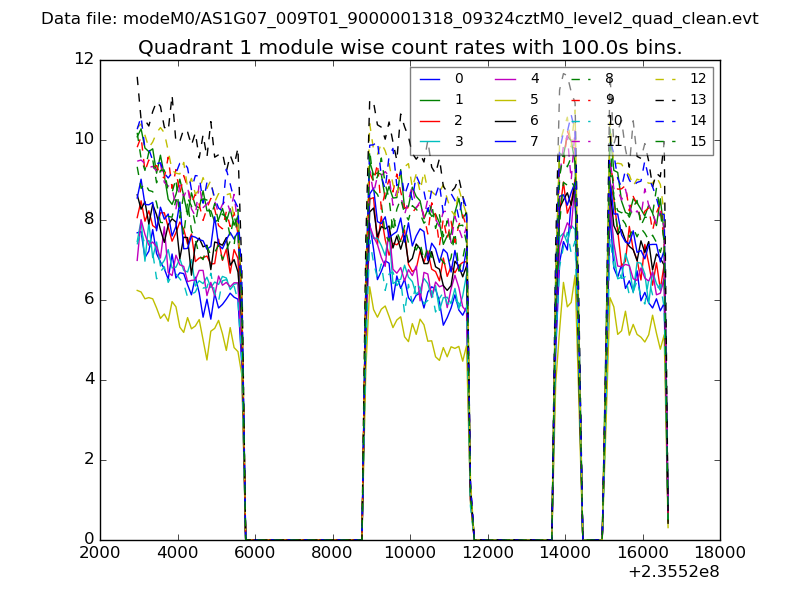
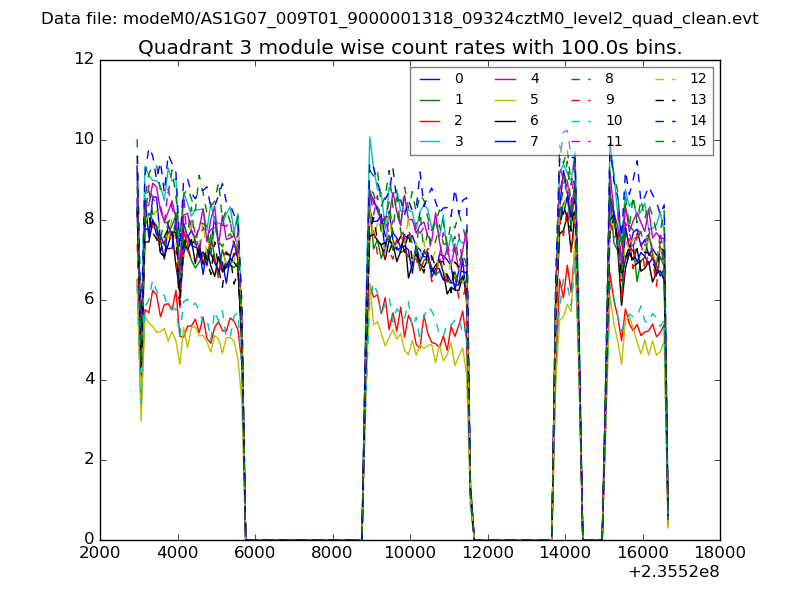
| Module-wise count rates for Quadrant A Data is divided into 100 sec bins |
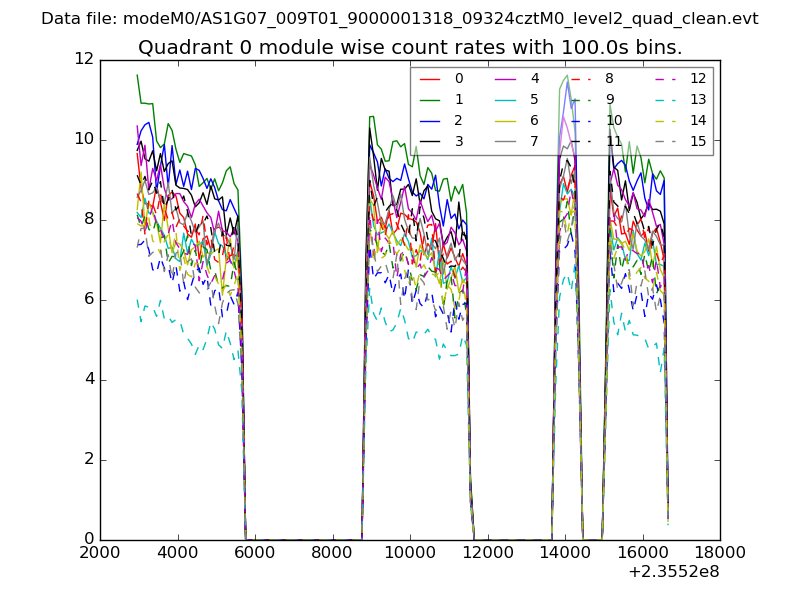 |
 |
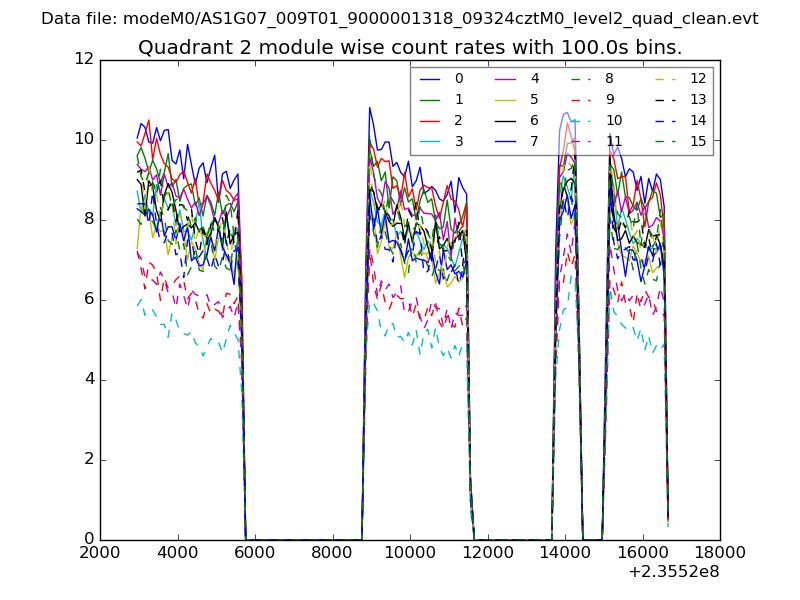
| Module-wise count rates for Quadrant B Data is divided into 100 sec bins |
 |
 |
| Module-wise count rates for Quadrant C Data is divided into 100 sec bins |
 |
 |
| Module-wise count rates for Quadrant D Data is divided into 100 sec bins |
 |
 |
| Parameter | Plot |
|---|---|
| CZT HV Monitor | 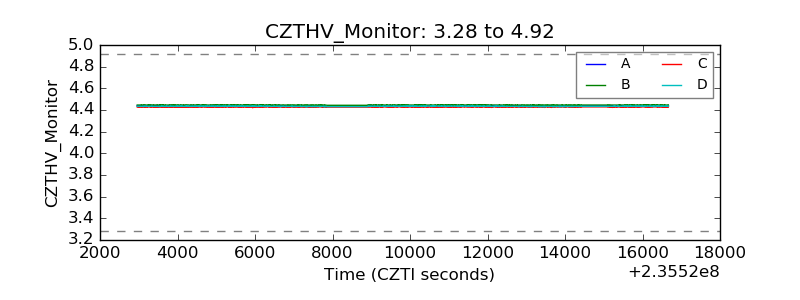 |
| D_VDD | 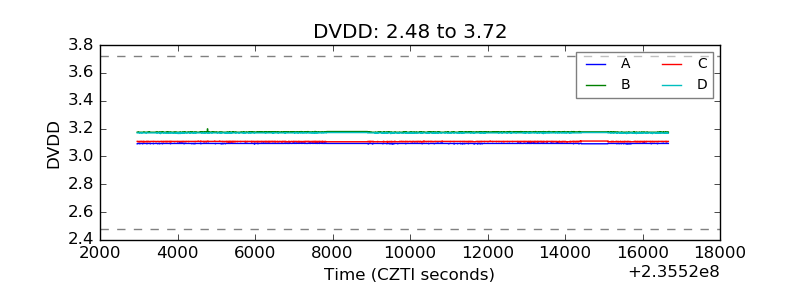 |
| Temperature 1 | 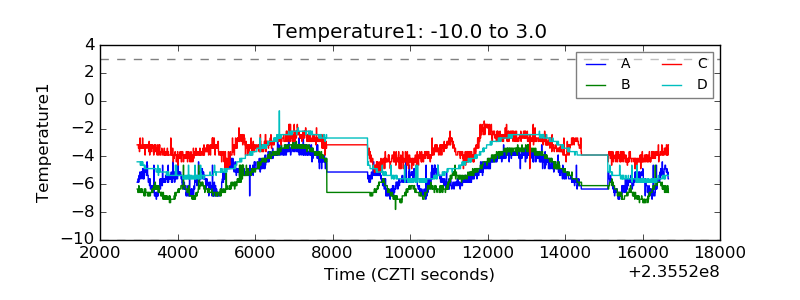 |
| Veto HV Monitor | 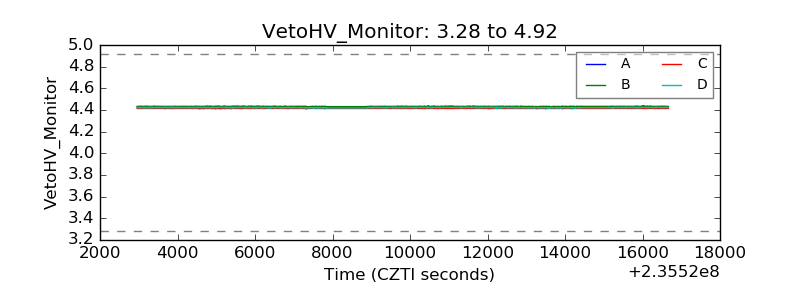 |
| Veto LLD |  |
| Alpha Counter | 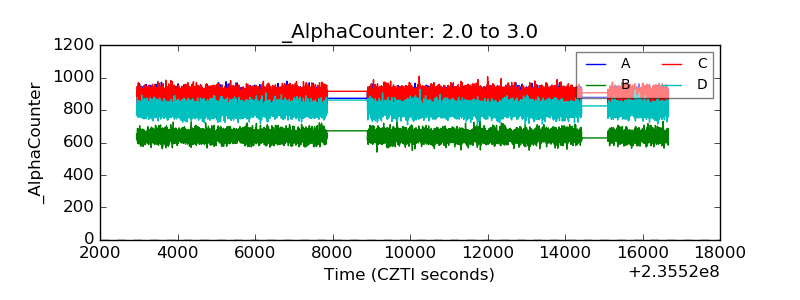 |
| _CPM_Rate | 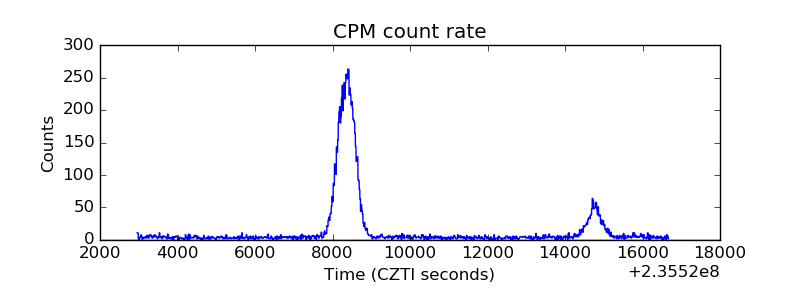 |
| CZT Counter | 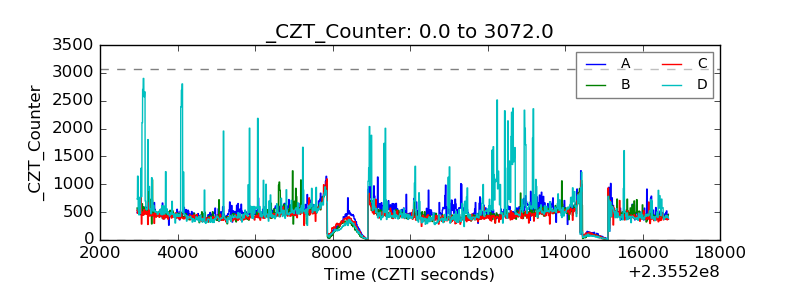 |
| +2.5 Volts monitor |  |
| +5 Volts monitor | 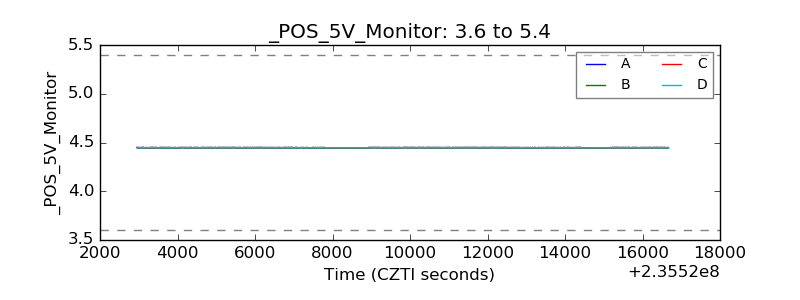 |
| _ROLL_ROT | 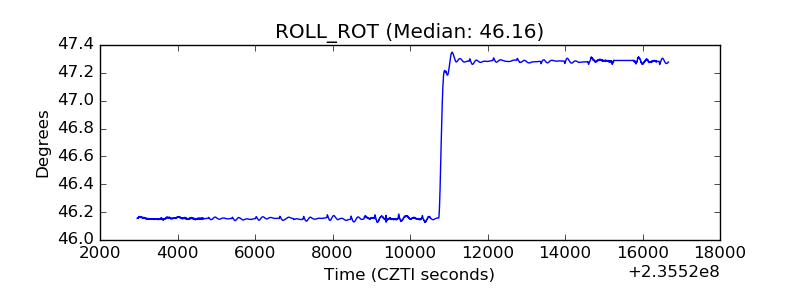 |
| _Roll_DEC | 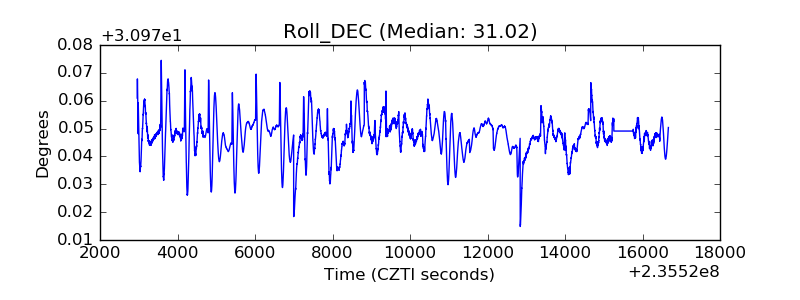 |
| _Roll_RA | 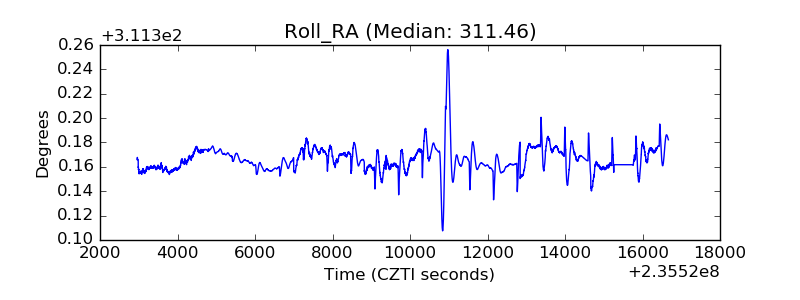 |
| Veto Counter | 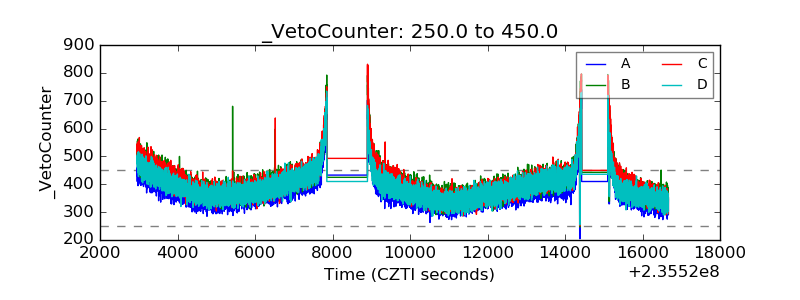 |