| Param | Original file | Final file |
|---|---|---|
| Filename | modeM0/AS1G07_009T01_9000001318_09325cztM0_level2.evt | modeM0/AS1G07_009T01_9000001318_09325cztM0_level2_quad_clean.evt |
| Size (bytes) | 383,359,680 | 79,099,200 |
| Size | 365.6 MB | 75.4 MB |
| Events in quadrant A | 3,171,942 | 484,707 |
| Events in quadrant B | 2,689,214 | 510,456 |
| Events in quadrant C | 2,607,575 | 506,423 |
| Events in quadrant D | 2,737,678 | 480,440 |
| Mode M9 | |||
|---|---|---|---|
| Quadrant | BADHDUFLAG | Total packets | Discarded packets |
| A | 0 | 2 | 2 |
| B | 0 | 2 | 2 |
| C | 0 | 1 | 0 |
| D | 0 | 3 | 1 |
| Mode M0 | |||
|---|---|---|---|
| Quadrant | BADHDUFLAG | Total packets | Discarded packets |
| A | 0 | 17360 | 4147 |
| B | 0 | 15316 | 3326 |
| C | 0 | 15185 | 3080 |
| D | 0 | 15855 | 3521 |
| Mode SS | |||
|---|---|---|---|
| Quadrant | BADHDUFLAG | Total packets | Discarded packets |
| A | 0 | 154 | 32 |
| B | 0 | 154 | 34 |
| C | 0 | 154 | 28 |
| D | 0 | 153 | 35 |
| Quadrant | Total seconds | Saturated seconds | Saturation percentage |
|---|---|---|---|
| A | 5780 | 31 | 0.536332% |
| B | 5906 | 11 | 0.186251% |
| C | 5997 | 4 | 0.066700% |
| D | 5879 | 38 | 0.646368% |
Noise dominated data is calculated using 1-second bins in cleaned event files. If a bin has >2000 counts, and if more than 50% of those come from <1% of pixels, then it is considered to be noise-dominated and hence unusable.
| Quadrant | # 1 sec bins | Bins with >0 counts | Bins with >2000 counts | High rate bins dominated by noise | Noise dominated (total time) | Noise dominated (detector-on time) | Marked lightcurve |
|---|---|---|---|---|---|---|---|
| A | 7720 | 6631 | 2 | 2 | 0.03% | 0.03% | 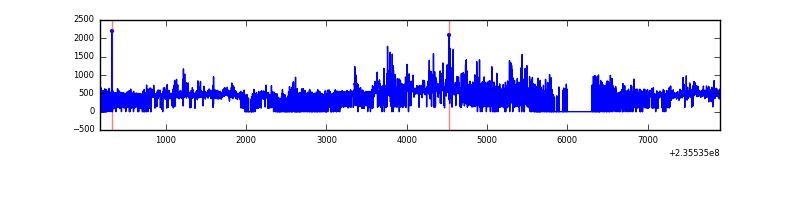 |
| B | 7719 | 6711 | 0 | 0 | 0.00% | 0.00% | 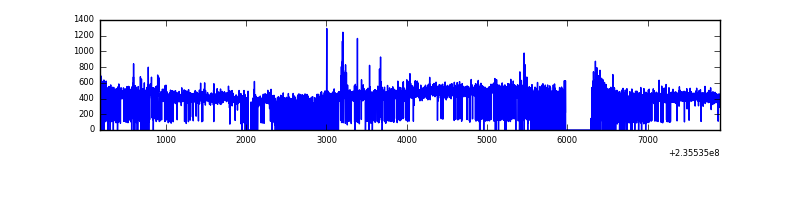 |
| C | 7720 | 6770 | 1 | 1 | 0.01% | 0.01% | 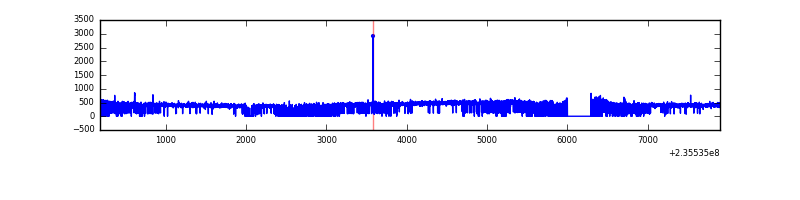 |
| D | 7722 | 6724 | 24 | 24 | 0.31% | 0.36% | 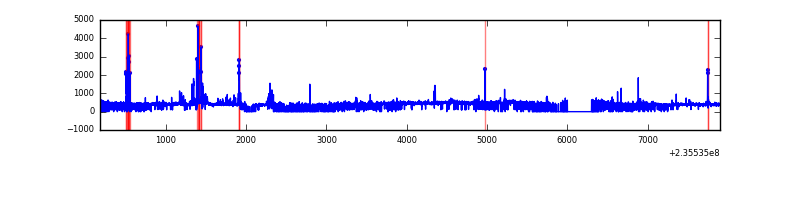 |
Top three noisy pixels from each quadrant. If the there are fewer than three noisy pixels in the level2.evt file, extra rows are filled as -1
| Pixel properties | Quadrant properties | ||||||
|---|---|---|---|---|---|---|---|
| Quadrant | DetID | PixID | Counts | Sigma | Mean | Median | Sigma |
| A | 8 | 5 | 625257 | 4636.5 | 656 | 643 | 134.7 |
| A | 1 | 162 | 14906 | 105.87 | 656 | 643 | 134.7 |
| A | 0 | 226 | 5834 | 38.53 | 656 | 643 | 134.7 |
| B | 8 | 234 | 22993 | 169.48 | 677 | 660 | 131.8 |
| B | 10 | 245 | 21232 | 156.12 | 677 | 660 | 131.8 |
| B | 12 | 111 | 14983 | 108.7 | 677 | 660 | 131.8 |
| C | 10 | 22 | 6768 | 39.49 | 664 | 668 | 154.5 |
| C | 13 | 61 | 4939 | 27.65 | 664 | 668 | 154.5 |
| C | 9 | 68 | 3616 | 19.09 | 664 | 668 | 154.5 |
| D | 12 | 227 | 129592 | 771.18 | 641 | 625 | 167.2 |
| D | 1 | 52 | 84064 | 498.94 | 641 | 625 | 167.2 |
| D | 12 | 233 | 37475 | 220.35 | 641 | 625 | 167.2 |
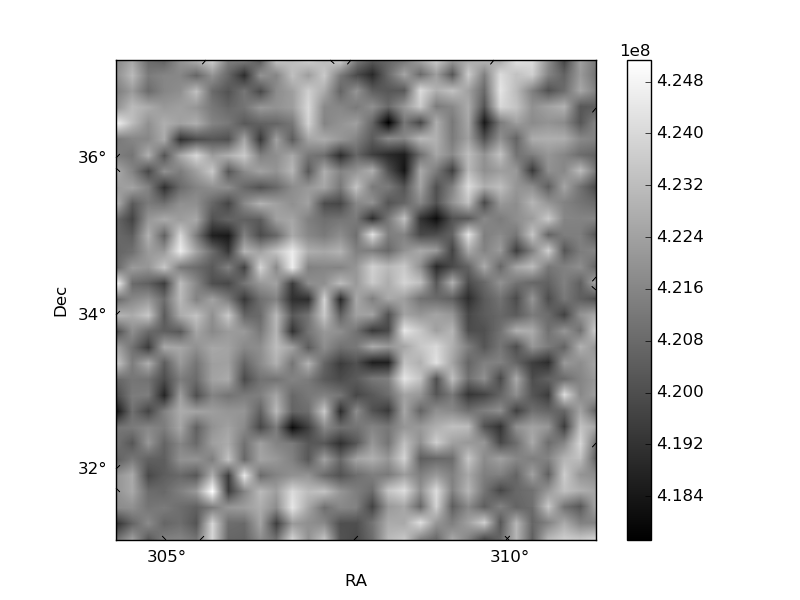
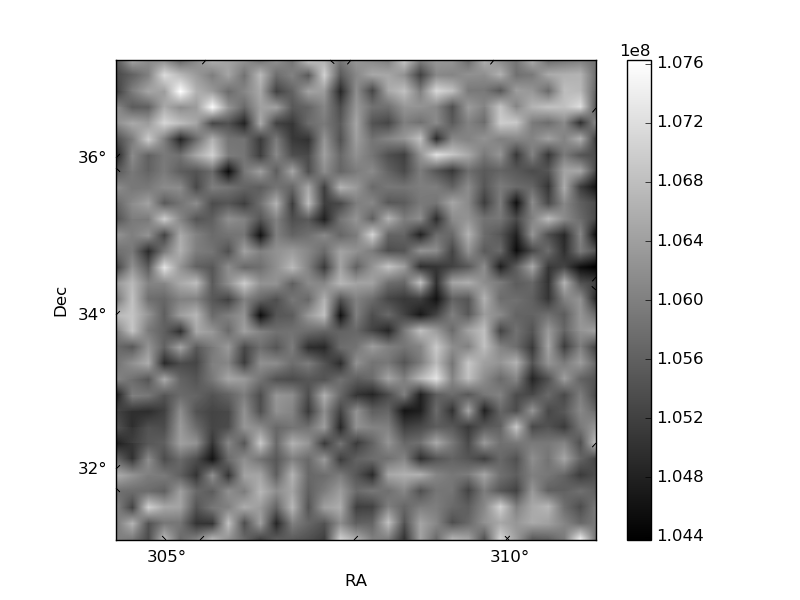
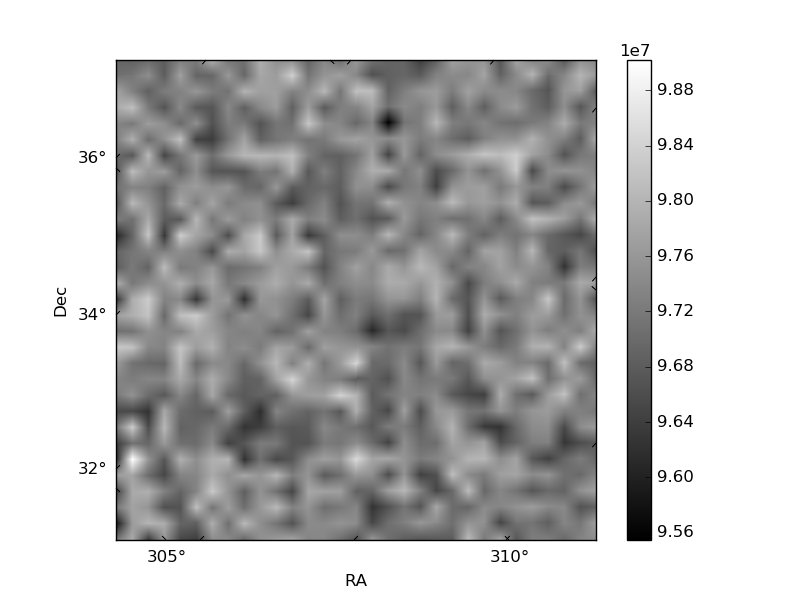
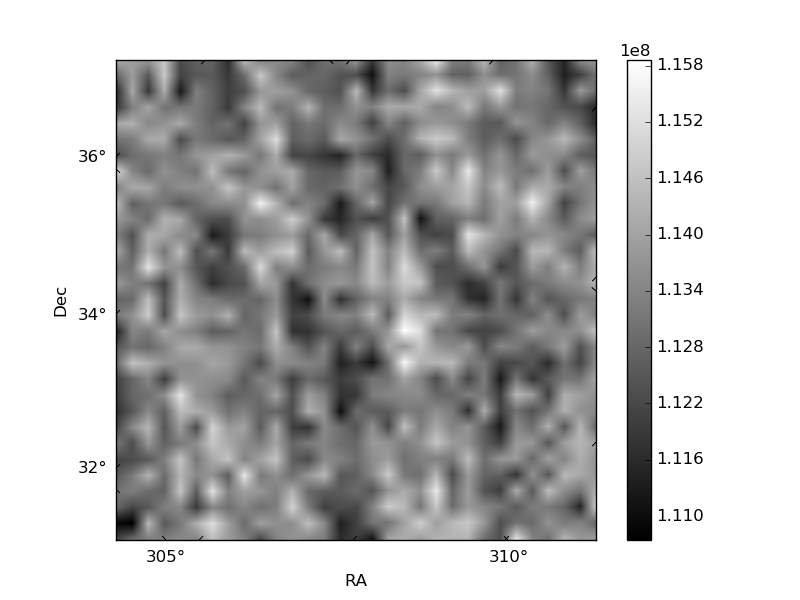
Histogram calculated using DETX and DETY for each event in the final _common_clean file
| Quadrant A | 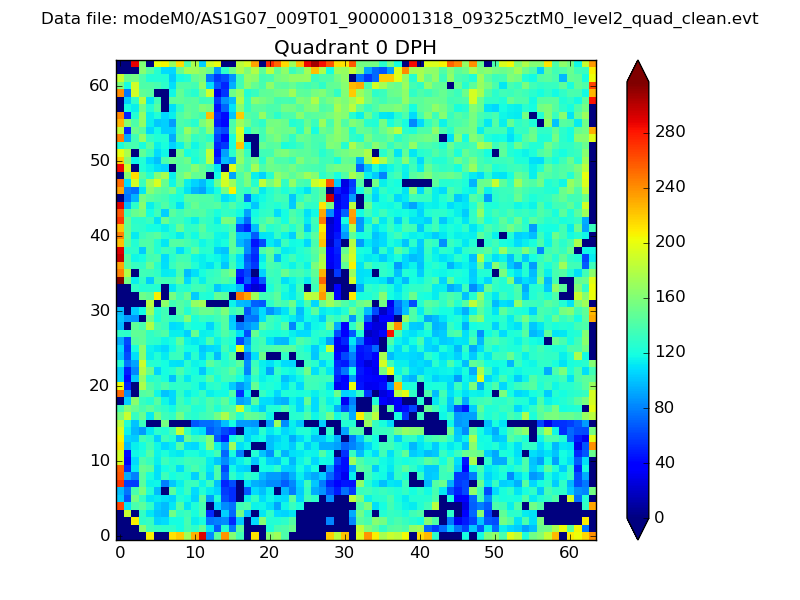 |
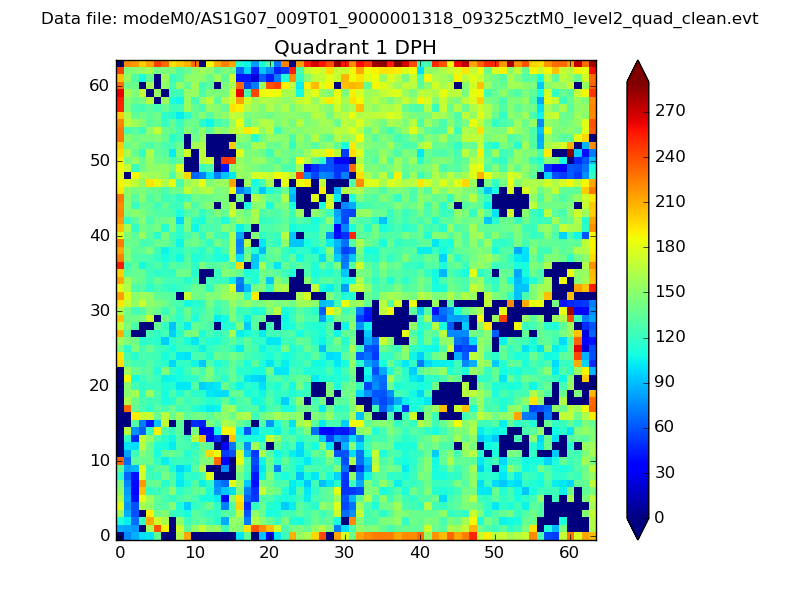 |
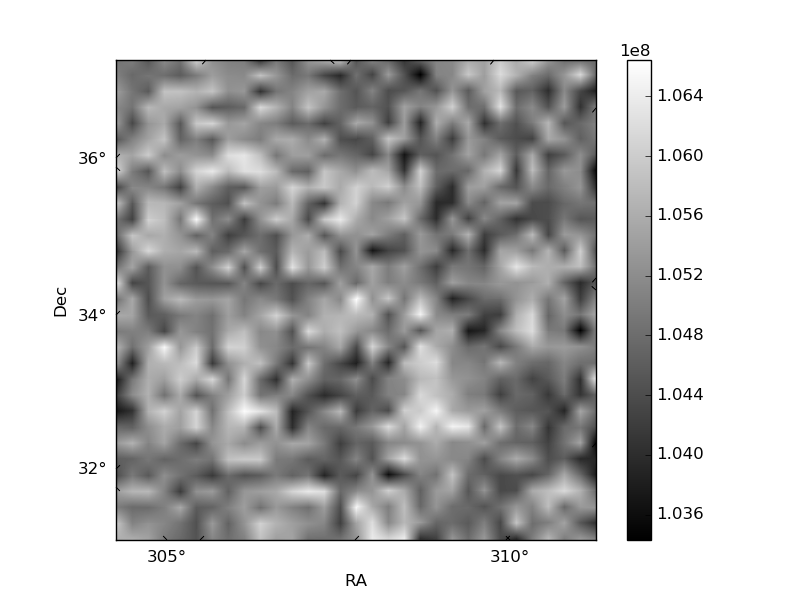
Quadrant B |
|---|---|---|---|
| Quadrant D | 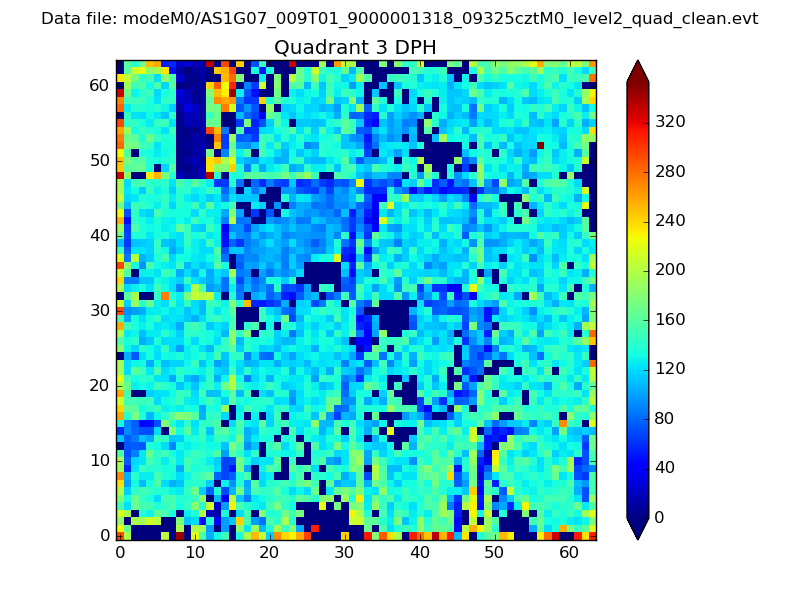 |
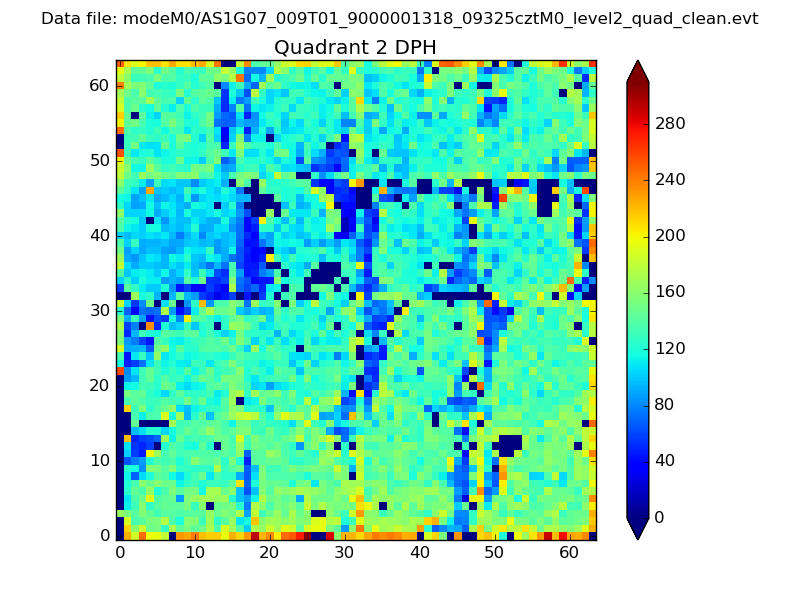 |
Quadrant C |
| Plot type | Count rate plots | Images |
|---|---|---|
| Comparison with Poisson distribution Blue bars denote a histogram of data divided into 1 sec bins. Red curve is a Poisson curve with rate = median count rate of data. |
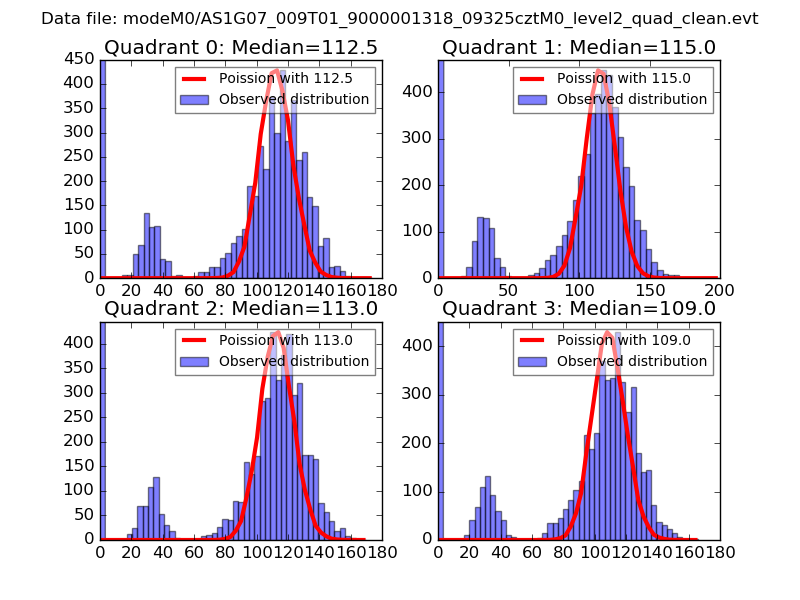 |
 |
| Quadrant-wise count rates Data is divided into 100 sec bins |
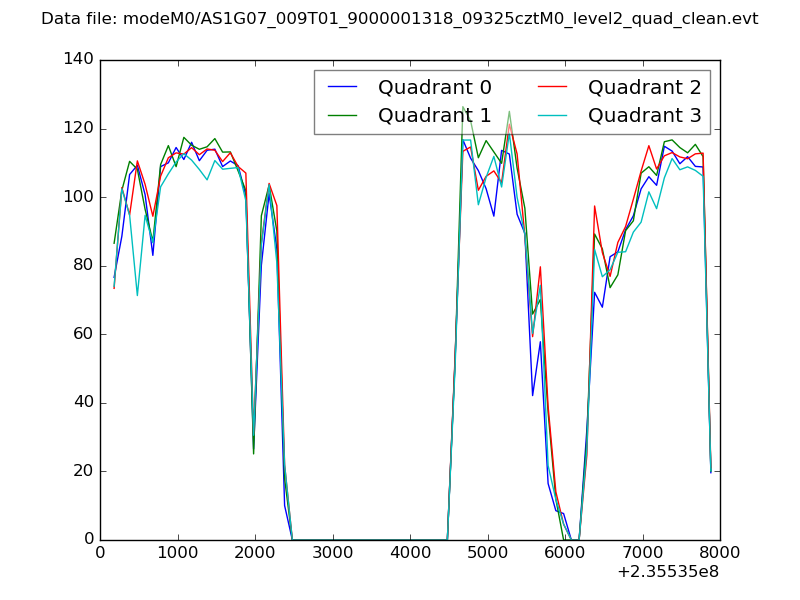 |
|
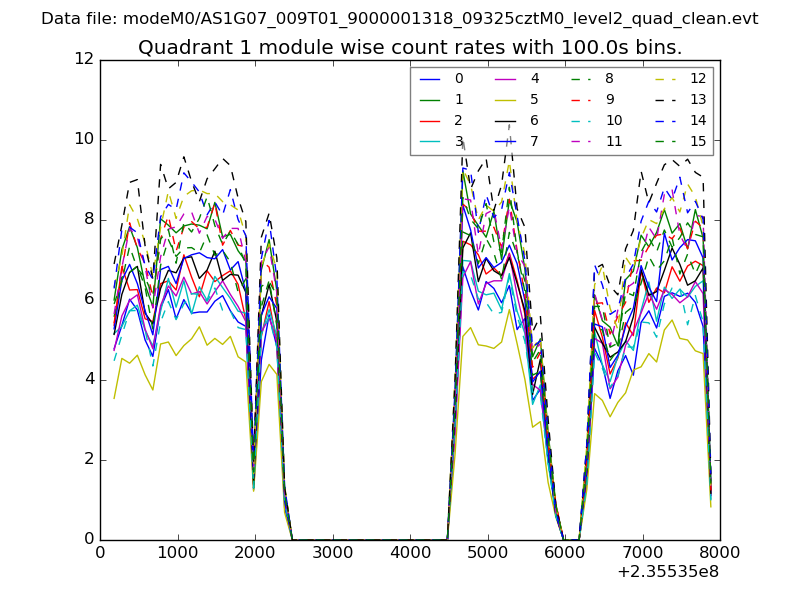
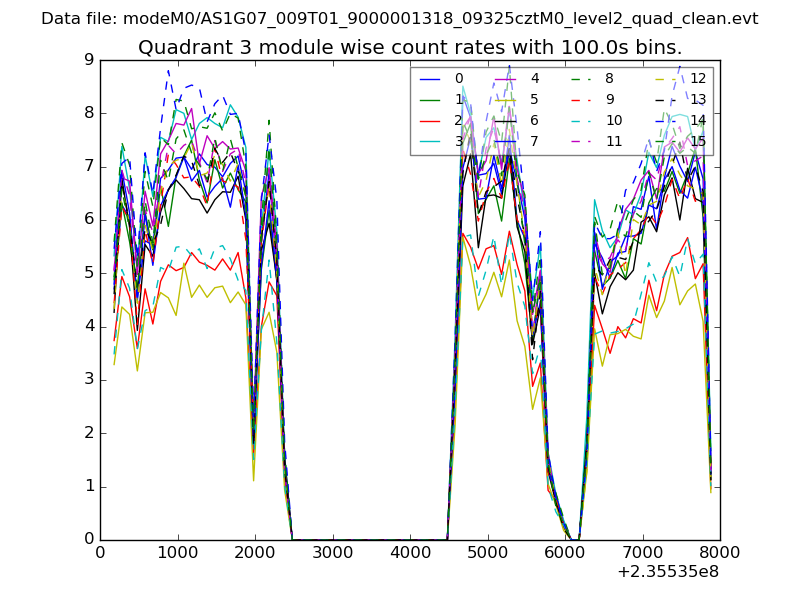
| Module-wise count rates for Quadrant A Data is divided into 100 sec bins |
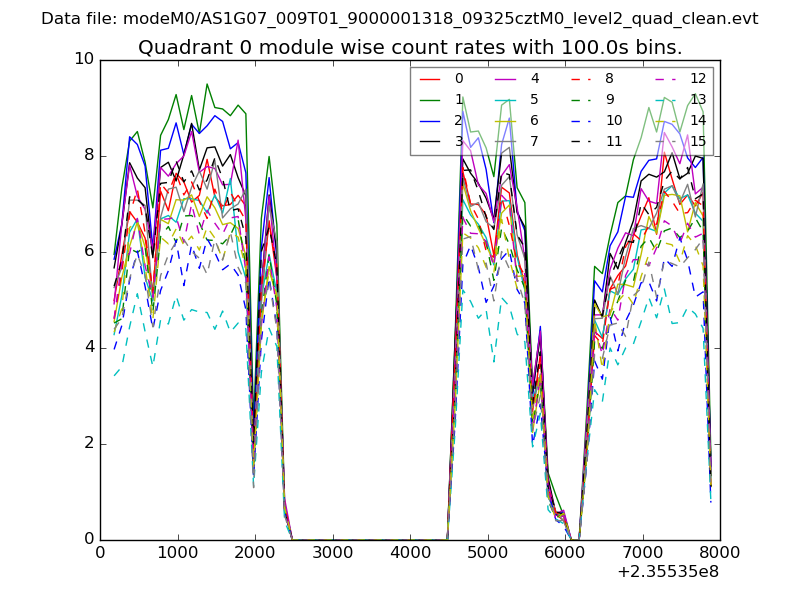 |
 |
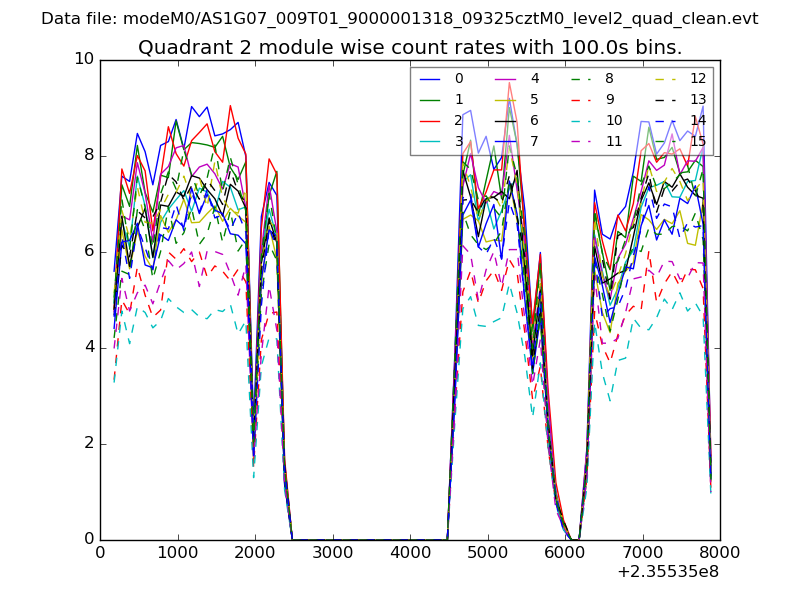
| Module-wise count rates for Quadrant B Data is divided into 100 sec bins |
 |
 |
| Module-wise count rates for Quadrant C Data is divided into 100 sec bins |
 |
 |
| Module-wise count rates for Quadrant D Data is divided into 100 sec bins |
 |
 |
| Parameter | Plot |
|---|---|
| CZT HV Monitor | 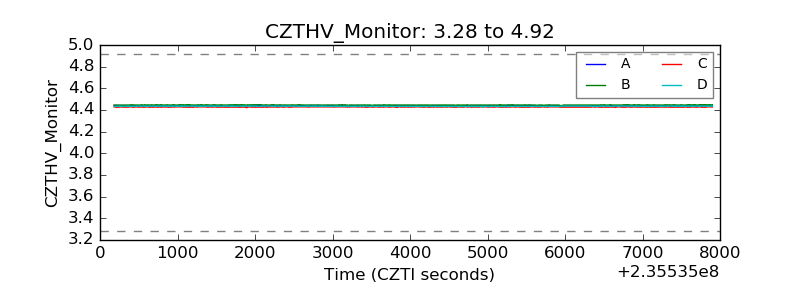 |
| D_VDD | 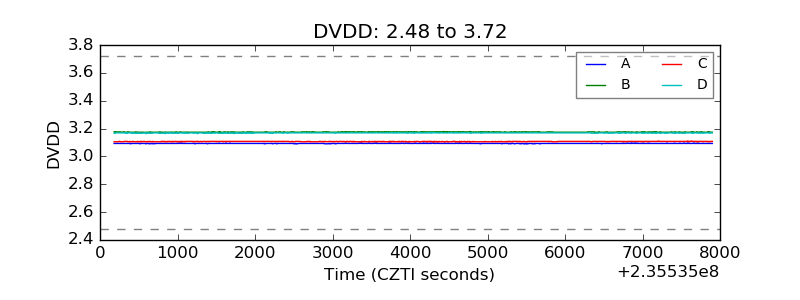 |
| Temperature 1 | 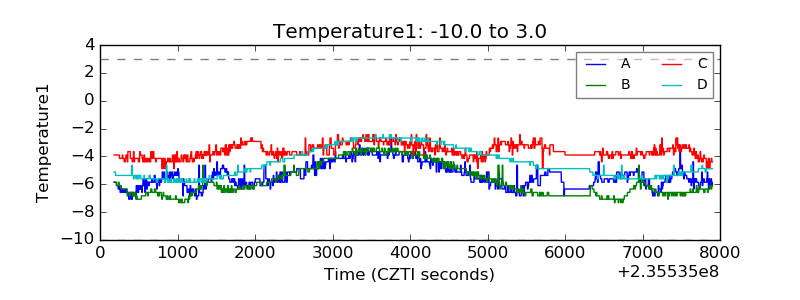 |
| Veto HV Monitor | 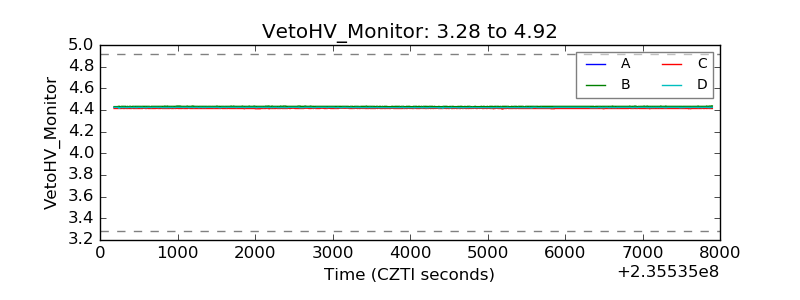 |
| Veto LLD | 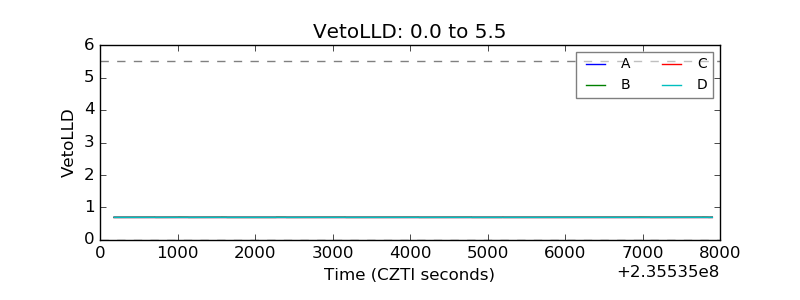 |
| Alpha Counter | 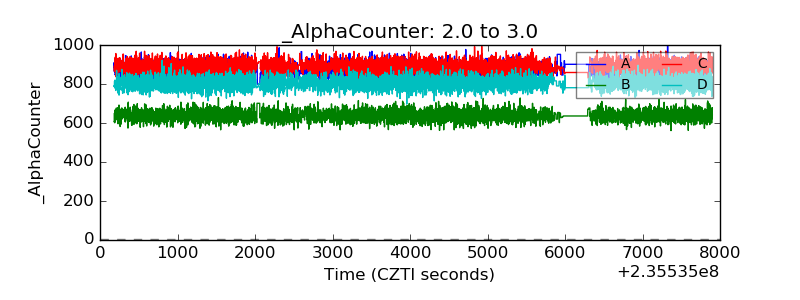 |
| _CPM_Rate | 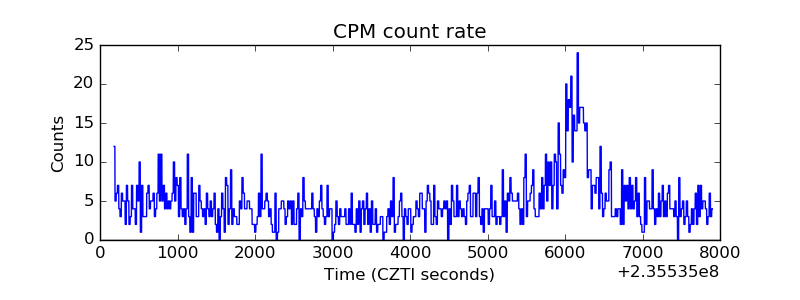 |
| CZT Counter | 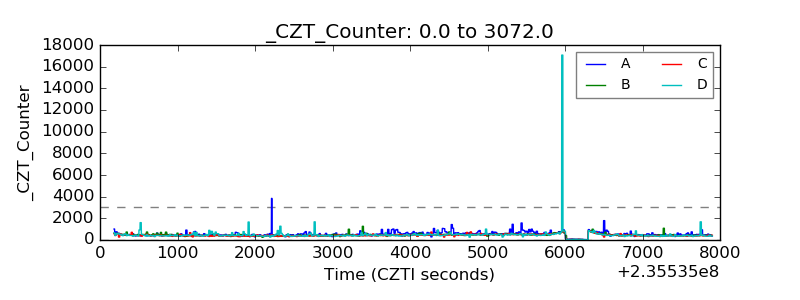 |
| +2.5 Volts monitor | 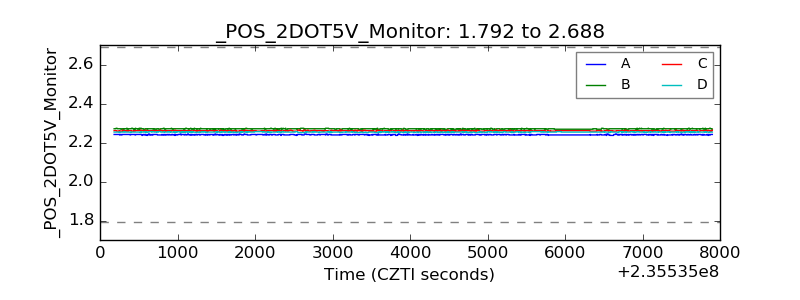 |
| +5 Volts monitor | 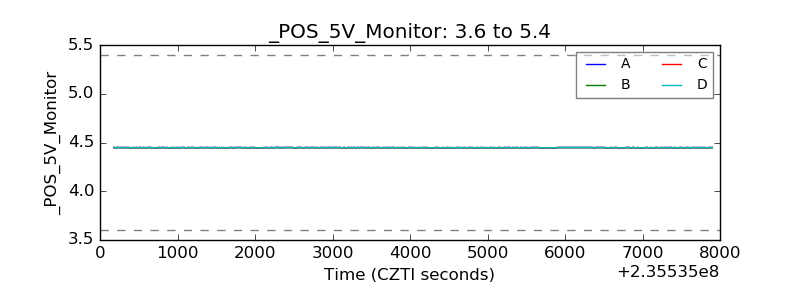 |
| _ROLL_ROT | 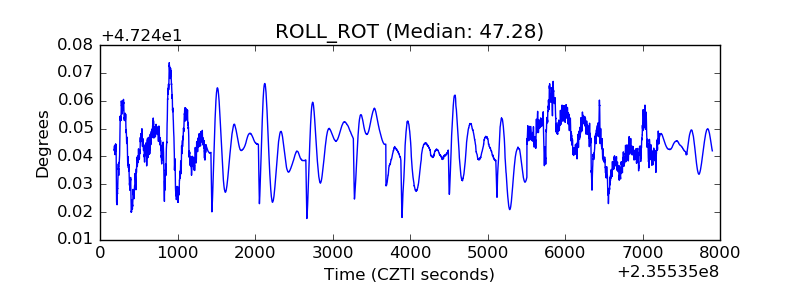 |
| _Roll_DEC | 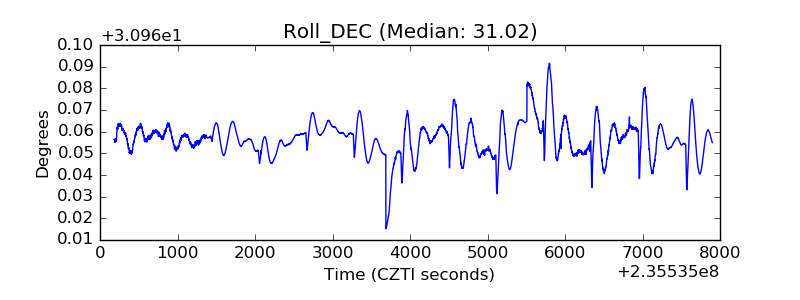 |
| _Roll_RA | 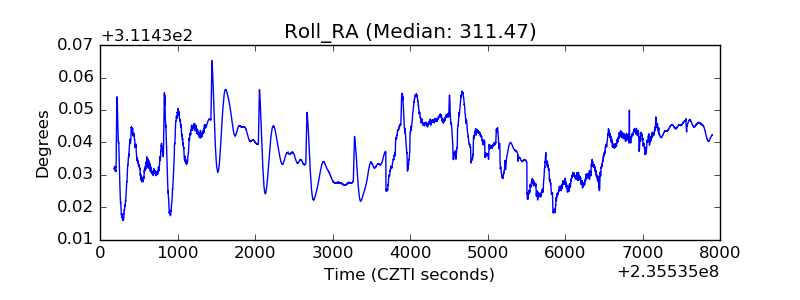 |
| Veto Counter | 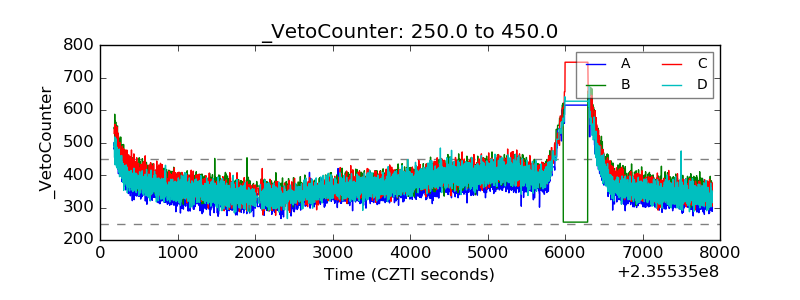 |