| Param | Original file | Final file |
|---|---|---|
| Filename | modeM0/AS1G07_009T01_9000001318_09326cztM0_level2.evt | modeM0/AS1G07_009T01_9000001318_09326cztM0_level2_quad_clean.evt |
| Size (bytes) | 626,857,920 | 120,461,760 |
| Size | 597.8 MB | 114.9 MB |
| Events in quadrant A | 5,200,664 | 736,455 |
| Events in quadrant B | 4,481,860 | 776,585 |
| Events in quadrant C | 4,236,323 | 753,352 |
| Events in quadrant D | 4,420,095 | 724,246 |
| Mode M9 | |||
|---|---|---|---|
| Quadrant | BADHDUFLAG | Total packets | Discarded packets |
| A | 0 | 2 | 0 |
| B | 0 | 3 | 0 |
| C | 0 | 2 | 0 |
| D | 0 | 3 | 0 |
| Mode M0 | |||
|---|---|---|---|
| Quadrant | BADHDUFLAG | Total packets | Discarded packets |
| A | 0 | 21498 | 0 |
| B | 0 | 19667 | 0 |
| C | 0 | 19310 | 0 |
| D | 0 | 19716 | 0 |
| Mode SS | |||
|---|---|---|---|
| Quadrant | BADHDUFLAG | Total packets | Discarded packets |
| A | 0 | 194 | 0 |
| B | 0 | 214 | 0 |
| C | 0 | 206 | 0 |
| D | 0 | 204 | 0 |
| Quadrant | Total seconds | Saturated seconds | Saturation percentage |
|---|---|---|---|
| A | 9287 | 144 | 1.550555% |
| B | 9500 | 137 | 1.442105% |
| C | 9466 | 71 | 0.750053% |
| D | 9343 | 95 | 1.016804% |
Noise dominated data is calculated using 1-second bins in cleaned event files. If a bin has >2000 counts, and if more than 50% of those come from <1% of pixels, then it is considered to be noise-dominated and hence unusable.
| Quadrant | # 1 sec bins | Bins with >0 counts | Bins with >2000 counts | High rate bins dominated by noise | Noise dominated (total time) | Noise dominated (detector-on time) | Marked lightcurve |
|---|---|---|---|---|---|---|---|
| A | 13994 | 11462 | 1 | 1 | 0.01% | 0.01% | 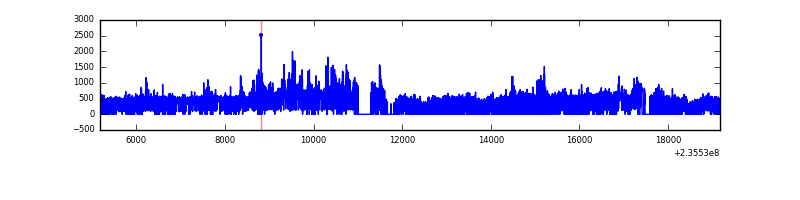 |
| B | 13993 | 11556 | 4 | 4 | 0.03% | 0.03% | 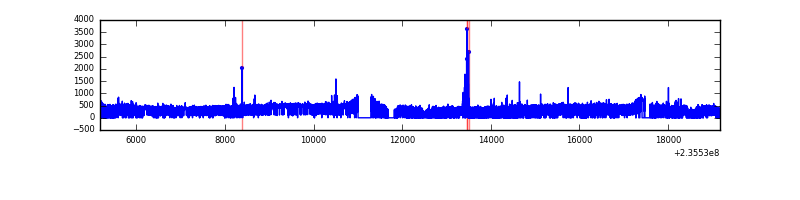 |
| C | 13992 | 11557 | 1 | 1 | 0.01% | 0.01% | 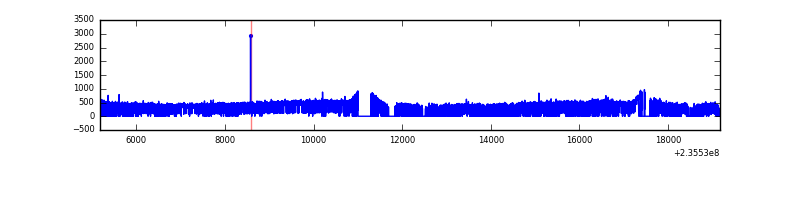 |
| D | 13989 | 11475 | 12 | 12 | 0.09% | 0.10% | 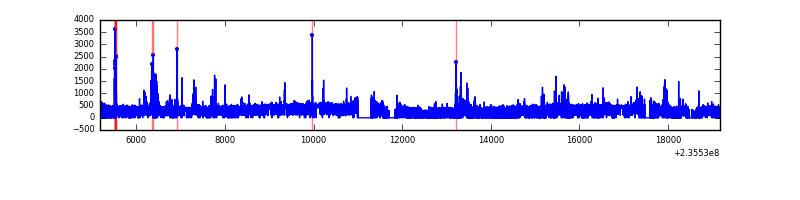 |
Top three noisy pixels from each quadrant. If the there are fewer than three noisy pixels in the level2.evt file, extra rows are filled as -1
| Pixel properties | Quadrant properties | ||||||
|---|---|---|---|---|---|---|---|
| Quadrant | DetID | PixID | Counts | Sigma | Mean | Median | Sigma |
| A | 8 | 5 | 972523 | 4386.85 | 1084 | 1058 | 221.4 |
| A | 1 | 162 | 34664 | 151.75 | 1084 | 1058 | 221.4 |
| A | 0 | 226 | 9849 | 39.7 | 1084 | 1058 | 221.4 |
| B | 10 | 245 | 83704 | 379.37 | 1121 | 1093 | 217.8 |
| B | 12 | 111 | 24984 | 109.71 | 1121 | 1093 | 217.8 |
| B | 8 | 234 | 21569 | 94.03 | 1121 | 1093 | 217.8 |
| C | 10 | 22 | 9990 | 35.5 | 1080 | 1086 | 250.8 |
| C | 13 | 61 | 8060 | 27.8 | 1080 | 1086 | 250.8 |
| C | 14 | 67 | 6245 | 20.57 | 1080 | 1086 | 250.8 |
| D | 1 | 52 | 123332 | 451.13 | 1057 | 1029 | 271.1 |
| D | 12 | 227 | 113193 | 413.73 | 1057 | 1029 | 271.1 |
| D | 12 | 233 | 77274 | 281.24 | 1057 | 1029 | 271.1 |
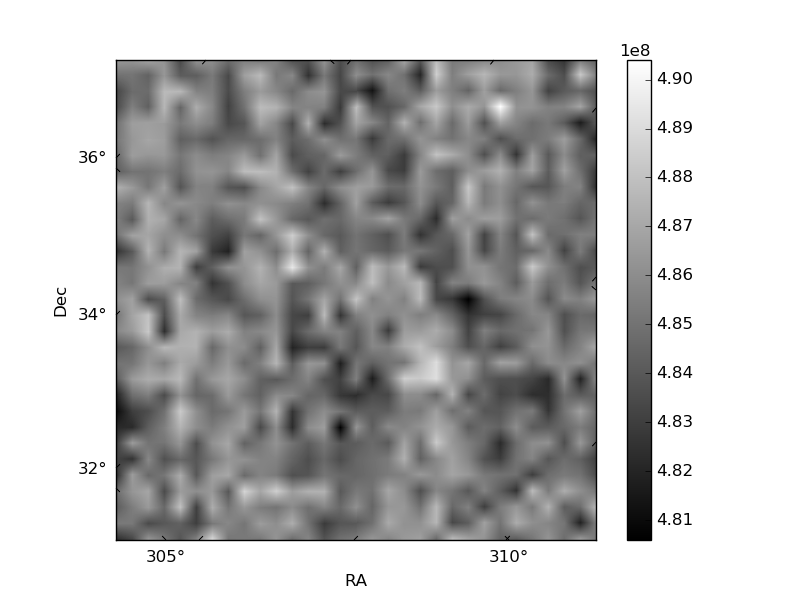
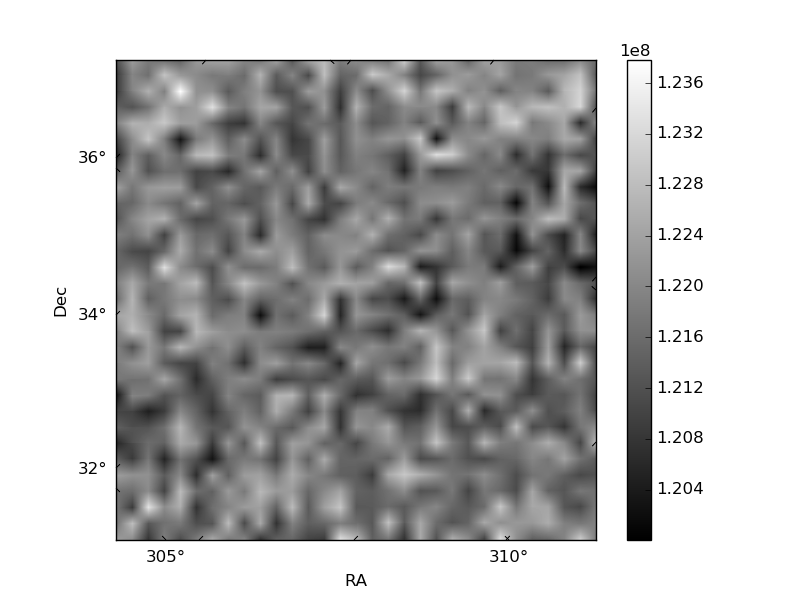
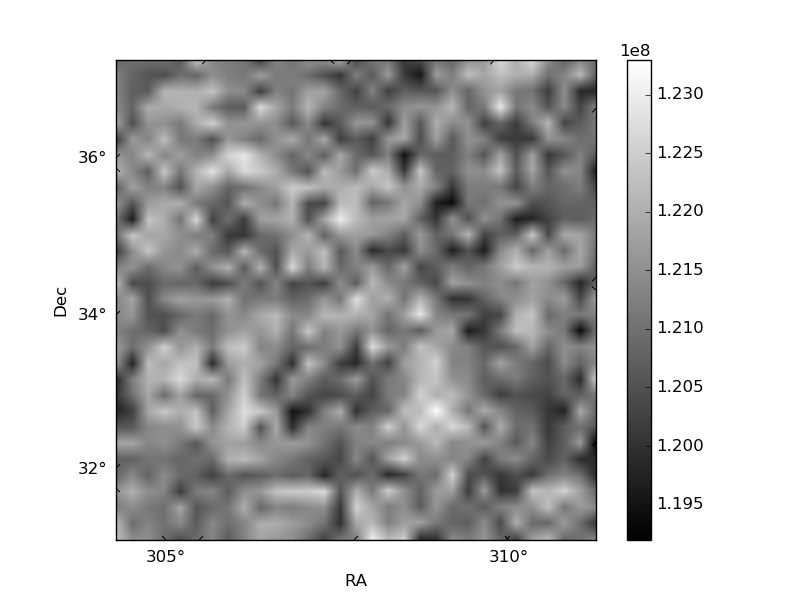
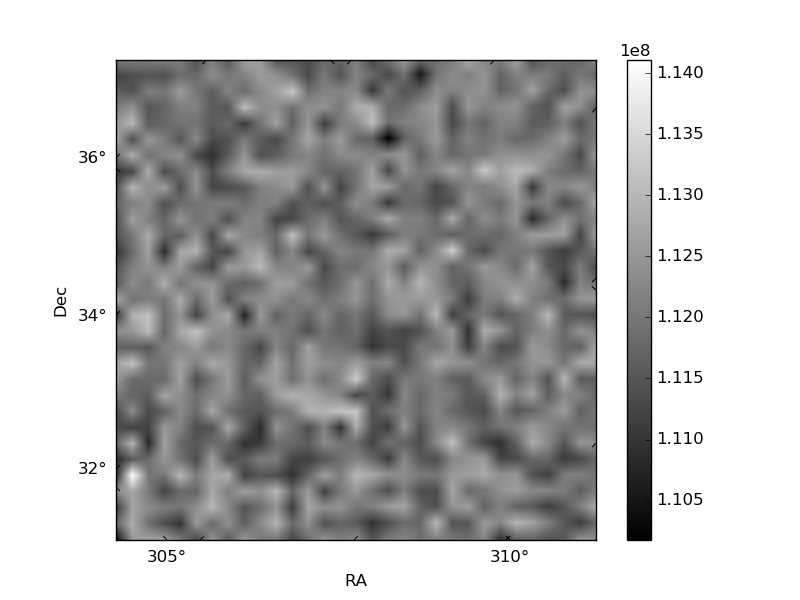
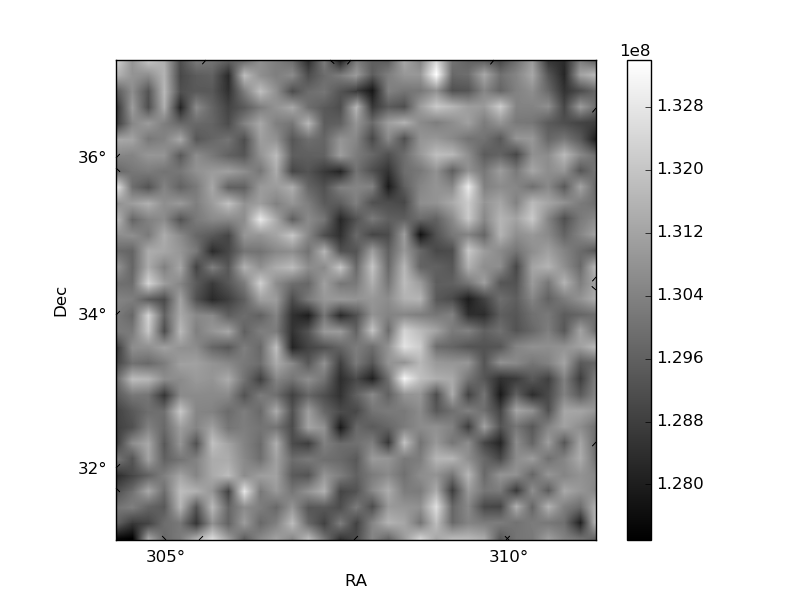
Histogram calculated using DETX and DETY for each event in the final _common_clean file
| Quadrant A | 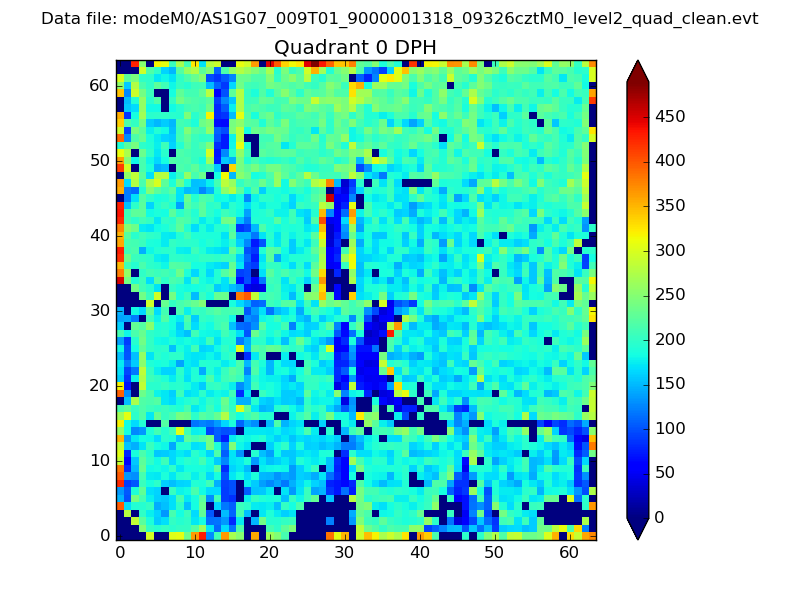 |
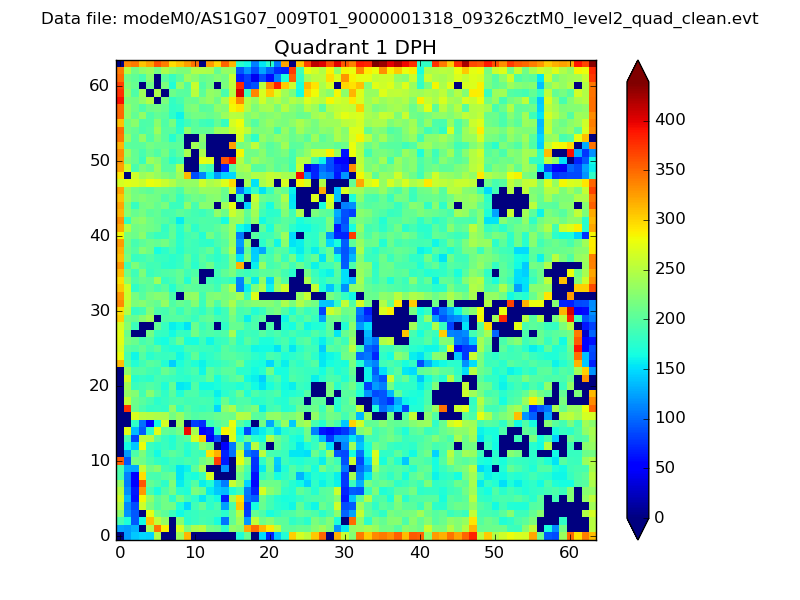 |
Quadrant B |
|---|---|---|---|
| Quadrant D | 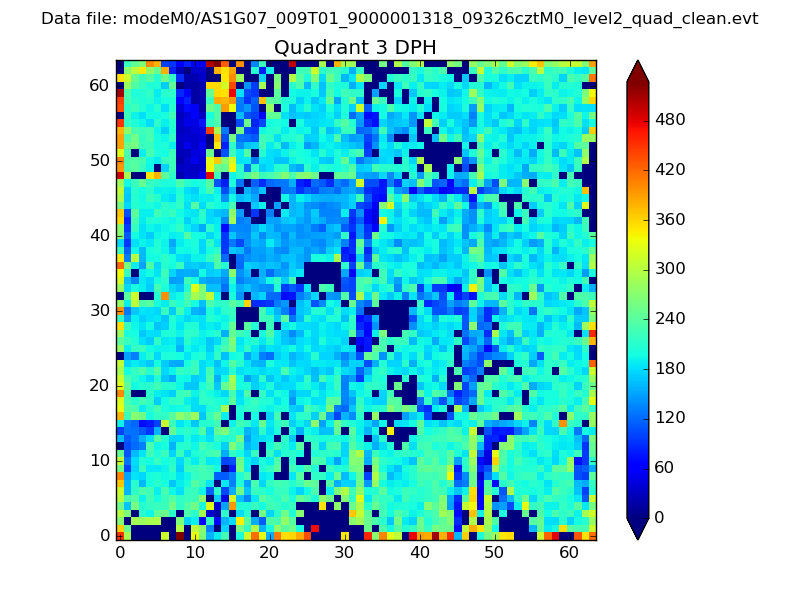 |
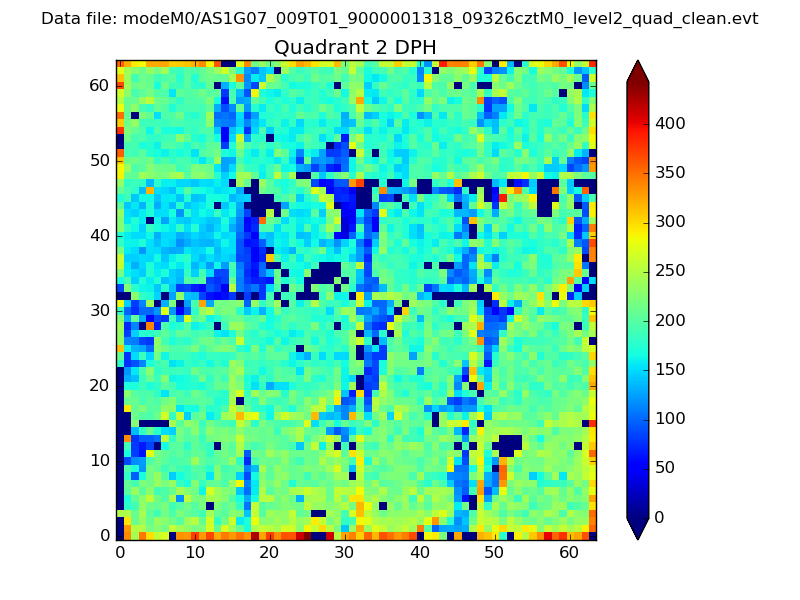 |
Quadrant C |
| Plot type | Count rate plots | Images |
|---|---|---|
| Comparison with Poisson distribution Blue bars denote a histogram of data divided into 1 sec bins. Red curve is a Poisson curve with rate = median count rate of data. |
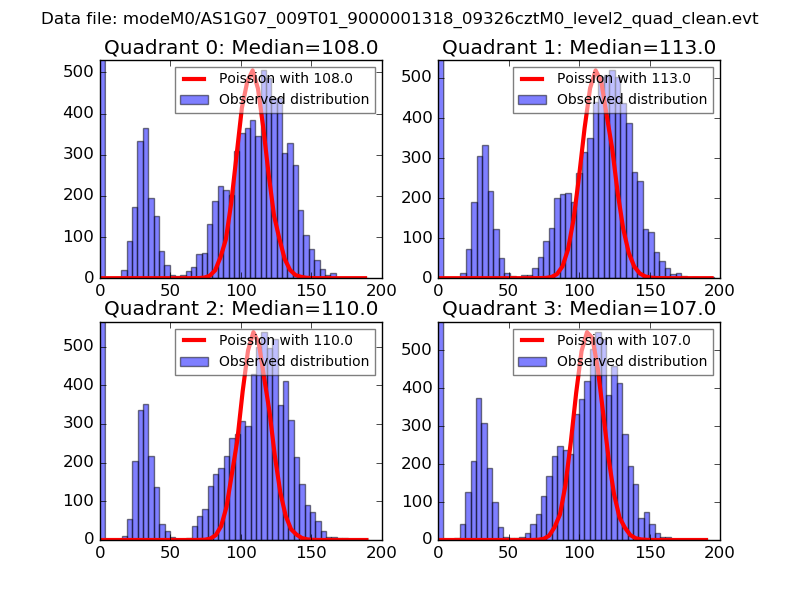 |
 |
| Quadrant-wise count rates Data is divided into 100 sec bins |
 |
|
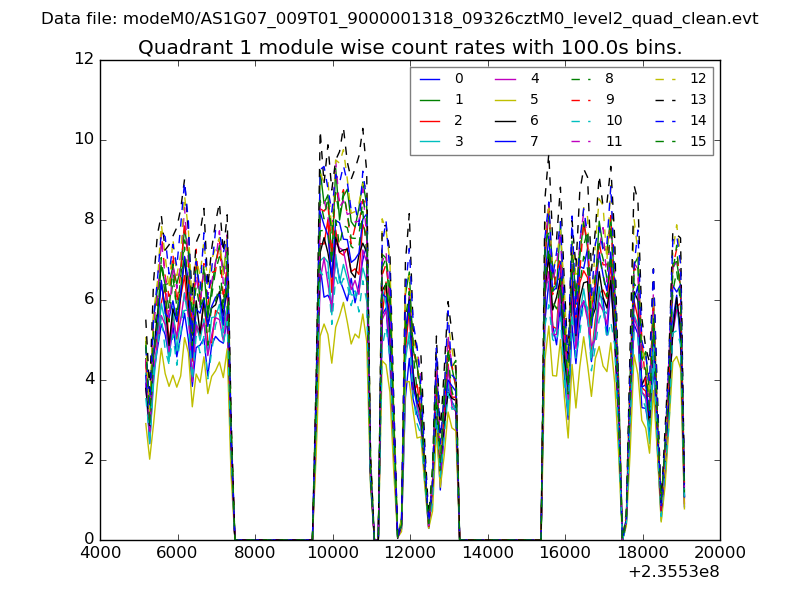
| Module-wise count rates for Quadrant A Data is divided into 100 sec bins |
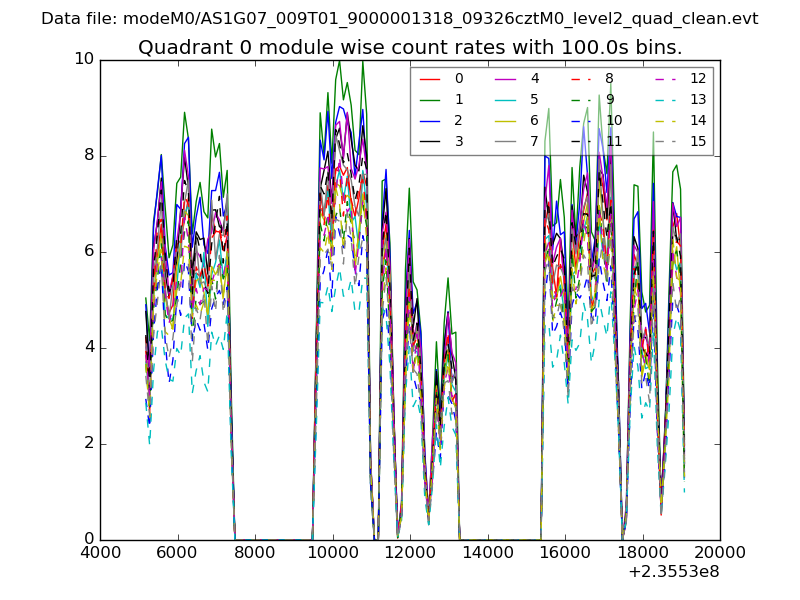 |
 |
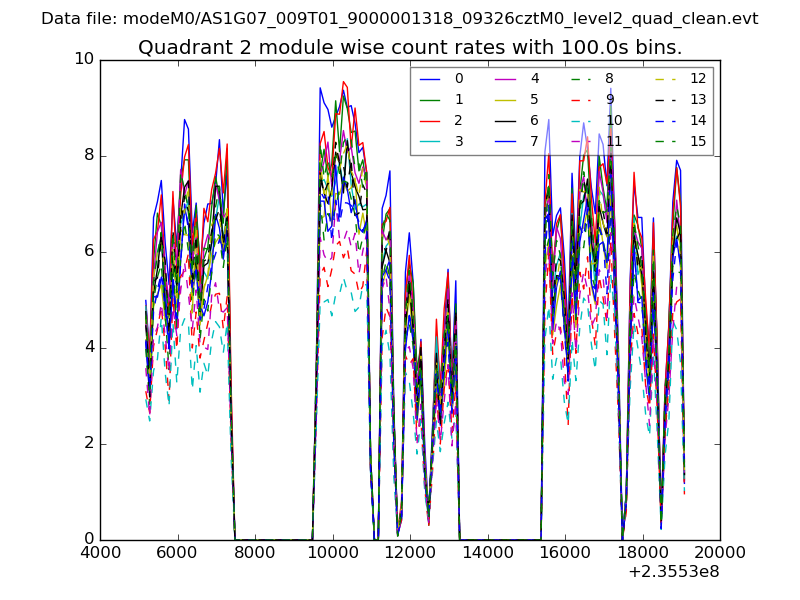
| Module-wise count rates for Quadrant B Data is divided into 100 sec bins |
 |
 |
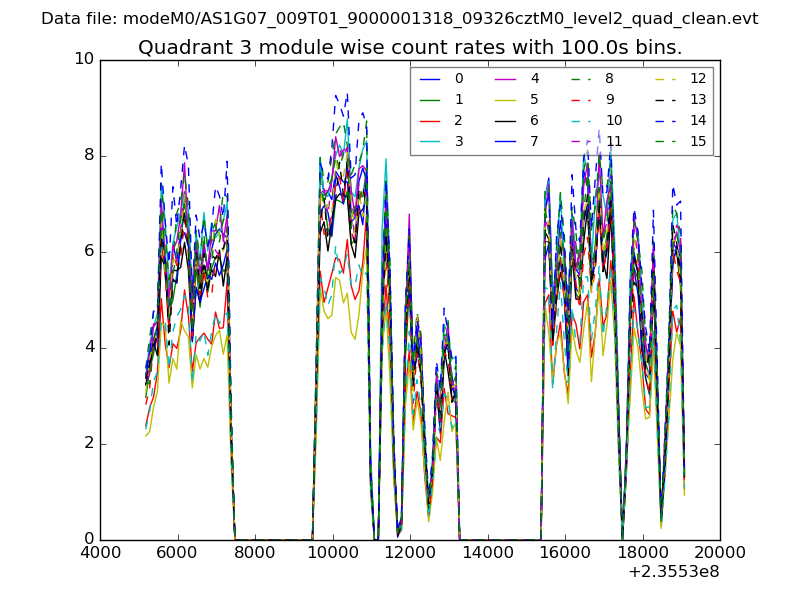
| Module-wise count rates for Quadrant C Data is divided into 100 sec bins |
 |
 |
| Module-wise count rates for Quadrant D Data is divided into 100 sec bins |
 |
 |
| Parameter | Plot |
|---|---|
| CZT HV Monitor | 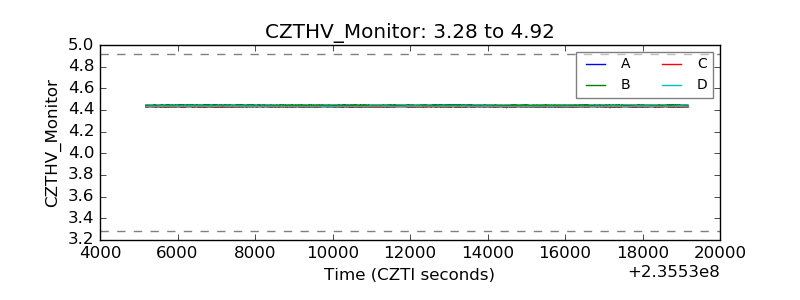 |
| D_VDD | 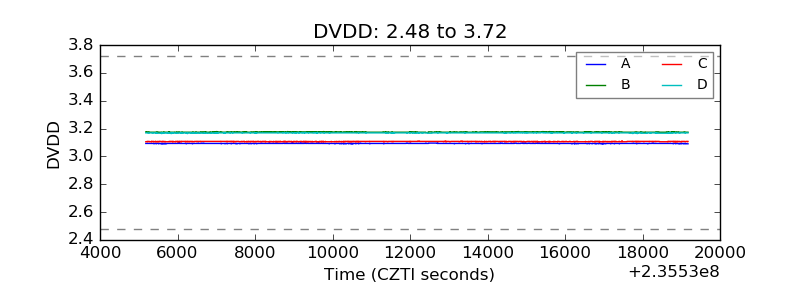 |
| Temperature 1 | 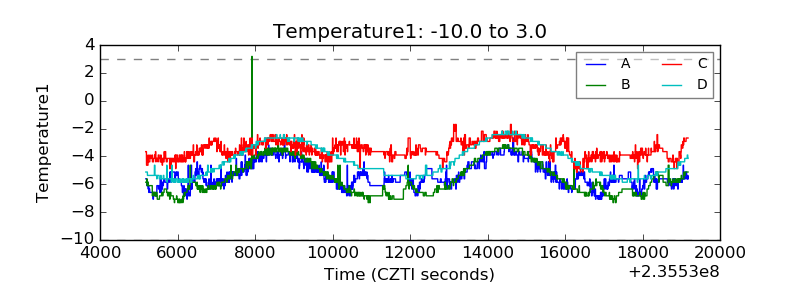 |
| Veto HV Monitor | 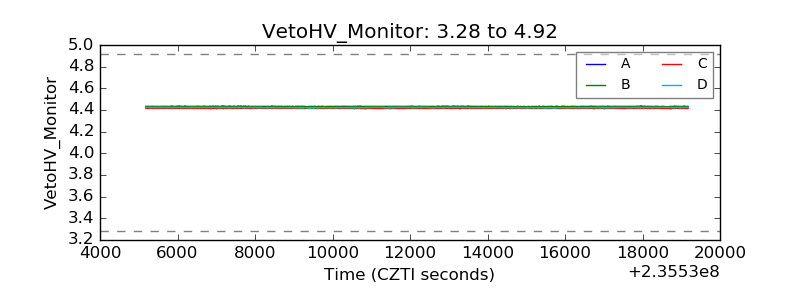 |
| Veto LLD | 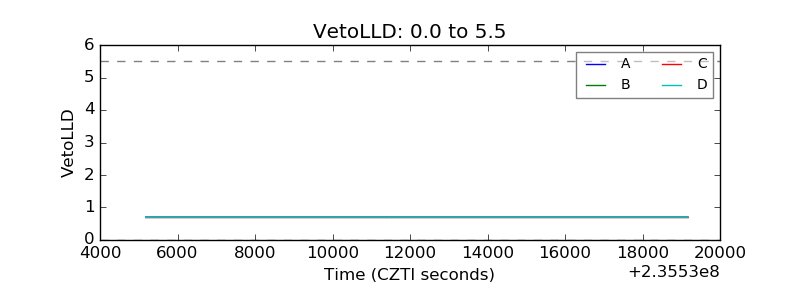 |
| Alpha Counter | 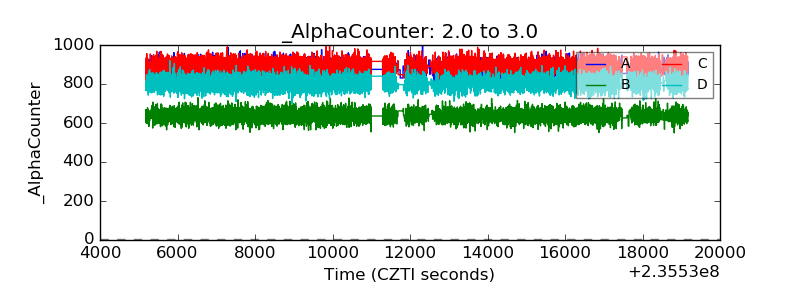 |
| _CPM_Rate | 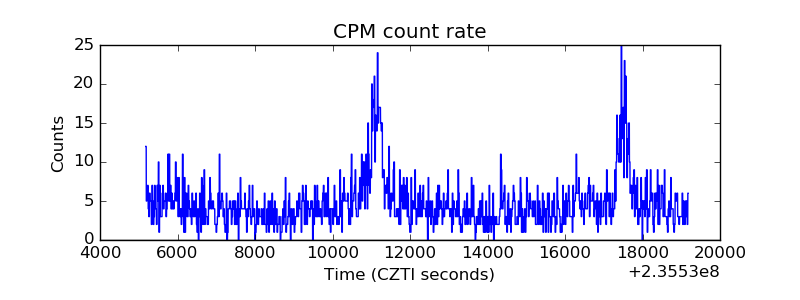 |
| CZT Counter | 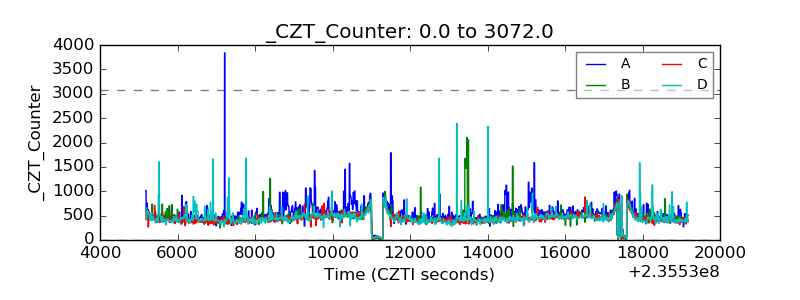 |
| +2.5 Volts monitor |  |
| +5 Volts monitor |  |
| _ROLL_ROT | 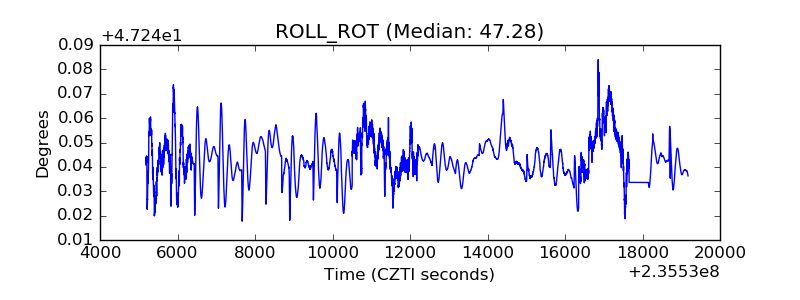 |
| _Roll_DEC | 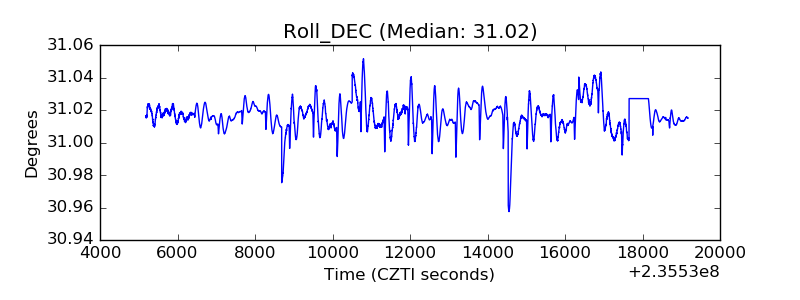 |
| _Roll_RA | 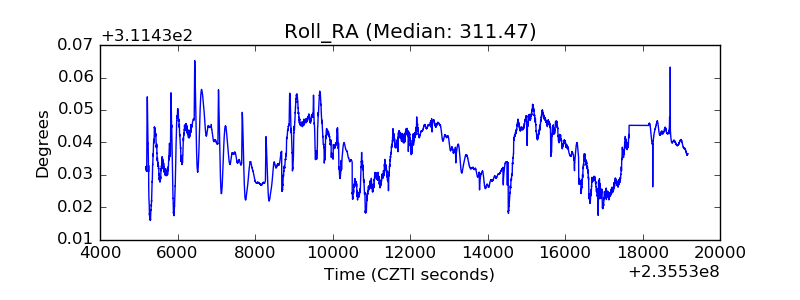 |
| Veto Counter | 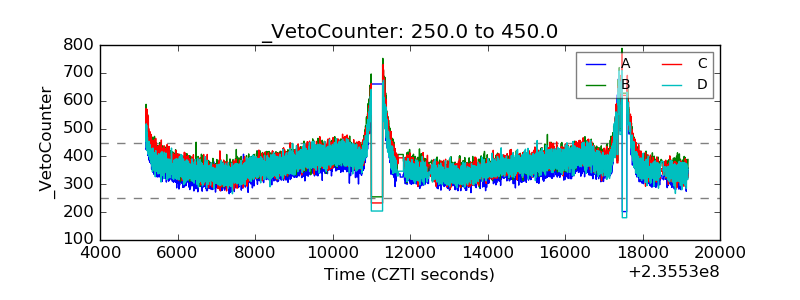 |