| Param | Original file | Final file |
|---|---|---|
| Filename | modeM0/AS1G07_009T01_9000001318_09327cztM0_level2.evt | modeM0/AS1G07_009T01_9000001318_09327cztM0_level2_quad_clean.evt |
| Size (bytes) | 255,257,280 | 40,121,280 |
| Size | 243.4 MB | 38.3 MB |
| Events in quadrant A | 2,070,564 | 233,000 |
| Events in quadrant B | 1,820,070 | 235,367 |
| Events in quadrant C | 1,758,342 | 231,366 |
| Events in quadrant D | 1,800,599 | 225,603 |
| Mode M0 | |||
|---|---|---|---|
| Quadrant | BADHDUFLAG | Total packets | Discarded packets |
| A | 0 | 8899 | 326 |
| B | 0 | 8527 | 345 |
| C | 0 | 8499 | 301 |
| D | 0 | 8630 | 299 |
| Mode SS | |||
|---|---|---|---|
| Quadrant | BADHDUFLAG | Total packets | Discarded packets |
| A | 0 | 86 | 2 |
| B | 0 | 86 | 2 |
| C | 0 | 86 | 2 |
| D | 0 | 86 | 0 |
| Quadrant | Total seconds | Saturated seconds | Saturation percentage |
|---|---|---|---|
| A | 4092 | 5 | 0.122190% |
| B | 4075 | 2 | 0.049080% |
| C | 4095 | 1 | 0.024420% |
| D | 4101 | 7 | 0.170690% |
Noise dominated data is calculated using 1-second bins in cleaned event files. If a bin has >2000 counts, and if more than 50% of those come from <1% of pixels, then it is considered to be noise-dominated and hence unusable.
| Quadrant | # 1 sec bins | Bins with >0 counts | Bins with >2000 counts | High rate bins dominated by noise | Noise dominated (total time) | Noise dominated (detector-on time) | Marked lightcurve |
|---|---|---|---|---|---|---|---|
| A | 4246 | 4235 | 0 | 0 | 0.00% | 0.00% | 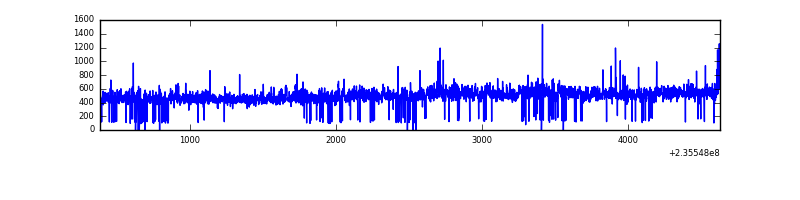 |
| B | 4246 | 4228 | 0 | 0 | 0.00% | 0.00% | 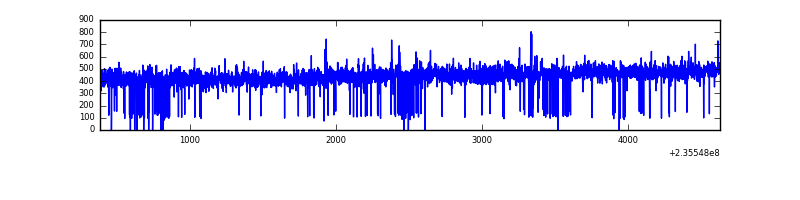 |
| C | 4246 | 4231 | 0 | 0 | 0.00% | 0.00% | 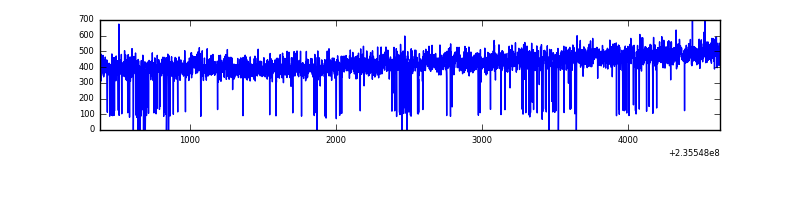 |
| D | 4245 | 4234 | 3 | 3 | 0.07% | 0.07% | 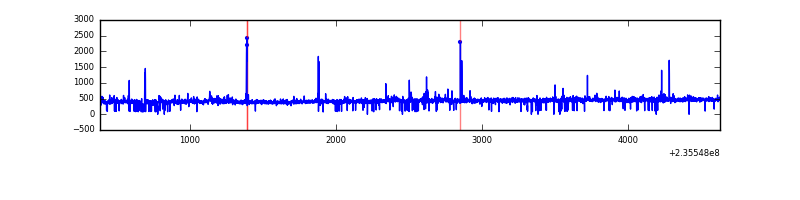 |
Top three noisy pixels from each quadrant. If the there are fewer than three noisy pixels in the level2.evt file, extra rows are filled as -1
| Pixel properties | Quadrant properties | ||||||
|---|---|---|---|---|---|---|---|
| Quadrant | DetID | PixID | Counts | Sigma | Mean | Median | Sigma |
| A | 8 | 5 | 256144 | 2648.95 | 464 | 455 | 96.5 |
| A | 1 | 162 | 18370 | 185.6 | 464 | 455 | 96.5 |
| A | 0 | 226 | 4306 | 39.9 | 464 | 455 | 96.5 |
| B | 4 | 173 | 11838 | 124.48 | 463 | 451 | 91.5 |
| B | 12 | 111 | 10080 | 105.26 | 463 | 451 | 91.5 |
| B | 11 | 111 | 8399 | 86.89 | 463 | 451 | 91.5 |
| C | 13 | 61 | 3447 | 28.2 | 450 | 452 | 106.2 |
| C | 8 | 222 | 3355 | 27.33 | 450 | 452 | 106.2 |
| C | 3 | 202 | 1143 | 6.51 | 450 | 452 | 106.2 |
| D | 12 | 233 | 30949 | 267.47 | 449 | 437 | 114.1 |
| D | 1 | 52 | 18207 | 155.77 | 449 | 437 | 114.1 |
| D | 2 | 234 | 16359 | 139.57 | 449 | 437 | 114.1 |
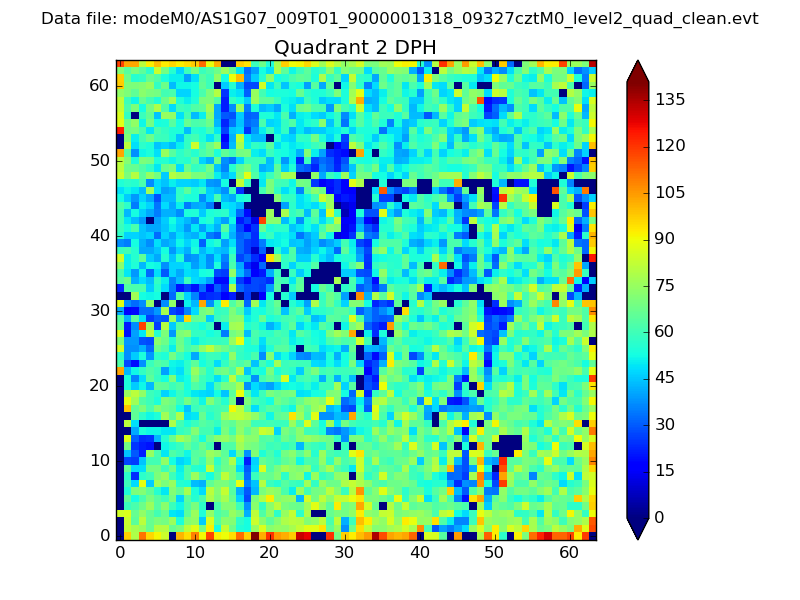
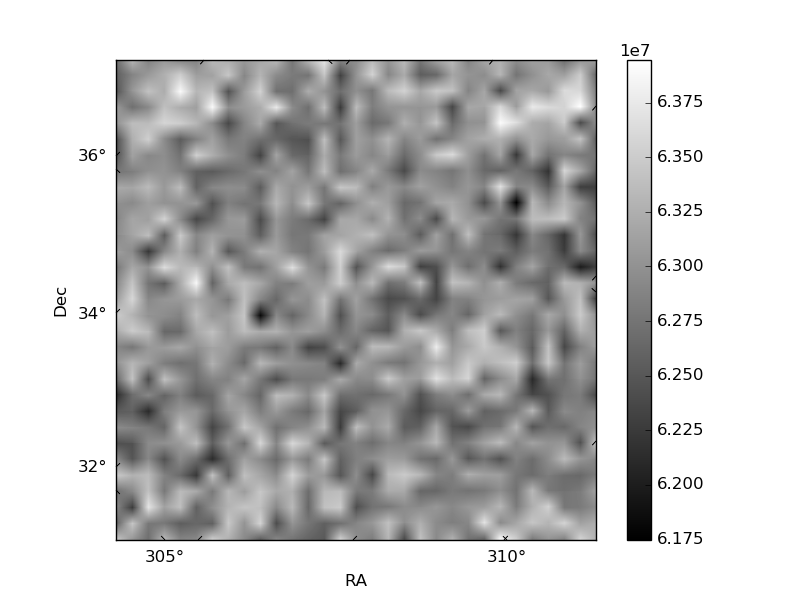
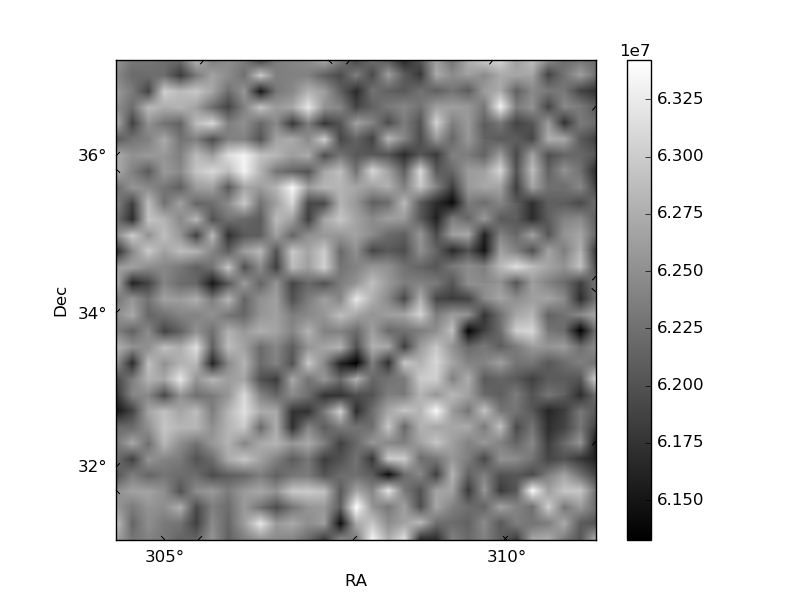
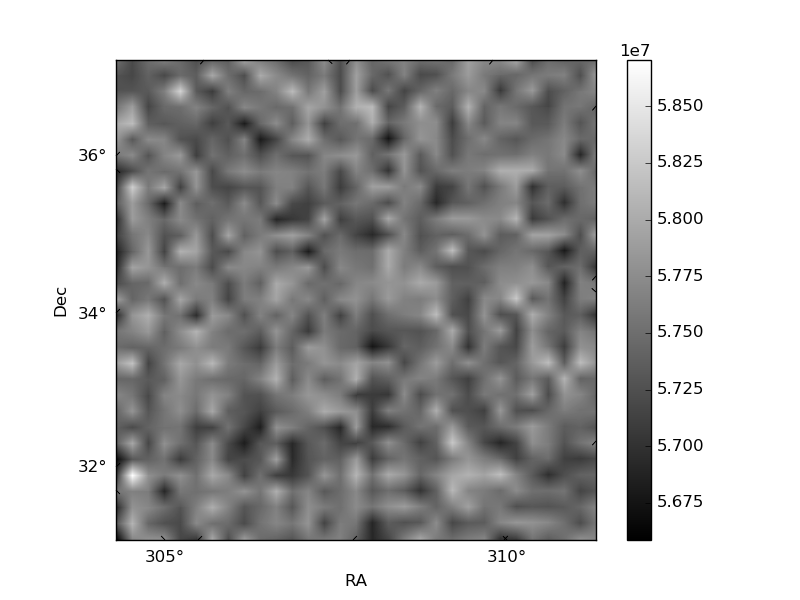
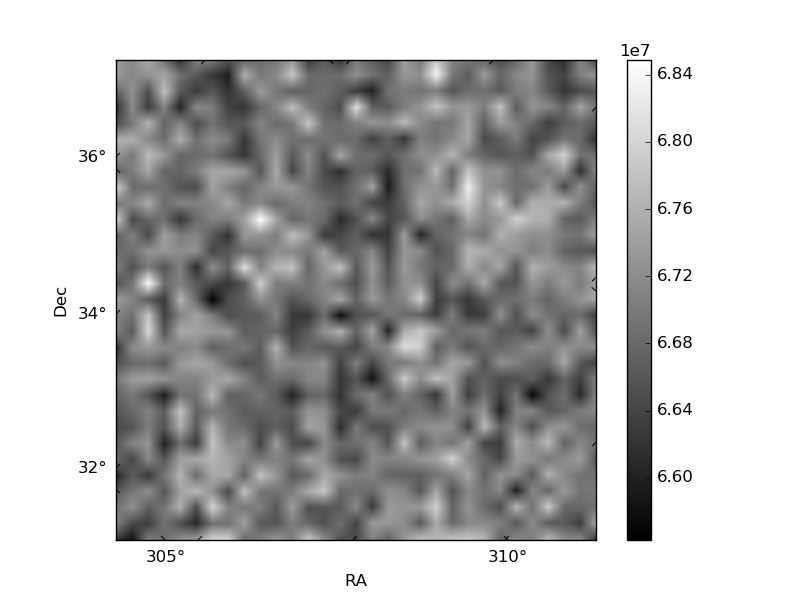
Histogram calculated using DETX and DETY for each event in the final _common_clean file
| Quadrant A | 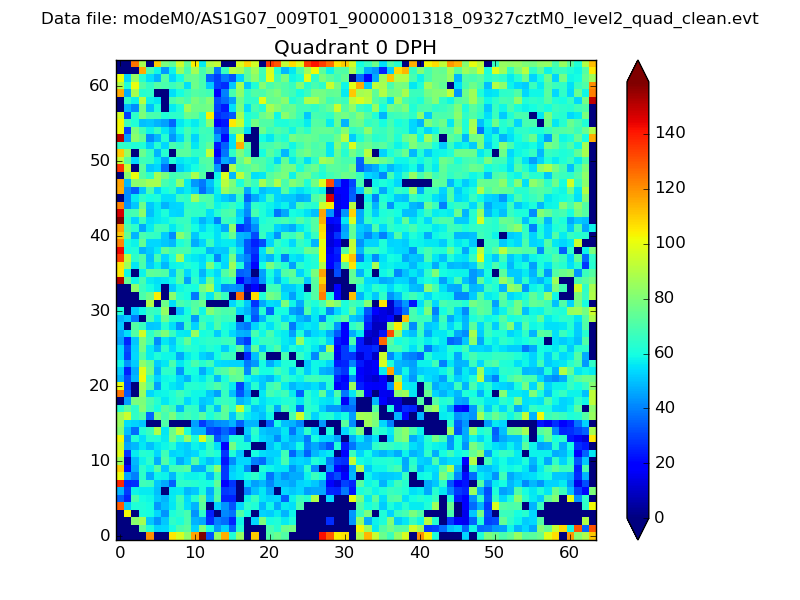 |
 |
Quadrant B |
|---|---|---|---|
| Quadrant D |  |
 |
Quadrant C |
| Plot type | Count rate plots | Images |
|---|---|---|
| Comparison with Poisson distribution Blue bars denote a histogram of data divided into 1 sec bins. Red curve is a Poisson curve with rate = median count rate of data. |
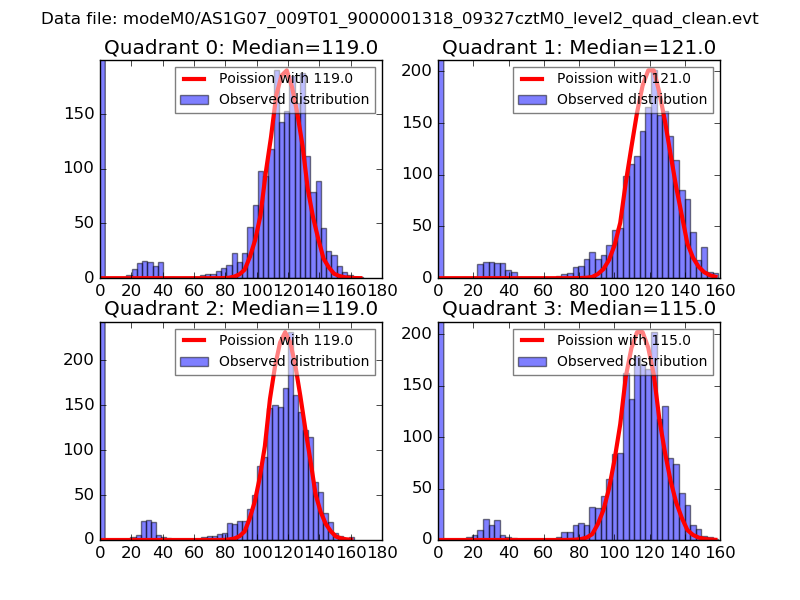 |
 |
| Quadrant-wise count rates Data is divided into 100 sec bins |
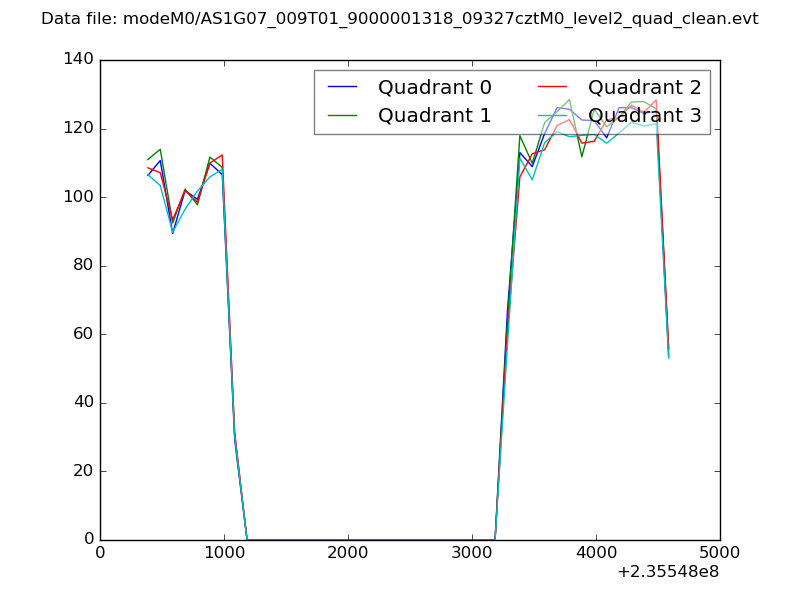 |
|
| Module-wise count rates for Quadrant A Data is divided into 100 sec bins |
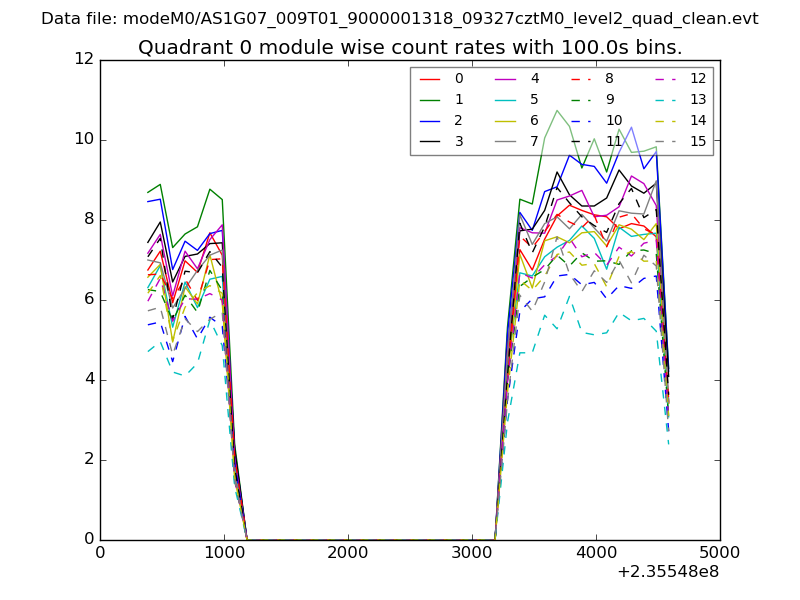 |
 |
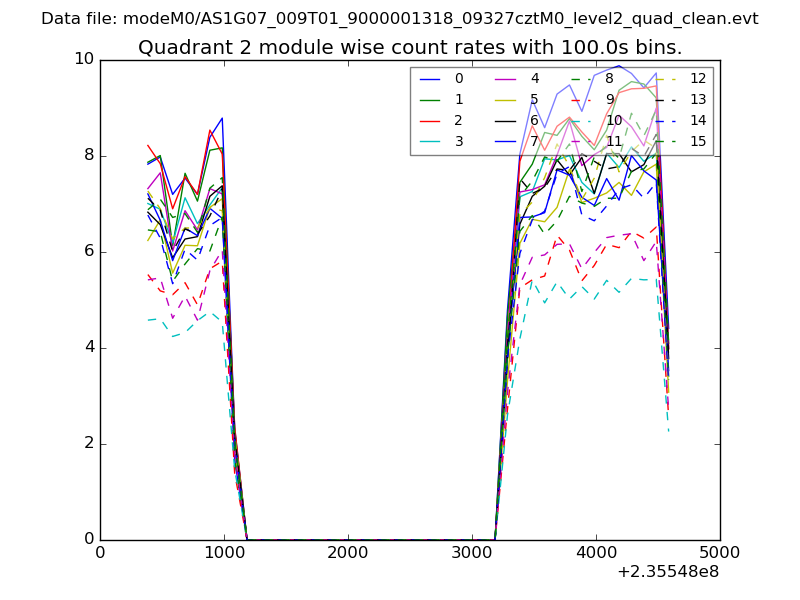
| Module-wise count rates for Quadrant B Data is divided into 100 sec bins |
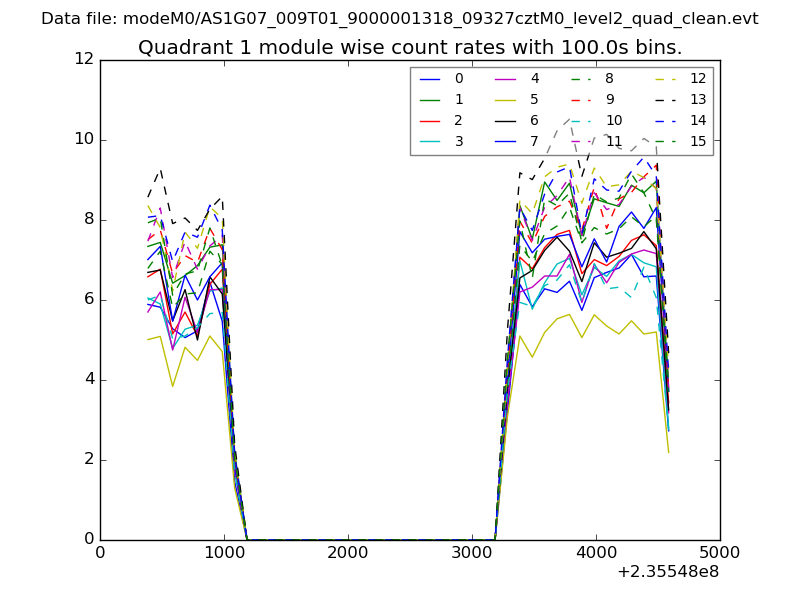 |
 |
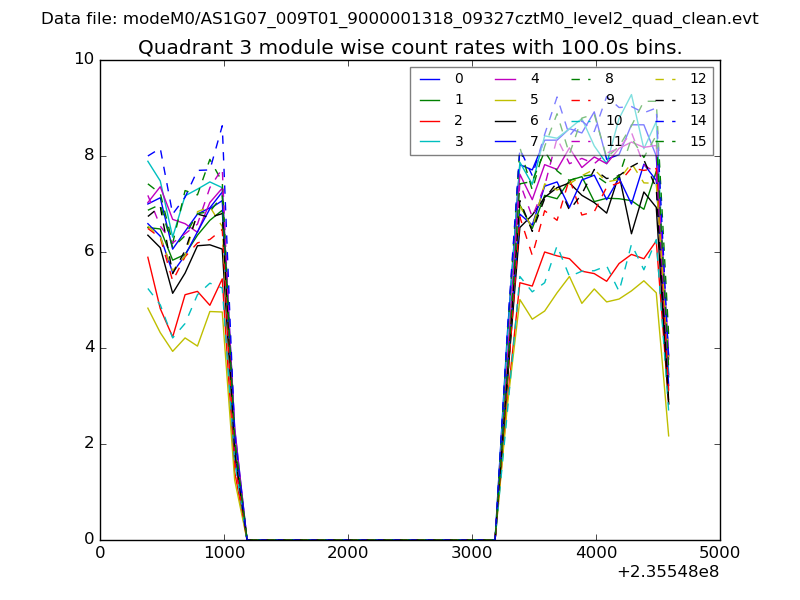
| Module-wise count rates for Quadrant C Data is divided into 100 sec bins |
 |
 |
| Module-wise count rates for Quadrant D Data is divided into 100 sec bins |
 |
 |
| Parameter | Plot |
|---|---|
| CZT HV Monitor |  |
| D_VDD | 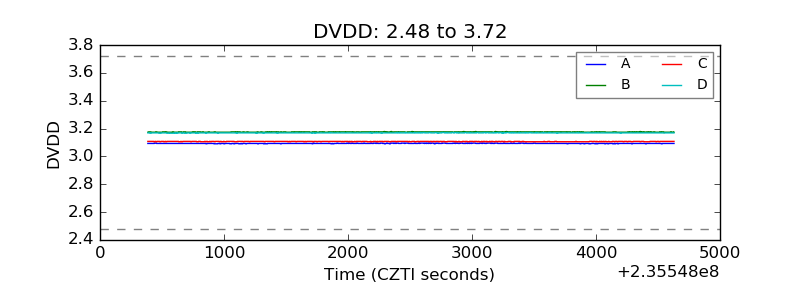 |
| Temperature 1 | 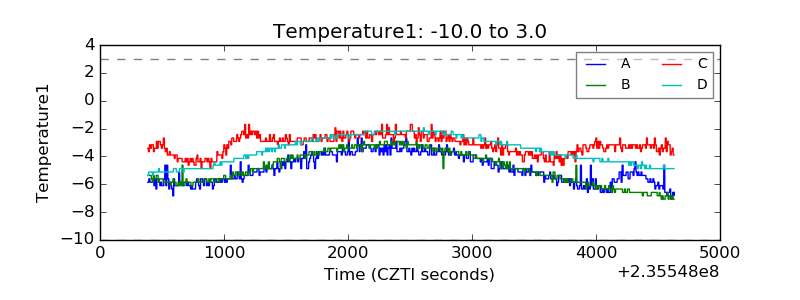 |
| Veto HV Monitor | 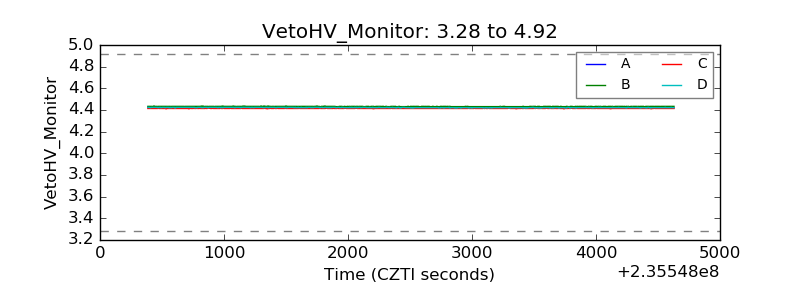 |
| Veto LLD | 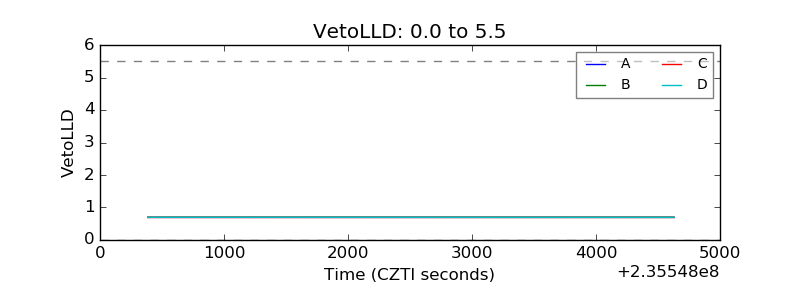 |
| Alpha Counter | 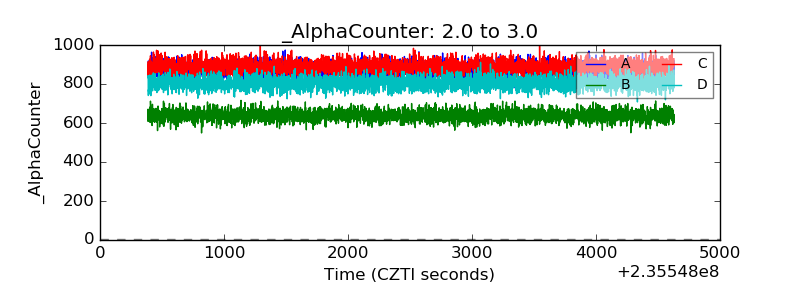 |
| _CPM_Rate | 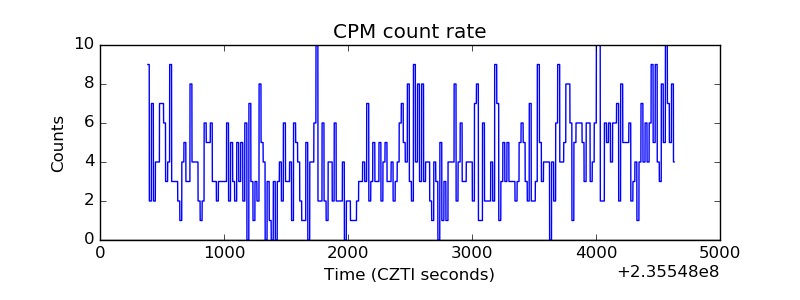 |
| CZT Counter | 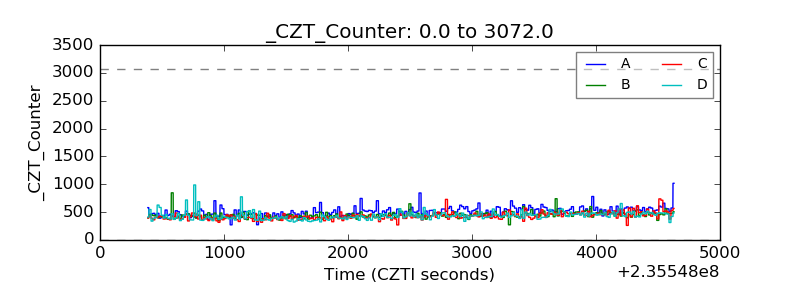 |
| +2.5 Volts monitor |  |
| +5 Volts monitor |  |
| _ROLL_ROT | 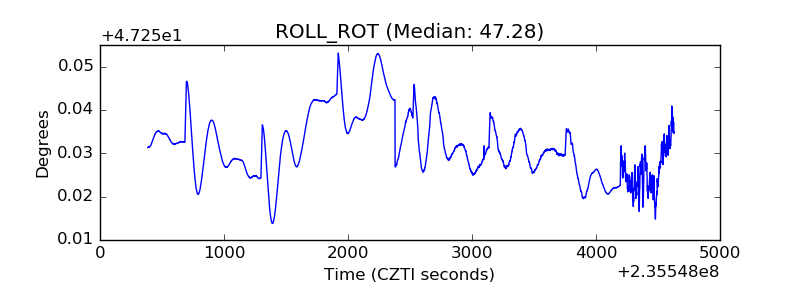 |
| _Roll_DEC | 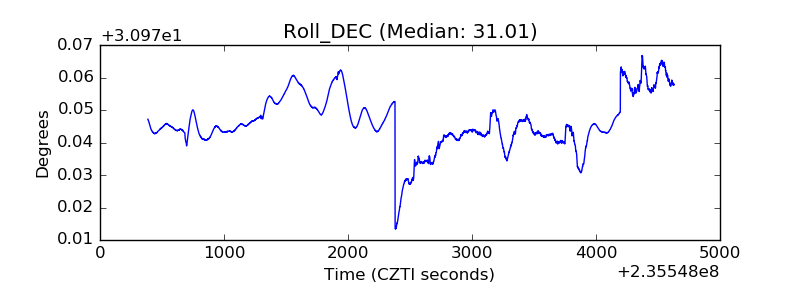 |
| _Roll_RA | 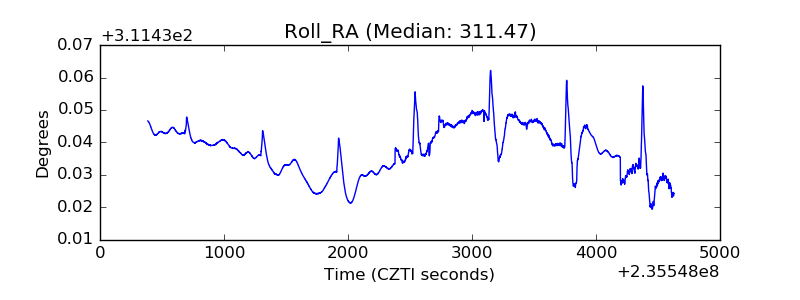 |
| Veto Counter | 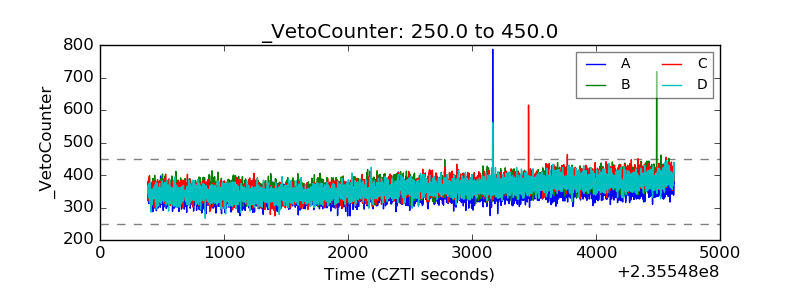 |