| Param | Original file | Final file |
|---|---|---|
| Filename | modeM0/AS1G07_009T01_9000001318_09329cztM0_level2.evt | modeM0/AS1G07_009T01_9000001318_09329cztM0_level2_quad_clean.evt |
| Size (bytes) | 904,841,280 | 155,220,480 |
| Size | 862.9 MB | 148.0 MB |
| Events in quadrant A | 7,243,983 | 946,445 |
| Events in quadrant B | 6,255,036 | 971,347 |
| Events in quadrant C | 6,009,393 | 947,799 |
| Events in quadrant D | 7,001,639 | 924,692 |
| Mode M9 | |||
|---|---|---|---|
| Quadrant | BADHDUFLAG | Total packets | Discarded packets |
| A | 0 | 16 | 1 |
| B | 0 | 16 | 0 |
| C | 0 | 16 | 2 |
| D | 0 | 16 | 1 |
| Mode M0 | |||
|---|---|---|---|
| Quadrant | BADHDUFLAG | Total packets | Discarded packets |
| A | 0 | 32117 | 2810 |
| B | 0 | 29572 | 2416 |
| C | 0 | 29417 | 2433 |
| D | 0 | 32902 | 3046 |
| Mode SS | |||
|---|---|---|---|
| Quadrant | BADHDUFLAG | Total packets | Discarded packets |
| A | 0 | 294 | 22 |
| B | 0 | 294 | 22 |
| C | 0 | 293 | 20 |
| D | 0 | 294 | 30 |
| Quadrant | Total seconds | Saturated seconds | Saturation percentage |
|---|---|---|---|
| A | 13124 | 341 | 2.598293% |
| B | 13193 | 298 | 2.258774% |
| C | 13186 | 207 | 1.569847% |
| D | 13143 | 377 | 2.868447% |
Noise dominated data is calculated using 1-second bins in cleaned event files. If a bin has >2000 counts, and if more than 50% of those come from <1% of pixels, then it is considered to be noise-dominated and hence unusable.
| Quadrant | # 1 sec bins | Bins with >0 counts | Bins with >2000 counts | High rate bins dominated by noise | Noise dominated (total time) | Noise dominated (detector-on time) | Marked lightcurve |
|---|---|---|---|---|---|---|---|
| A | 15950 | 13751 | 10 | 10 | 0.06% | 0.07% | 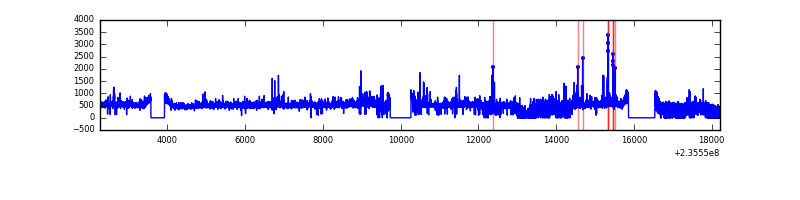 |
| B | 15946 | 13823 | 2 | 2 | 0.01% | 0.01% | 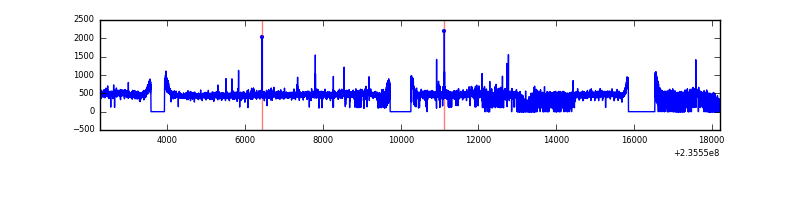 |
| C | 15945 | 13805 | 0 | 0 | 0.00% | 0.00% | 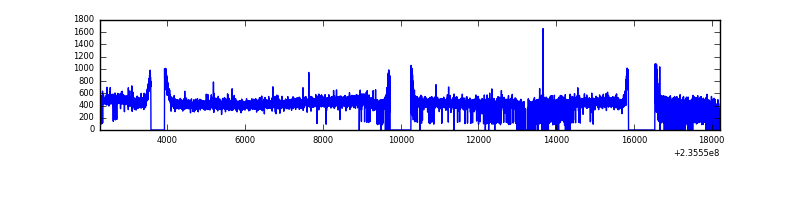 |
| D | 15943 | 13777 | 124 | 124 | 0.78% | 0.90% | 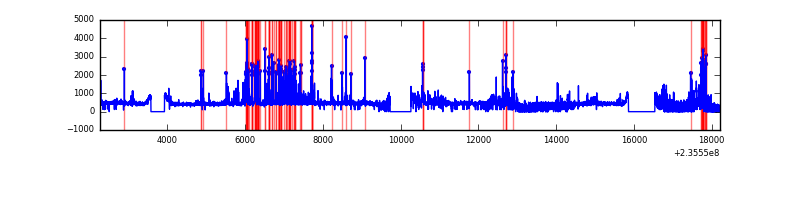 |
Top three noisy pixels from each quadrant. If the there are fewer than three noisy pixels in the level2.evt file, extra rows are filled as -1
| Pixel properties | Quadrant properties | ||||||
|---|---|---|---|---|---|---|---|
| Quadrant | DetID | PixID | Counts | Sigma | Mean | Median | Sigma |
| A | 8 | 5 | 1084643 | 3387.26 | 1563 | 1526 | 319.8 |
| A | 1 | 162 | 71359 | 218.39 | 1563 | 1526 | 319.8 |
| A | 13 | 248 | 27281 | 80.54 | 1563 | 1526 | 319.8 |
| B | 0 | 219 | 41992 | 132.54 | 1578 | 1536 | 305.2 |
| B | 12 | 111 | 35468 | 111.17 | 1578 | 1536 | 305.2 |
| B | 10 | 245 | 31395 | 97.83 | 1578 | 1536 | 305.2 |
| C | 13 | 61 | 11606 | 28.14 | 1532 | 1538 | 357.7 |
| C | 10 | 22 | 10331 | 24.58 | 1532 | 1538 | 357.7 |
| C | 8 | 128 | 9500 | 22.25 | 1532 | 1538 | 357.7 |
| D | 1 | 52 | 855378 | 2201.47 | 1509 | 1470 | 387.9 |
| D | 12 | 227 | 179414 | 458.76 | 1509 | 1470 | 387.9 |
| D | 12 | 233 | 97982 | 248.82 | 1509 | 1470 | 387.9 |
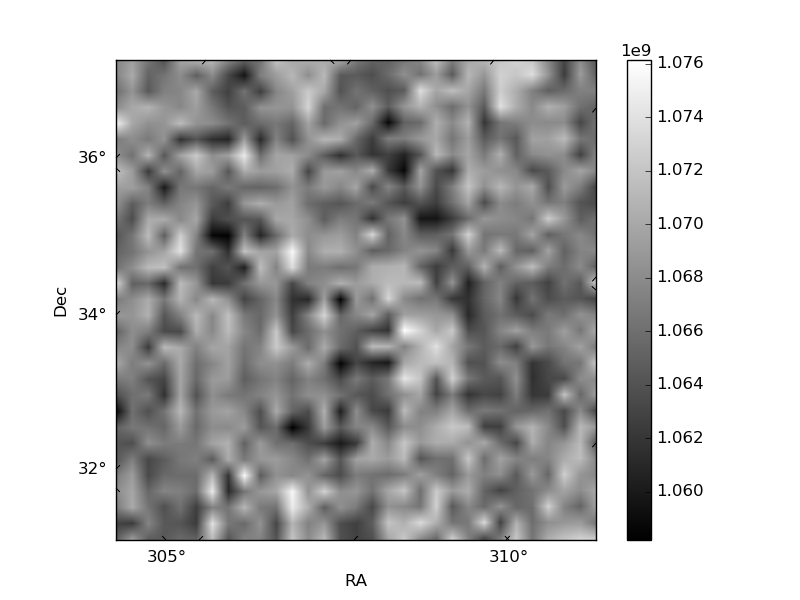
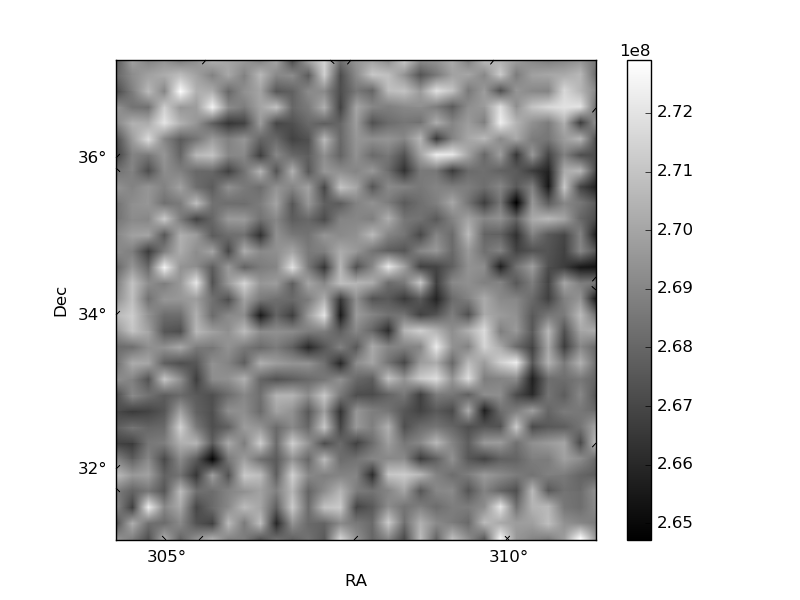
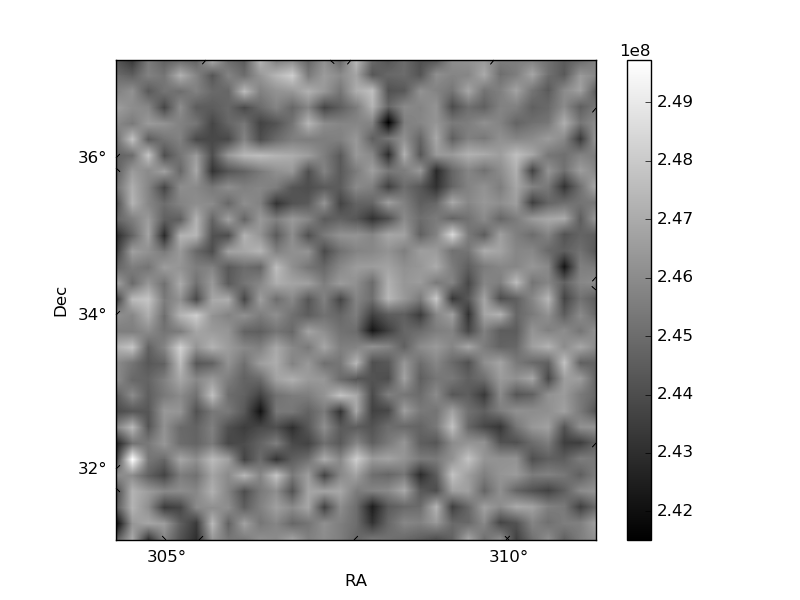
Histogram calculated using DETX and DETY for each event in the final _common_clean file
| Quadrant A | 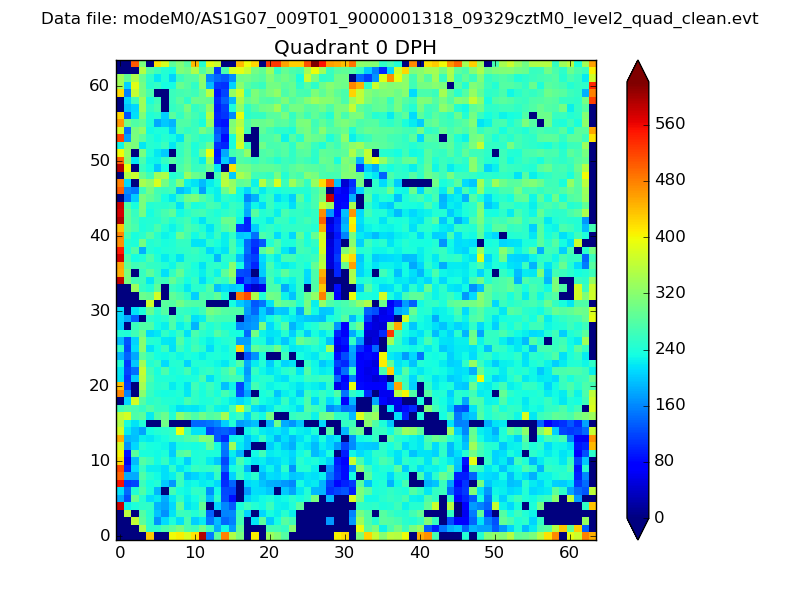 |
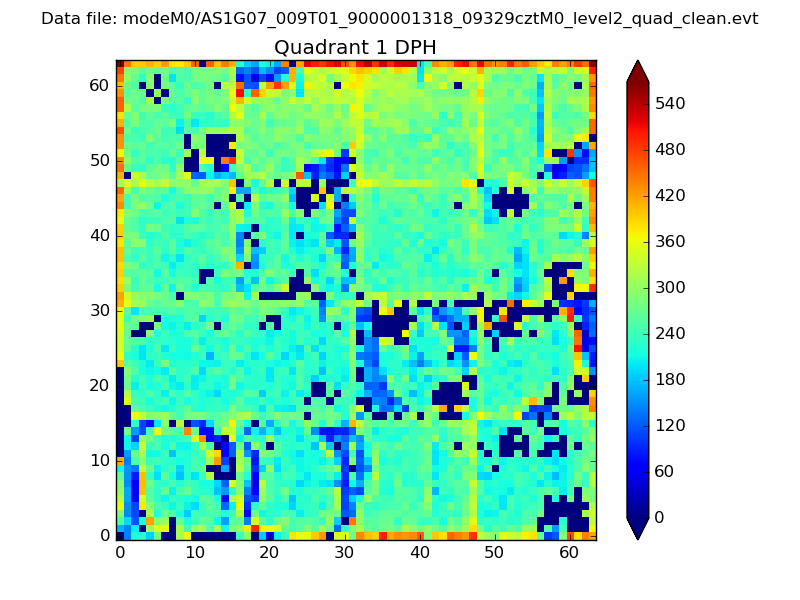 |
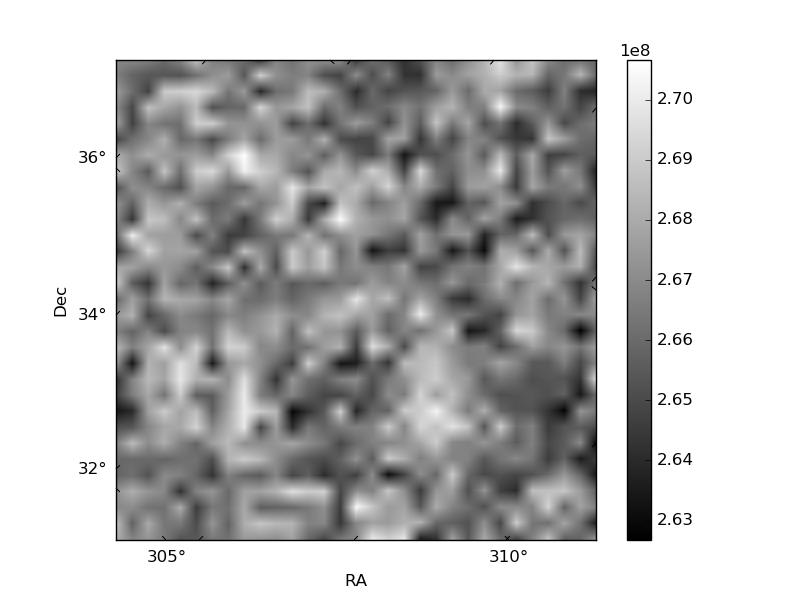
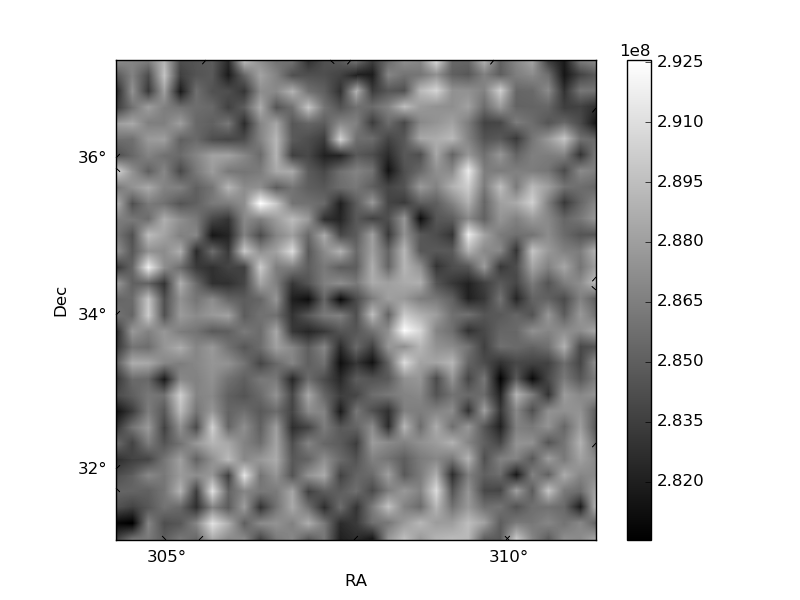
Quadrant B |
|---|---|---|---|
| Quadrant D | 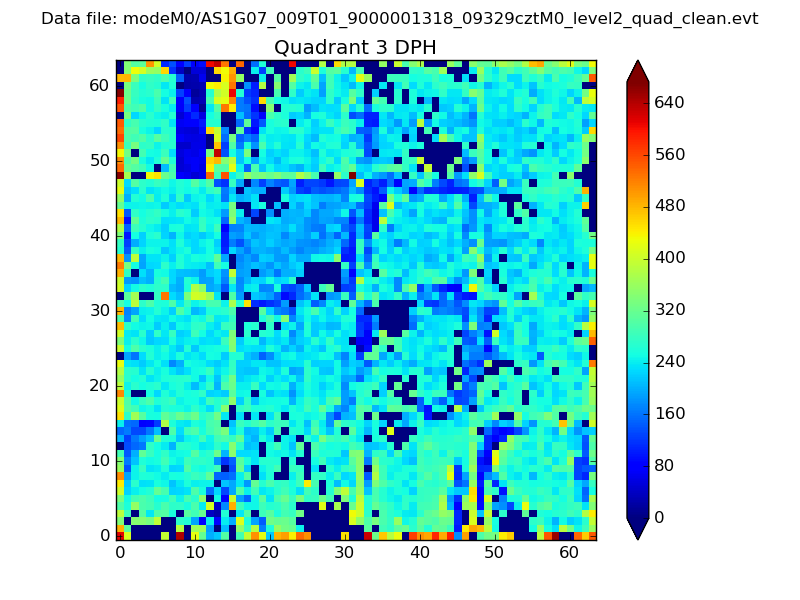 |
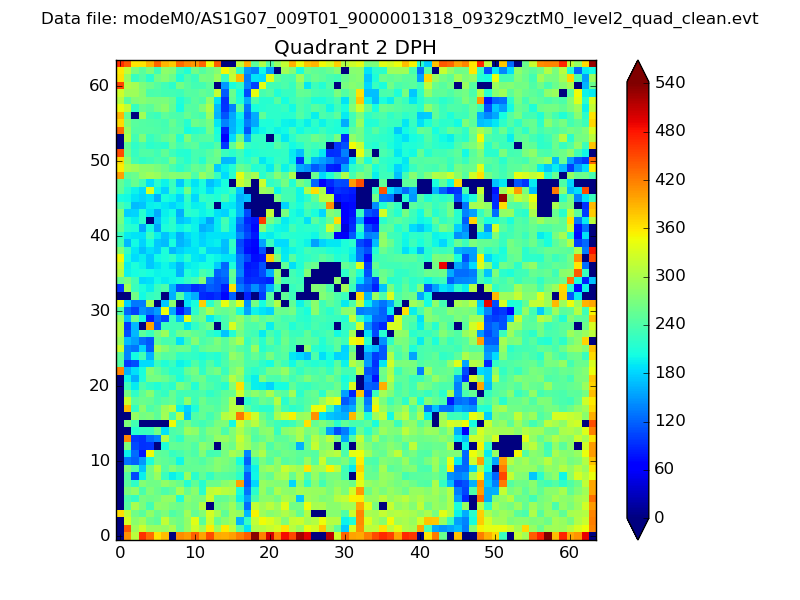 |
Quadrant C |
| Plot type | Count rate plots | Images |
|---|---|---|
| Comparison with Poisson distribution Blue bars denote a histogram of data divided into 1 sec bins. Red curve is a Poisson curve with rate = median count rate of data. |
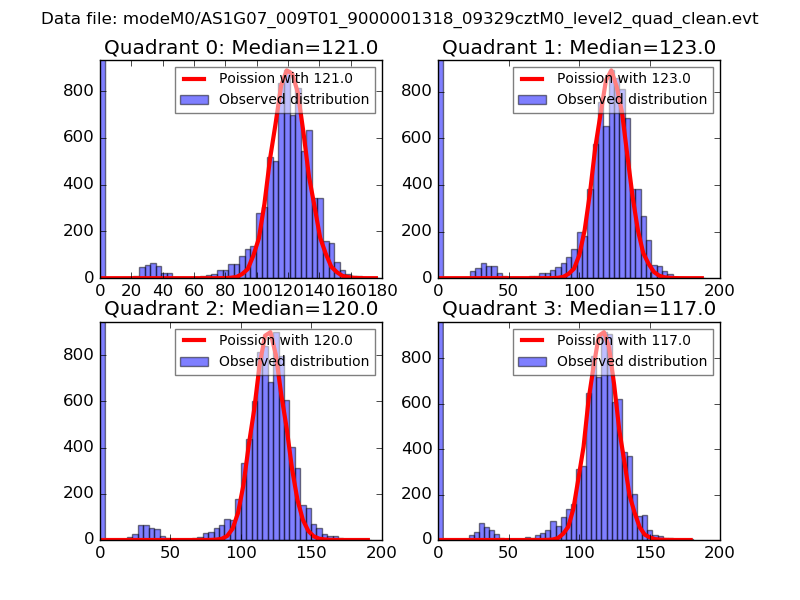 |
 |
| Quadrant-wise count rates Data is divided into 100 sec bins |
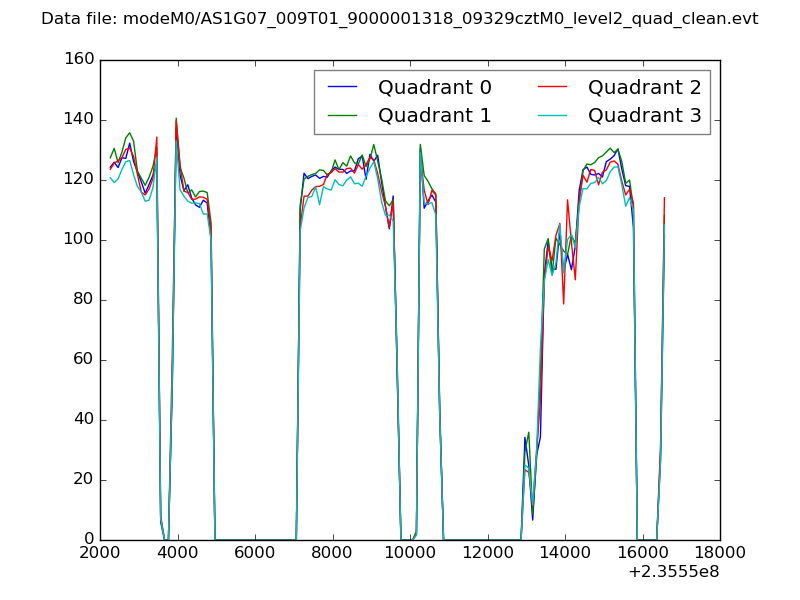 |
|
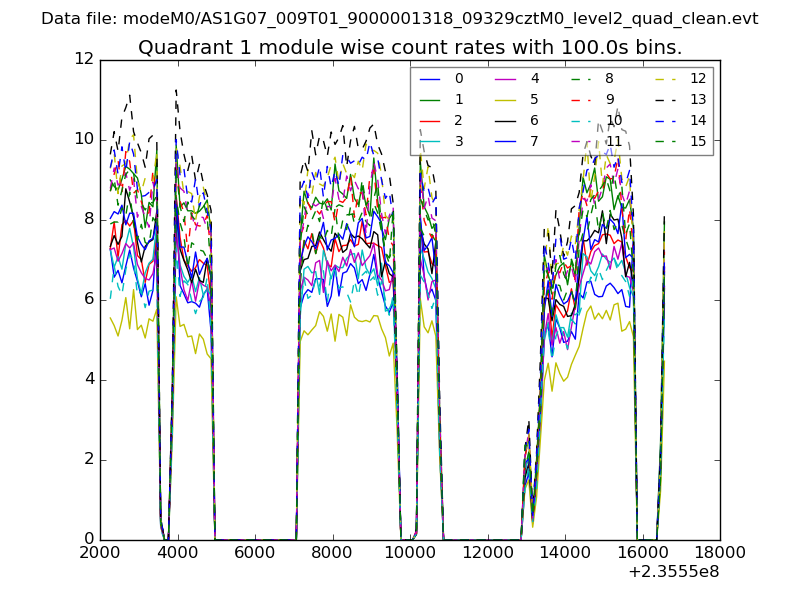
| Module-wise count rates for Quadrant A Data is divided into 100 sec bins |
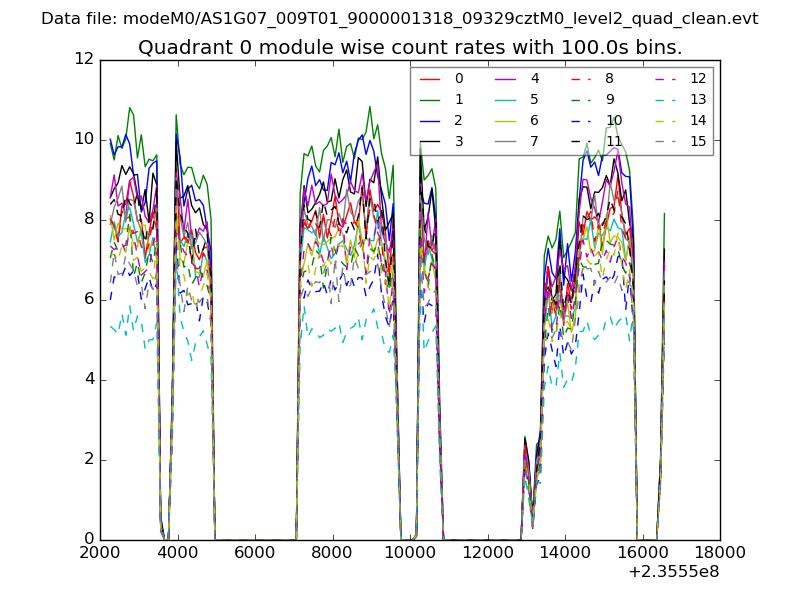 |
 |
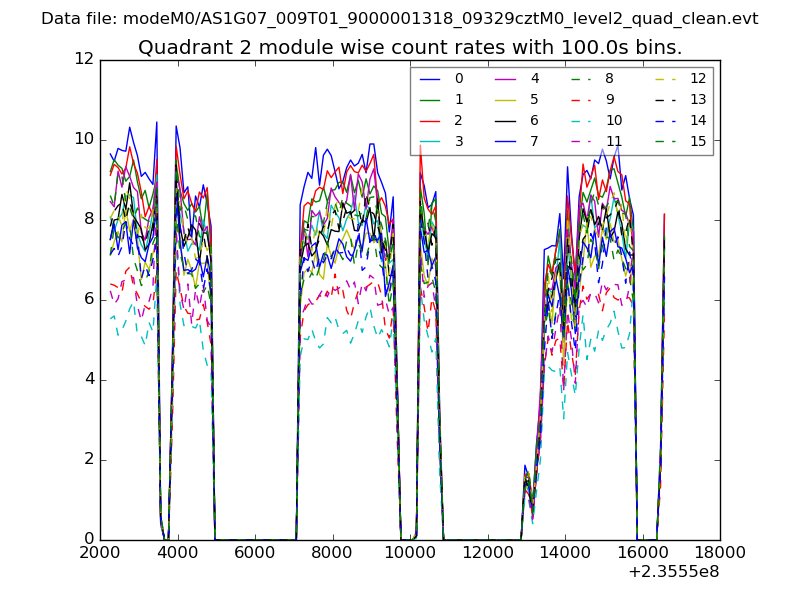
| Module-wise count rates for Quadrant B Data is divided into 100 sec bins |
 |
 |
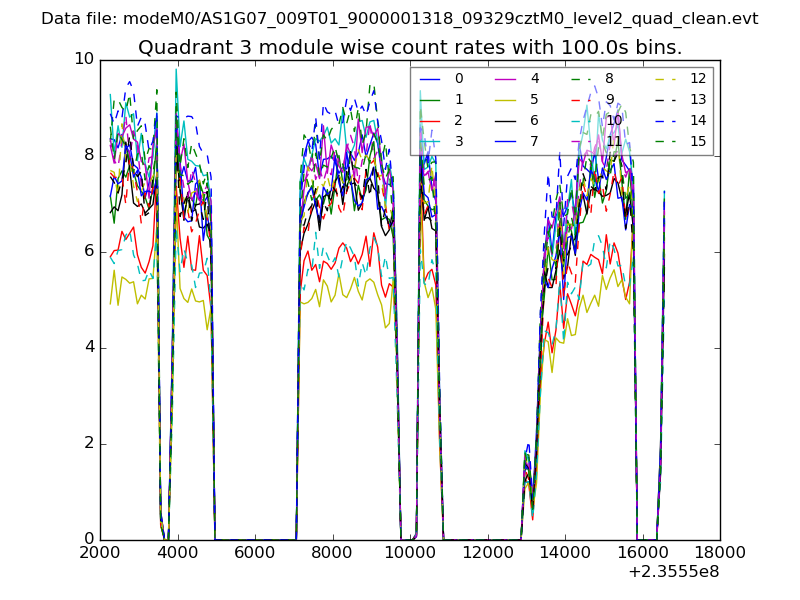
| Module-wise count rates for Quadrant C Data is divided into 100 sec bins |
 |
 |
| Module-wise count rates for Quadrant D Data is divided into 100 sec bins |
 |
 |
| Parameter | Plot |
|---|---|
| CZT HV Monitor | 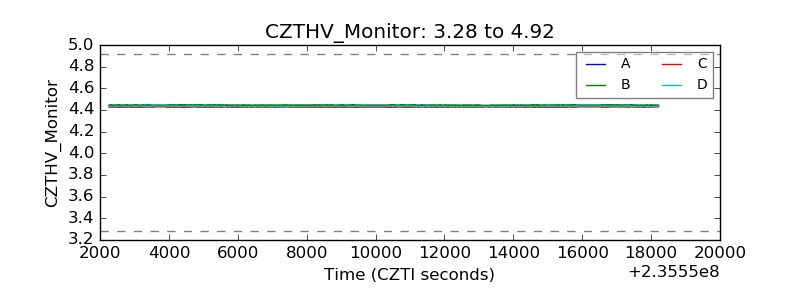 |
| D_VDD | 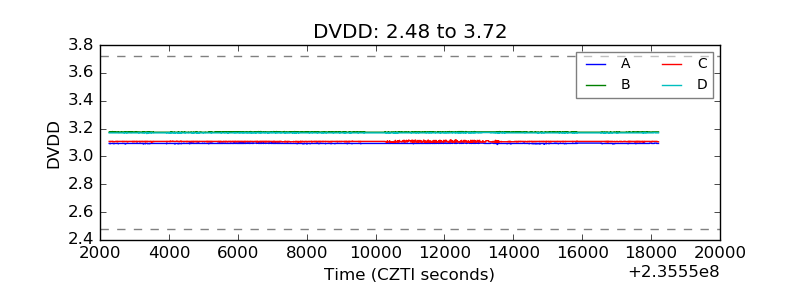 |
| Temperature 1 |  |
| Veto HV Monitor | 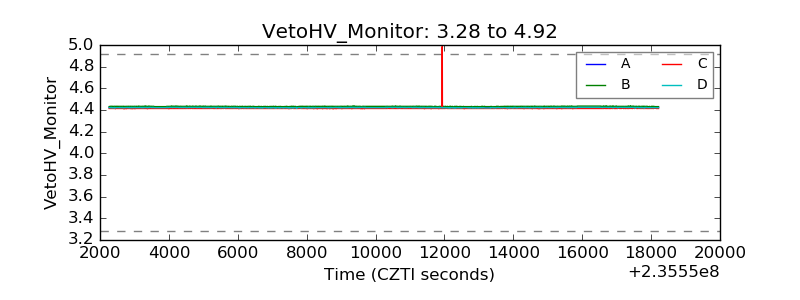 |
| Veto LLD | 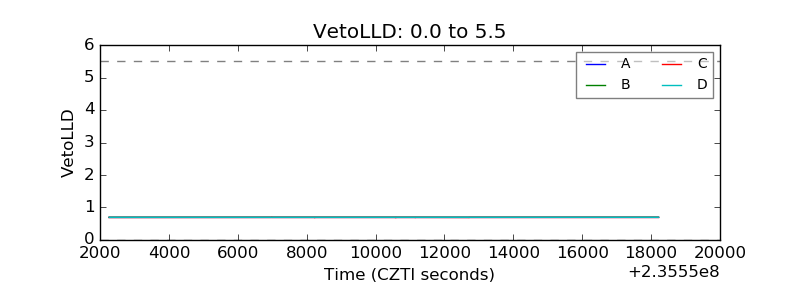 |
| Alpha Counter | 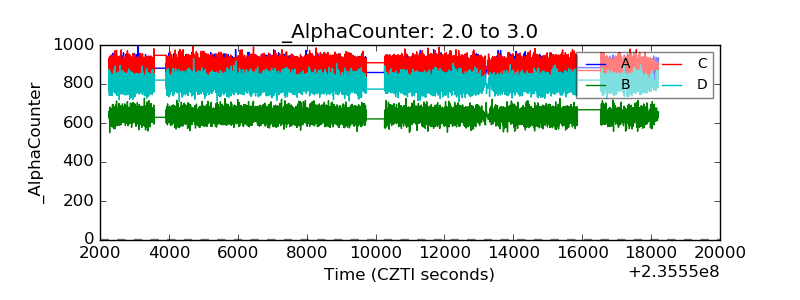 |
| _CPM_Rate | 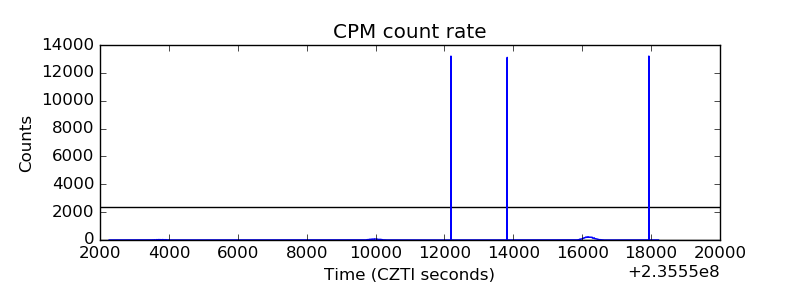 |
| CZT Counter | 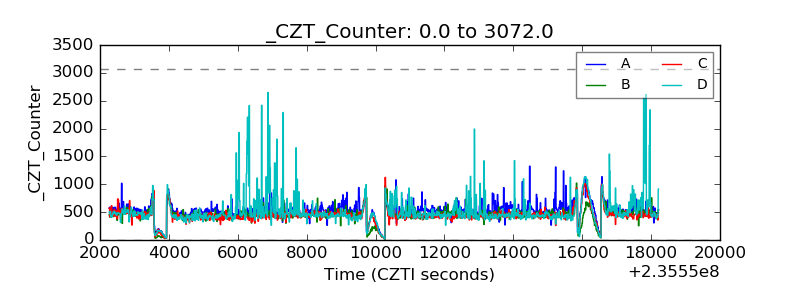 |
| +2.5 Volts monitor | 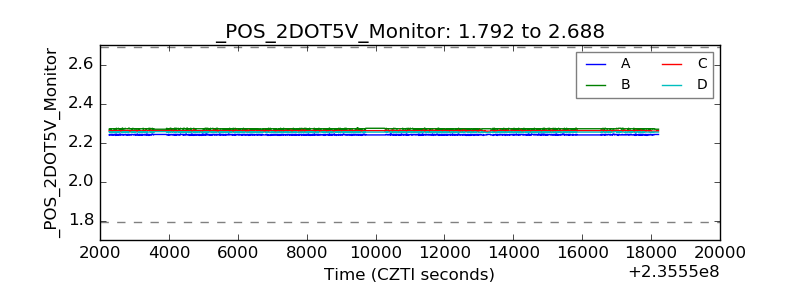 |
| +5 Volts monitor | 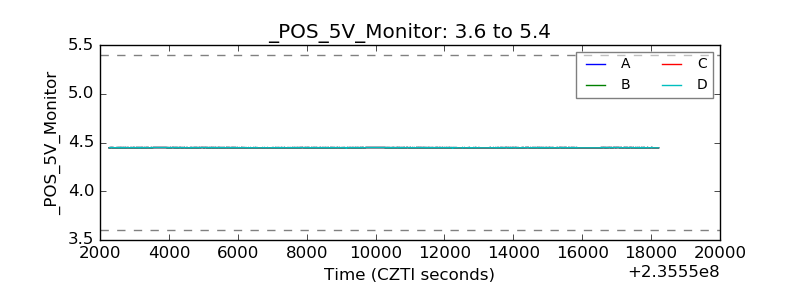 |
| _ROLL_ROT | 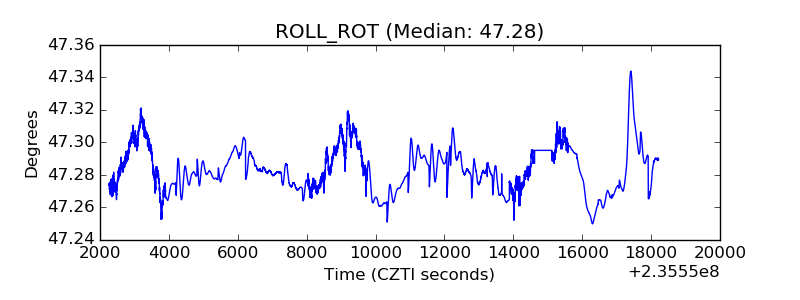 |
| _Roll_DEC | 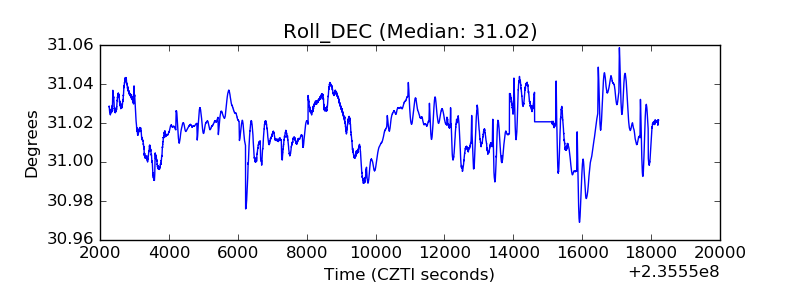 |
| _Roll_RA | 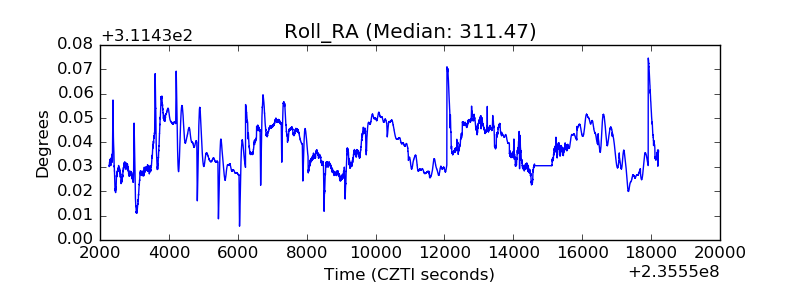 |
| Veto Counter | 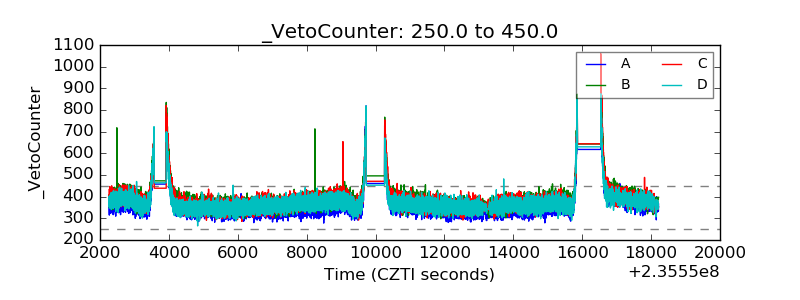 |