| Param | Original file | Final file |
|---|---|---|
| Filename | modeM0/AS1G07_009T01_9000001318_09331cztM0_level2.evt | modeM0/AS1G07_009T01_9000001318_09331cztM0_level2_quad_clean.evt |
| Size (bytes) | 158,785,920 | 12,326,400 |
| Size | 151.4 MB | 11.8 MB |
| Events in quadrant A | 1,373,437 | 52,090 |
| Events in quadrant B | 1,004,885 | 55,860 |
| Events in quadrant C | 941,045 | 53,946 |
| Events in quadrant D | 1,339,044 | 53,060 |
| Mode M0 | |||
|---|---|---|---|
| Quadrant | BADHDUFLAG | Total packets | Discarded packets |
| A | 0 | 5459 | 114 |
| B | 0 | 4461 | 67 |
| C | 0 | 4418 | 61 |
| D | 0 | 5548 | 87 |
| Mode SS | |||
|---|---|---|---|
| Quadrant | BADHDUFLAG | Total packets | Discarded packets |
| A | 0 | 44 | 0 |
| B | 0 | 44 | 0 |
| C | 0 | 44 | 0 |
| D | 0 | 44 | 0 |
| Quadrant | Total seconds | Saturated seconds | Saturation percentage |
|---|---|---|---|
| A | 2174 | 55 | 2.529899% |
| B | 2174 | 1 | 0.045998% |
| C | 2176 | 0 | 0.000000% |
| D | 2173 | 76 | 3.497469% |
Noise dominated data is calculated using 1-second bins in cleaned event files. If a bin has >2000 counts, and if more than 50% of those come from <1% of pixels, then it is considered to be noise-dominated and hence unusable.
| Quadrant | # 1 sec bins | Bins with >0 counts | Bins with >2000 counts | High rate bins dominated by noise | Noise dominated (total time) | Noise dominated (detector-on time) | Marked lightcurve |
|---|---|---|---|---|---|---|---|
| A | 2206 | 2206 | 33 | 33 | 1.50% | 1.50% | 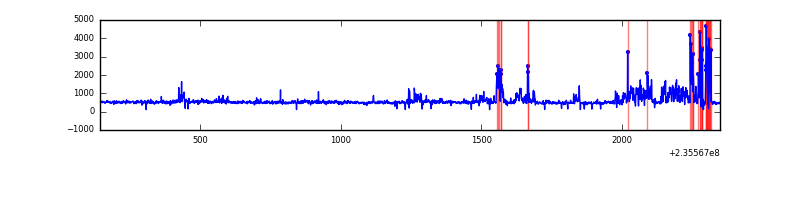 |
| B | 2206 | 2205 | 0 | 0 | 0.00% | 0.00% | 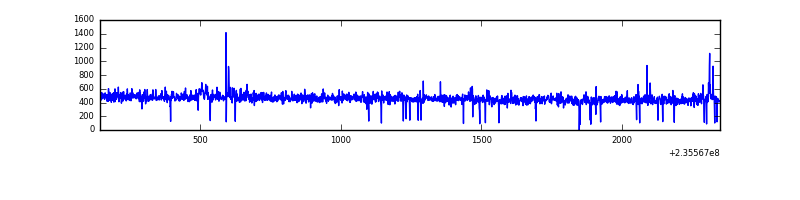 |
| C | 2206 | 2205 | 0 | 0 | 0.00% | 0.00% | 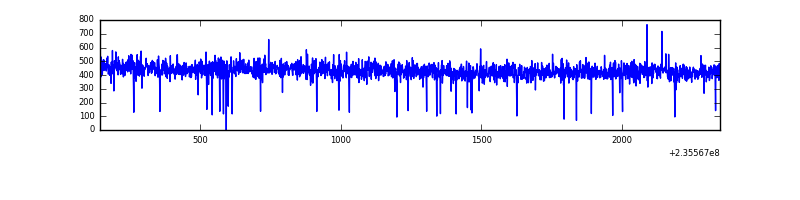 |
| D | 2206 | 2205 | 56 | 56 | 2.54% | 2.54% | 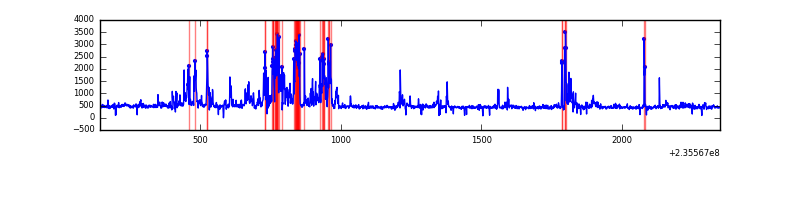 |
Top three noisy pixels from each quadrant. If the there are fewer than three noisy pixels in the level2.evt file, extra rows are filled as -1
| Pixel properties | Quadrant properties | ||||||
|---|---|---|---|---|---|---|---|
| Quadrant | DetID | PixID | Counts | Sigma | Mean | Median | Sigma |
| A | 8 | 5 | 378360 | 7041.58 | 251 | 245 | 53.7 |
| A | 1 | 162 | 11604 | 211.54 | 251 | 245 | 53.7 |
| A | 13 | 251 | 6259 | 112.0 | 251 | 245 | 53.7 |
| B | 12 | 111 | 5347 | 101.45 | 252 | 246 | 50.3 |
| B | 0 | 230 | 5125 | 97.04 | 252 | 246 | 50.3 |
| B | 3 | 209 | 4549 | 85.58 | 252 | 246 | 50.3 |
| C | 13 | 61 | 1812 | 27.42 | 240 | 241 | 57.3 |
| C | 8 | 222 | 1302 | 18.52 | 240 | 241 | 57.3 |
| C | 3 | 202 | 628 | 6.75 | 240 | 241 | 57.3 |
| D | 1 | 52 | 373282 | 5952.46 | 240 | 233 | 62.7 |
| D | 12 | 233 | 17227 | 271.16 | 240 | 233 | 62.7 |
| D | 2 | 14 | 10172 | 158.59 | 240 | 233 | 62.7 |
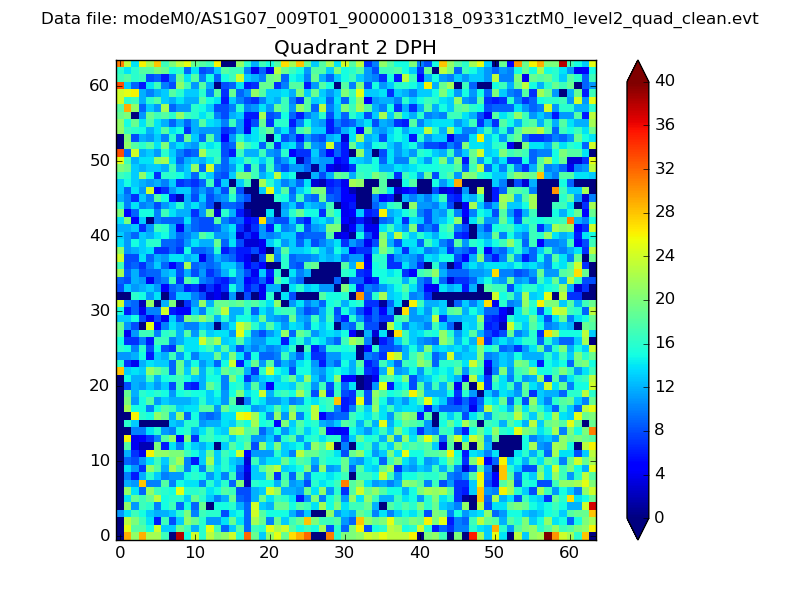
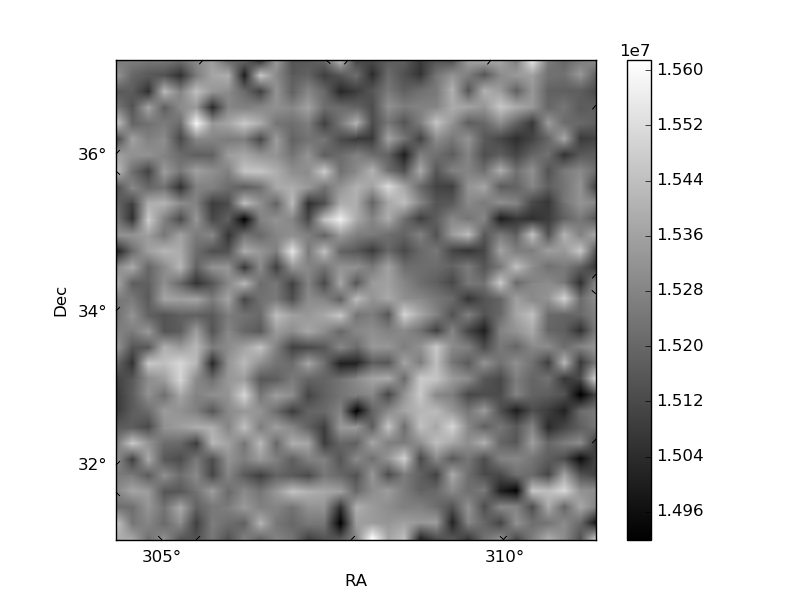
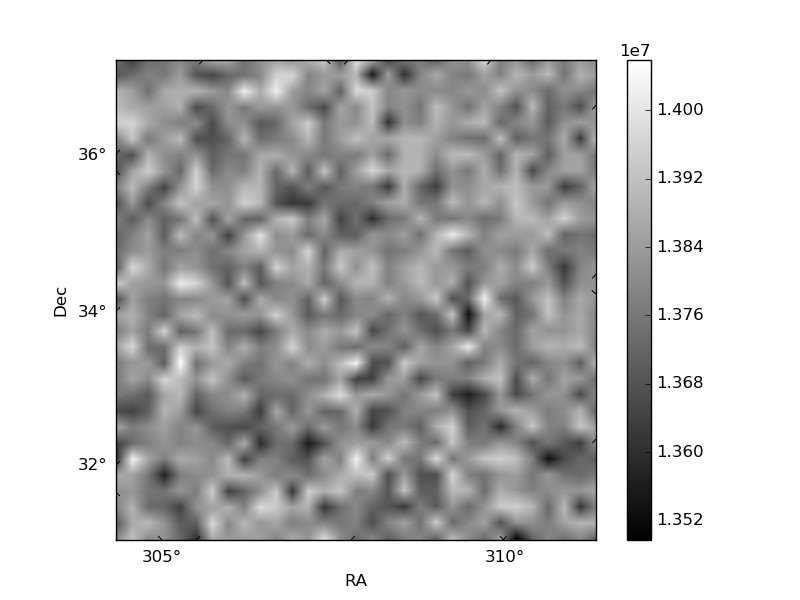
Histogram calculated using DETX and DETY for each event in the final _common_clean file
| Quadrant A | 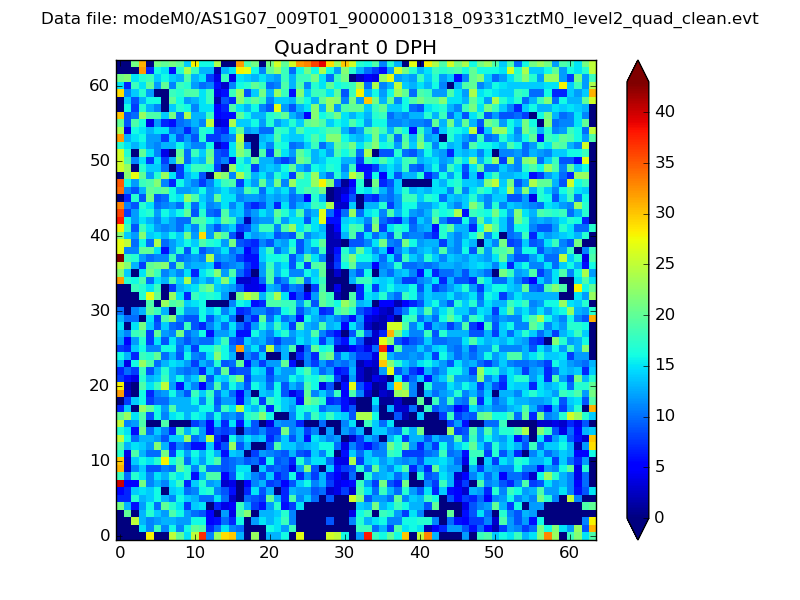 |
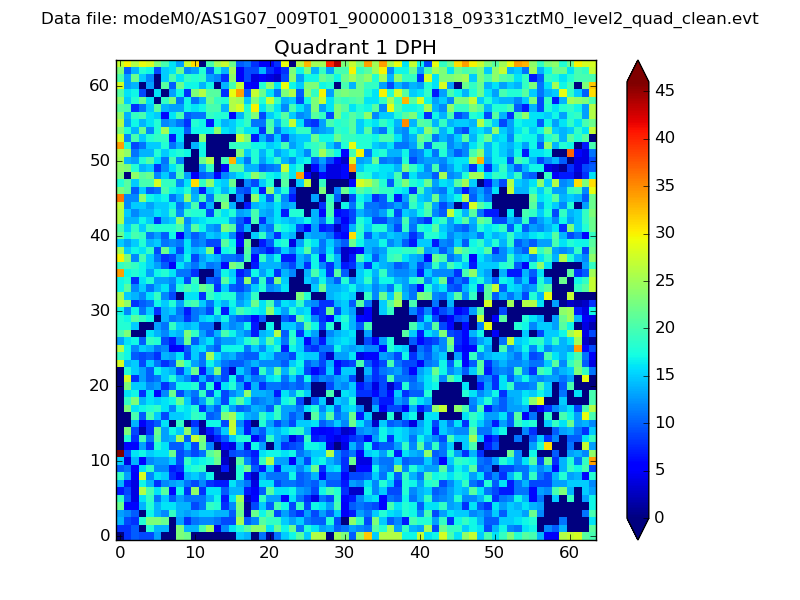 |
Quadrant B |
|---|---|---|---|
| Quadrant D | 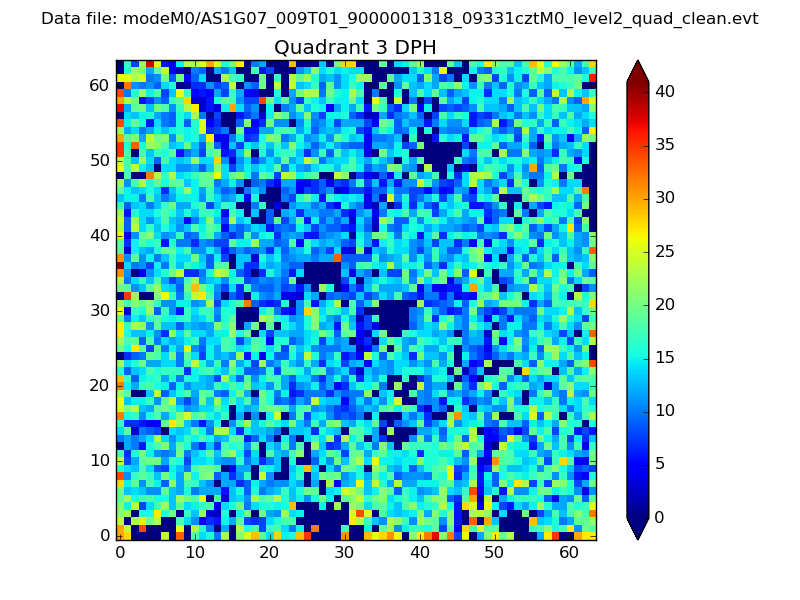 |
 |
Quadrant C |
| Plot type | Count rate plots | Images |
|---|---|---|
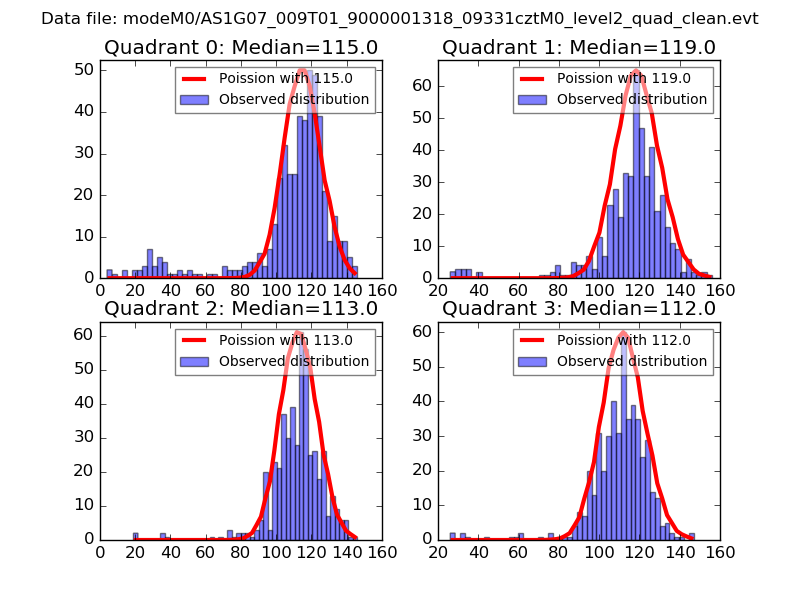
| Comparison with Poisson distribution Blue bars denote a histogram of data divided into 1 sec bins. Red curve is a Poisson curve with rate = median count rate of data. |
 |
 |
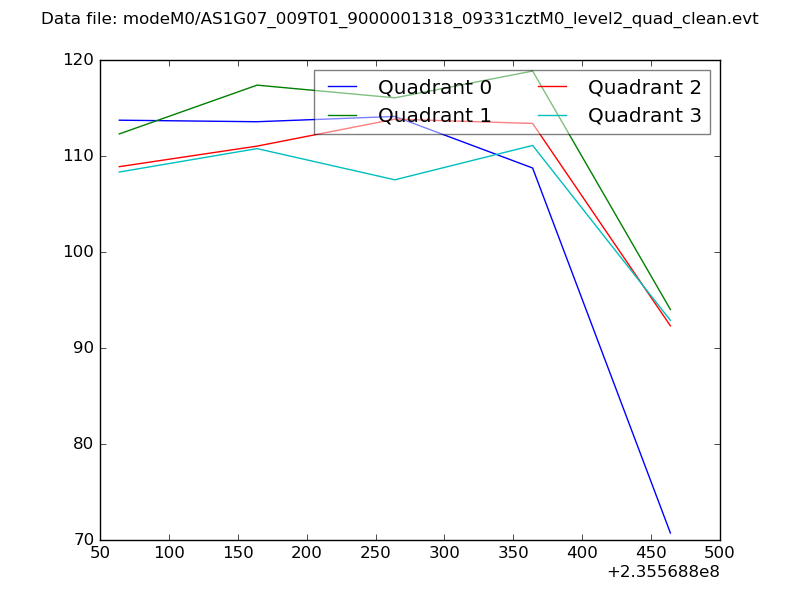
| Quadrant-wise count rates Data is divided into 100 sec bins |
 |
|
| Module-wise count rates for Quadrant A Data is divided into 100 sec bins |
 |
 |
| Module-wise count rates for Quadrant B Data is divided into 100 sec bins |
 |
 |
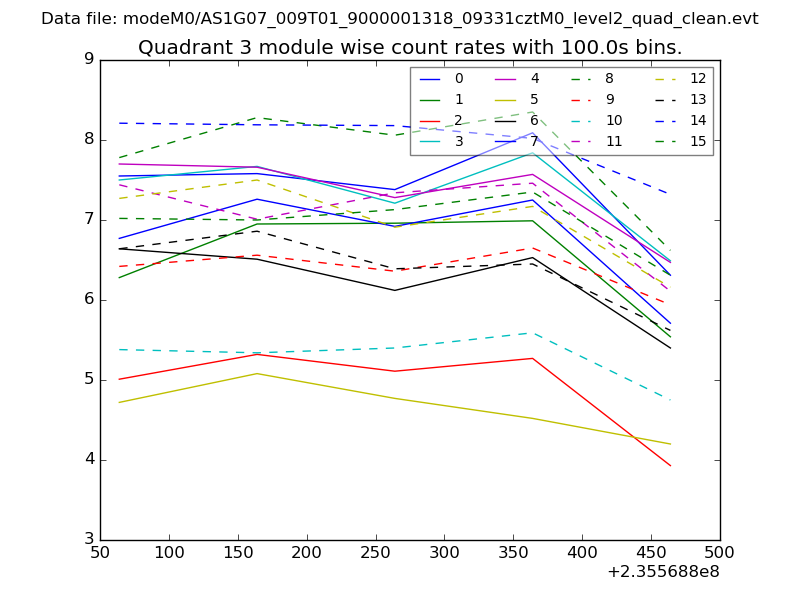
| Module-wise count rates for Quadrant C Data is divided into 100 sec bins |
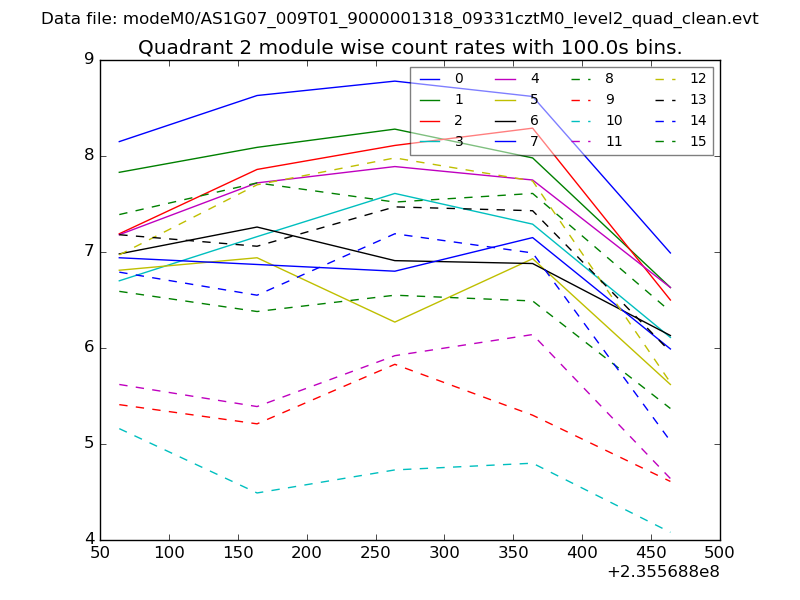 |
 |
| Module-wise count rates for Quadrant D Data is divided into 100 sec bins |
 |
 |
| Parameter | Plot |
|---|---|
| CZT HV Monitor | 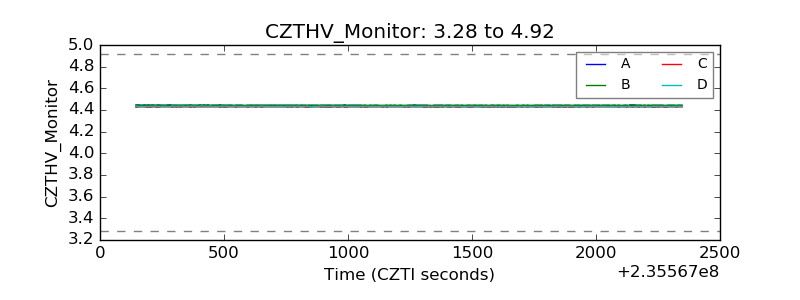 |
| D_VDD | 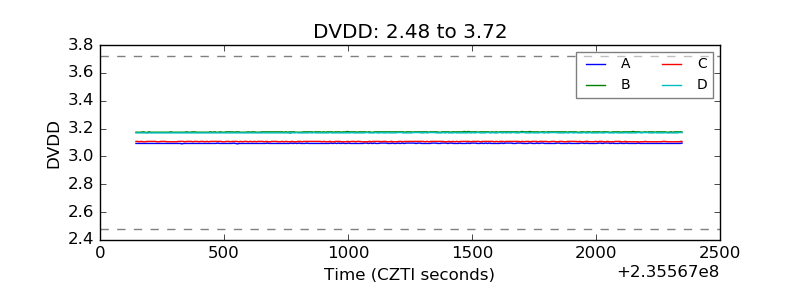 |
| Temperature 1 | 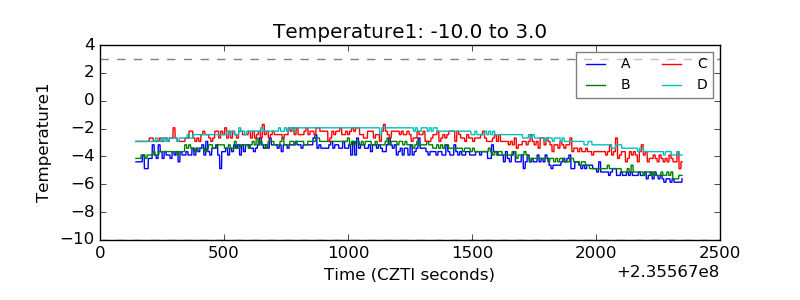 |
| Veto HV Monitor | 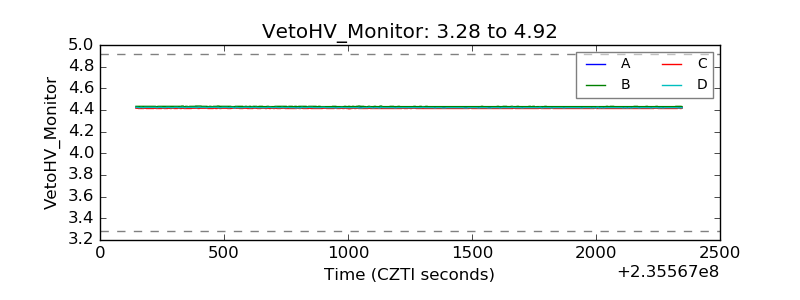 |
| Veto LLD |  |
| Alpha Counter | 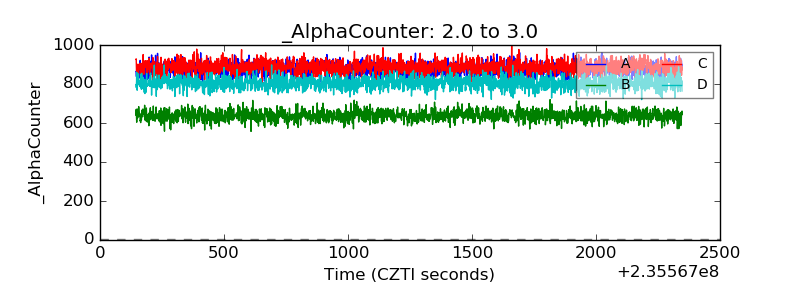 |
| _CPM_Rate | 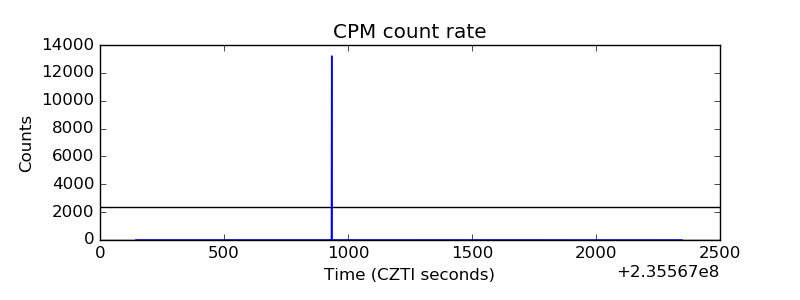 |
| CZT Counter | 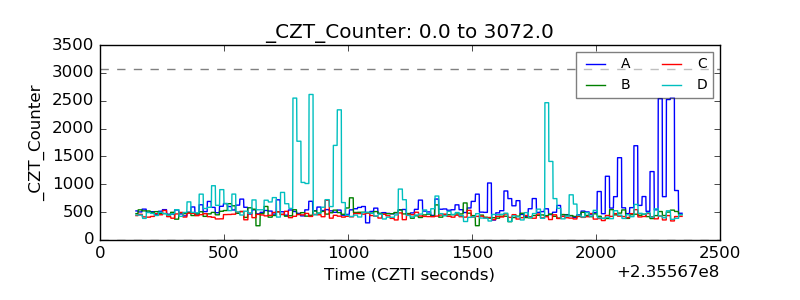 |
| +2.5 Volts monitor |  |
| +5 Volts monitor | 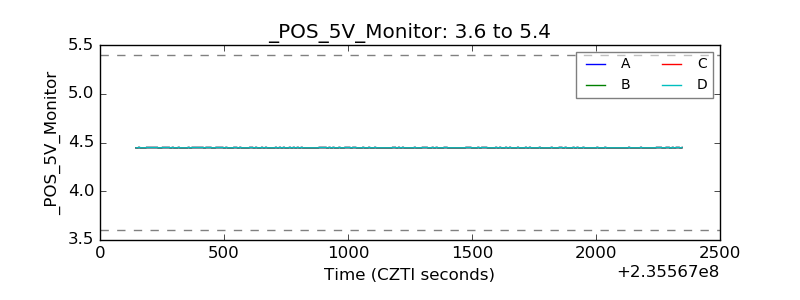 |
| _ROLL_ROT | 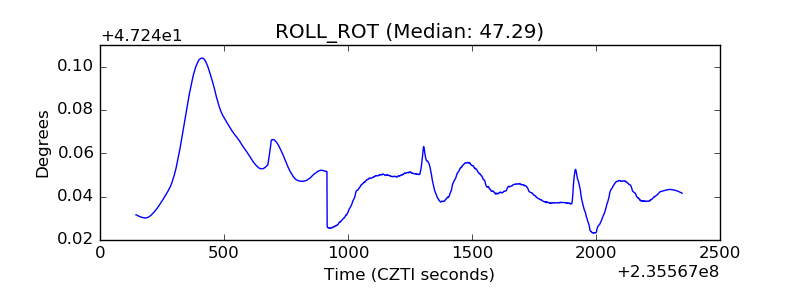 |
| _Roll_DEC | 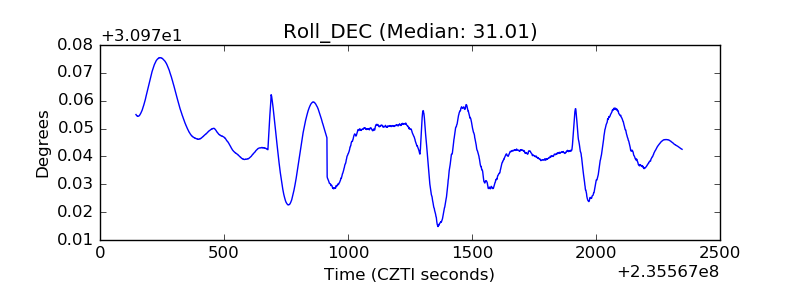 |
| _Roll_RA | 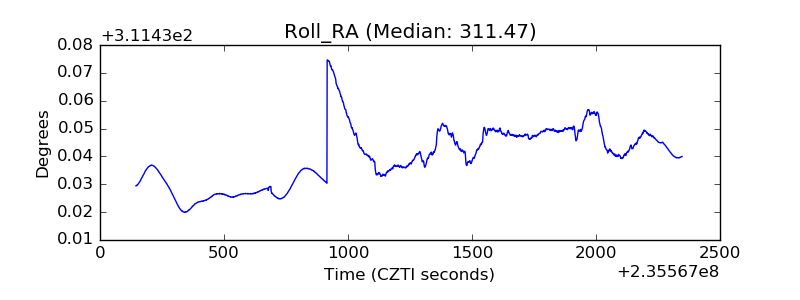 |
| Veto Counter | 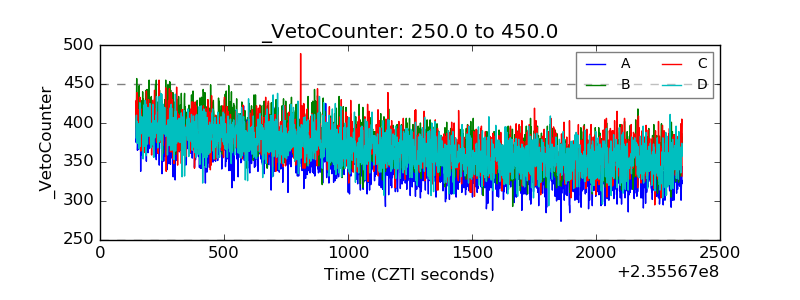 |