| Param | Original file | Final file |
|---|---|---|
| Filename | modeM0/AS1G07_022T01_9000001322cztM0_level2.fits | modeM0/AS1G07_022T01_9000001322cztM0_level2_quad_clean.evt |
| Size (bytes) | 23,411,520 | 38,194,560 |
| Size | 22.3 MB | 36.4 MB |
| Events in quadrant A | 134,868 | 247,075 |
| Events in quadrant B | 130,822 | 248,712 |
| Events in quadrant C | 133,435 | 241,028 |
| Events in quadrant D | 116,974 | 226,206 |
| Mode M0 | |||
|---|---|---|---|
| Quadrant | BADHDUFLAG | Total packets | Discarded packets |
| A | 0 | 8146 | 0 |
| B | 0 | 5730 | 0 |
| C | 0 | 6224 | 0 |
| D | 0 | 6084 | 0 |
| Mode SS | |||
|---|---|---|---|
| Quadrant | BADHDUFLAG | Total packets | Discarded packets |
| A | 0 | 54 | 0 |
| B | 0 | 54 | 0 |
| C | 0 | 54 | 0 |
| D | 0 | 54 | 0 |
| Mode M9 | |||
|---|---|---|---|
| Quadrant | BADHDUFLAG | Total packets | Discarded packets |
| A | 0 | 137 | 0 |
| B | 0 | 134 | 0 |
| C | 0 | 135 | 0 |
| D | 0 | 135 | 0 |
| Quadrant | Total seconds | Saturated seconds | Saturation percentage |
|---|---|---|---|
| A | 2696 | 74 | 2.744807% |
| B | 2696 | 10 | 0.370920% |
| C | 2697 | 5 | 0.185391% |
| D | 2696 | 46 | 1.706231% |
Noise dominated data is calculated using 1-second bins in cleaned event files. If a bin has >2000 counts, and if more than 50% of those come from <1% of pixels, then it is considered to be noise-dominated and hence unusable.
| Quadrant | # 1 sec bins | Bins with >0 counts | Bins with >2000 counts | High rate bins dominated by noise | Noise dominated (total time) | Noise dominated (detector-on time) | Marked lightcurve |
|---|---|---|---|---|---|---|---|
| A | 2696 | 2696 | 0 | 0 | 0.00% | 0.00% |  |
| B | 2696 | 2696 | 0 | 0 | 0.00% | 0.00% |  |
| C | 43076 | 2698 | 0 | 0 | 0.00% | 0.00% |  |
| D | 2696 | 2696 | 0 | 0 | 0.00% | 0.00% | 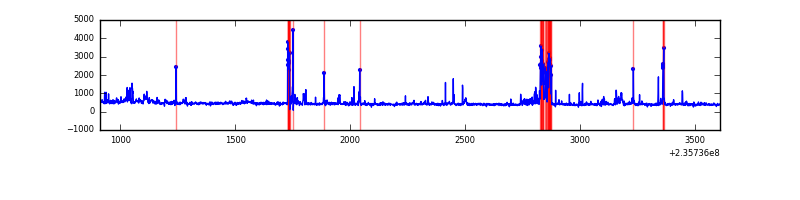 |
Top three noisy pixels from each quadrant. If the there are fewer than three noisy pixels in the level2.evt file, extra rows are filled as -1
| Pixel properties | Quadrant properties | ||||||
|---|---|---|---|---|---|---|---|
| Quadrant | DetID | PixID | Counts | Sigma | Mean | Median | Sigma |
| A | 0 | 29 | 136 | 9.68 | 35 | 33 | 10.6 |
| A | 14 | 204 | 123 | 8.46 | 35 | 33 | 10.6 |
| A | 7 | 110 | 122 | 8.36 | 35 | 33 | 10.6 |
| B | 2 | 9 | 122 | 9.61 | 34 | 33 | 9.3 |
| B | 3 | 80 | 100 | 7.23 | 34 | 33 | 9.3 |
| B | 4 | 146 | 98 | 7.02 | 34 | 33 | 9.3 |
| C | 4 | 254 | 99 | 6.07 | 35 | 32 | 11.0 |
| C | 3 | 158 | 97 | 5.89 | 35 | 32 | 11.0 |
| C | 1 | 81 | 97 | 5.89 | 35 | 32 | 11.0 |
| D | 3 | 14 | 113 | 7.92 | 33 | 30 | 10.5 |
| D | 4 | 160 | 101 | 6.78 | 33 | 30 | 10.5 |
| D | 6 | 231 | 94 | 6.11 | 33 | 30 | 10.5 |
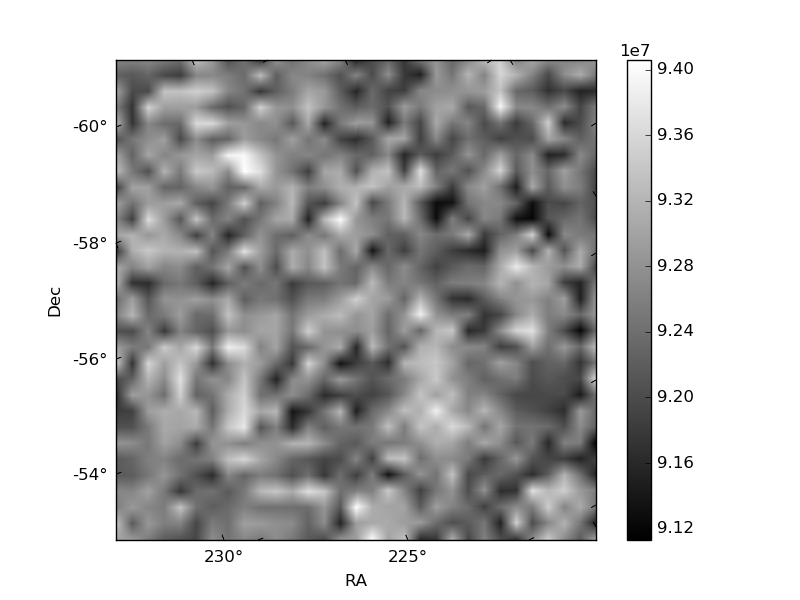
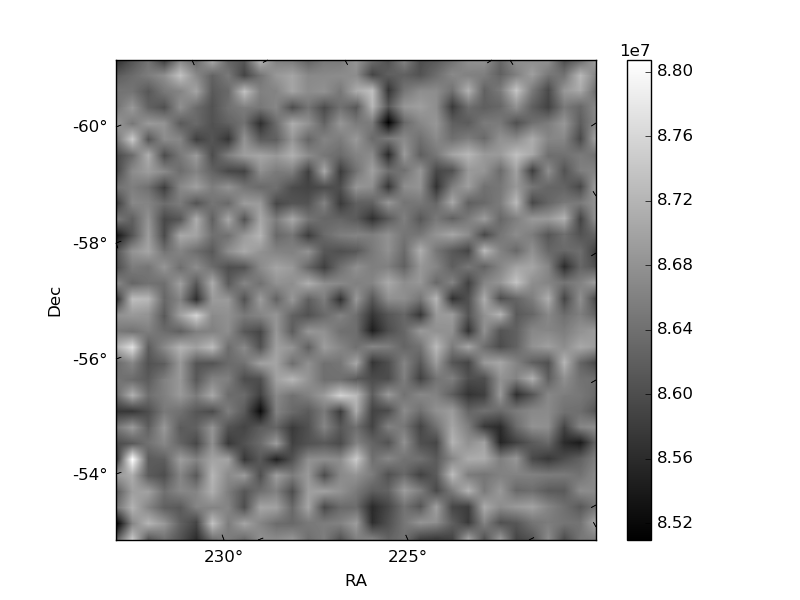
Histogram calculated using DETX and DETY for each event in the final _common_clean file
| Quadrant A |  |
 |
Quadrant B |
|---|---|---|---|
| Quadrant D | 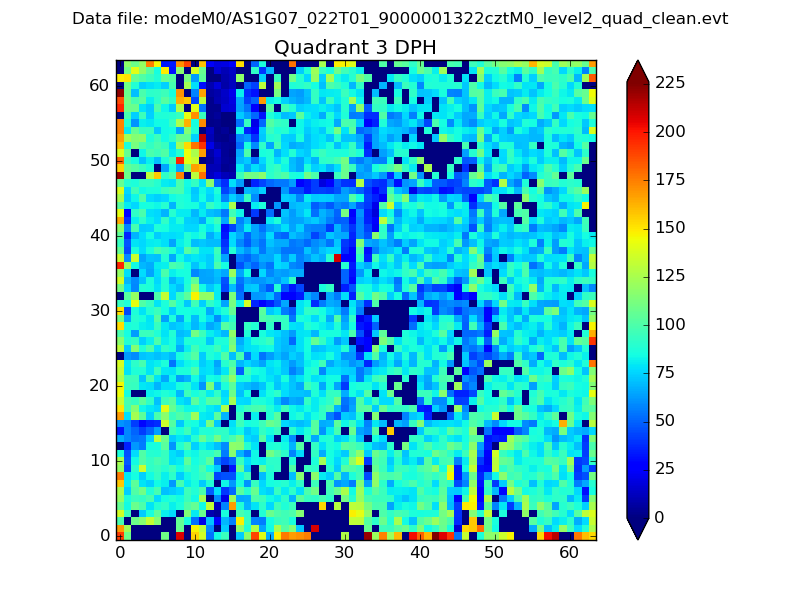 |
 |
Quadrant C |
| Plot type | Count rate plots | Images |
|---|---|---|
| Comparison with Poisson distribution Blue bars denote a histogram of data divided into 1 sec bins. Red curve is a Poisson curve with rate = median count rate of data. |
 |
 |
| Quadrant-wise count rates Data is divided into 100 sec bins |
 |
|
| Module-wise count rates for Quadrant A Data is divided into 100 sec bins |
 |
 |
| Module-wise count rates for Quadrant B Data is divided into 100 sec bins |
 |
 |
| Module-wise count rates for Quadrant C Data is divided into 100 sec bins |
 |
 |
| Module-wise count rates for Quadrant D Data is divided into 100 sec bins |
 |
 |
| Parameter | Plot |
|---|---|
| CZT HV Monitor |  |
| D_VDD |  |
| Temperature 1 |  |
| Veto HV Monitor |  |
| Veto LLD |  |
| Alpha Counter |  |
| _CPM_Rate |  |
| CZT Counter |  |
| +2.5 Volts monitor |  |
| +5 Volts monitor | 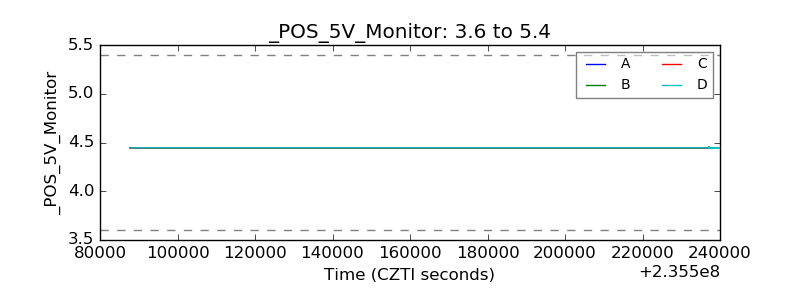 |
| _ROLL_ROT |  |
| _Roll_DEC | 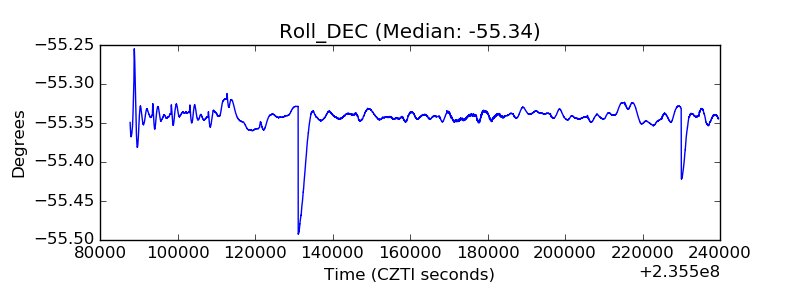 |
| _Roll_RA | 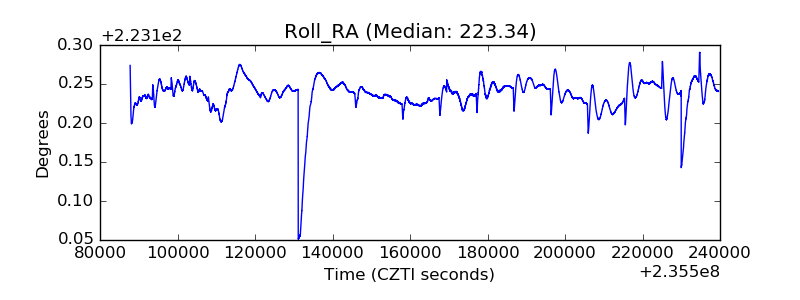 |
| Veto Counter | 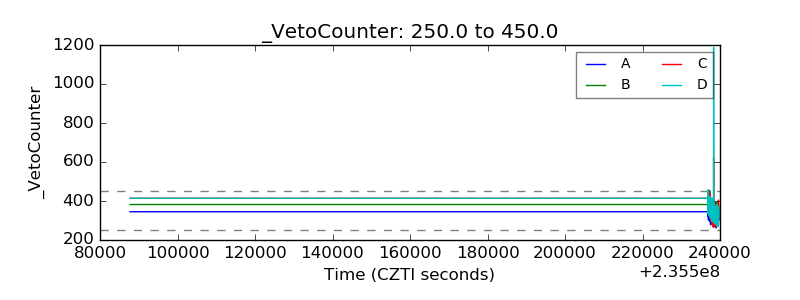 |