| Param | Original file | Final file |
|---|---|---|
| Filename | modeM0/AS1G07_022T01_9000001322_09334cztM0_level2.evt | modeM0/AS1G07_022T01_9000001322_09334cztM0_level2_quad_clean.evt |
| Size (bytes) | 317,819,520 | 52,557,120 |
| Size | 303.1 MB | 50.1 MB |
| Events in quadrant A | 2,805,476 | 333,157 |
| Events in quadrant B | 2,194,522 | 331,478 |
| Events in quadrant C | 2,320,641 | 317,858 |
| Events in quadrant D | 2,022,028 | 316,551 |
| Mode M0 | |||
|---|---|---|---|
| Quadrant | BADHDUFLAG | Total packets | Discarded packets |
| A | 0 | 11137 | 2 |
| B | 0 | 9139 | 1 |
| C | 0 | 9671 | 1 |
| D | 0 | 8924 | 1 |
| Mode SS | |||
|---|---|---|---|
| Quadrant | BADHDUFLAG | Total packets | Discarded packets |
| A | 0 | 86 | 0 |
| B | 0 | 86 | 0 |
| C | 0 | 86 | 0 |
| D | 0 | 86 | 0 |
| Mode M9 | |||
|---|---|---|---|
| Quadrant | BADHDUFLAG | Total packets | Discarded packets |
| A | 0 | 12 | 0 |
| B | 0 | 12 | 0 |
| C | 0 | 12 | 0 |
| D | 0 | 12 | 0 |
| Quadrant | Total seconds | Saturated seconds | Saturation percentage |
|---|---|---|---|
| A | 4139 | 91 | 2.198599% |
| B | 4139 | 59 | 1.425465% |
| C | 4139 | 106 | 2.561005% |
| D | 4139 | 52 | 1.256342% |
Noise dominated data is calculated using 1-second bins in cleaned event files. If a bin has >2000 counts, and if more than 50% of those come from <1% of pixels, then it is considered to be noise-dominated and hence unusable.
| Quadrant | # 1 sec bins | Bins with >0 counts | Bins with >2000 counts | High rate bins dominated by noise | Noise dominated (total time) | Noise dominated (detector-on time) | Marked lightcurve |
|---|---|---|---|---|---|---|---|
| A | 5364 | 4140 | 15 | 15 | 0.28% | 0.36% | 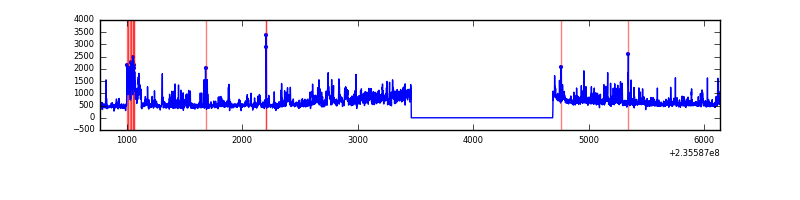 |
| B | 5364 | 4140 | 3 | 3 | 0.06% | 0.07% | 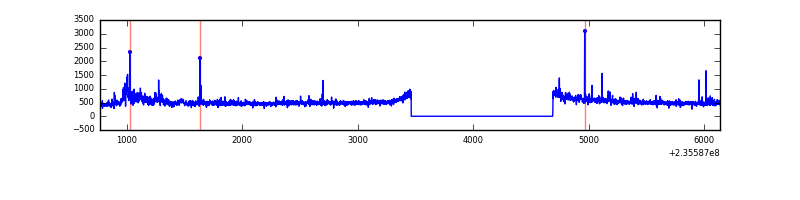 |
| C | 5364 | 4140 | 51 | 51 | 0.95% | 1.23% | 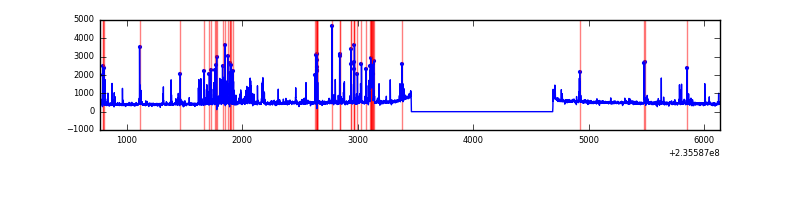 |
| D | 5364 | 4140 | 16 | 16 | 0.30% | 0.39% | 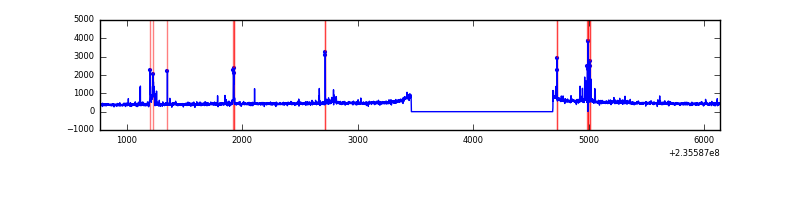 |
Top three noisy pixels from each quadrant. If the there are fewer than three noisy pixels in the level2.evt file, extra rows are filled as -1
| Pixel properties | Quadrant properties | ||||||
|---|---|---|---|---|---|---|---|
| Quadrant | DetID | PixID | Counts | Sigma | Mean | Median | Sigma |
| A | 8 | 5 | 655476 | 6344.65 | 507 | 496 | 103.2 |
| A | 13 | 251 | 112691 | 1086.81 | 507 | 496 | 103.2 |
| A | 1 | 162 | 33697 | 321.61 | 507 | 496 | 103.2 |
| B | 0 | 219 | 130208 | 1333.2 | 510 | 497 | 97.3 |
| B | 0 | 214 | 31033 | 313.86 | 510 | 497 | 97.3 |
| B | 4 | 173 | 16243 | 161.84 | 510 | 497 | 97.3 |
| C | 4 | 254 | 428079 | 3821.34 | 483 | 485 | 111.9 |
| C | 13 | 61 | 3701 | 28.74 | 483 | 485 | 111.9 |
| C | 4 | 238 | 2930 | 21.85 | 483 | 485 | 111.9 |
| D | 7 | 71 | 87320 | 684.81 | 484 | 471 | 126.8 |
| D | 1 | 52 | 30840 | 239.46 | 484 | 471 | 126.8 |
| D | 2 | 152 | 28957 | 224.62 | 484 | 471 | 126.8 |
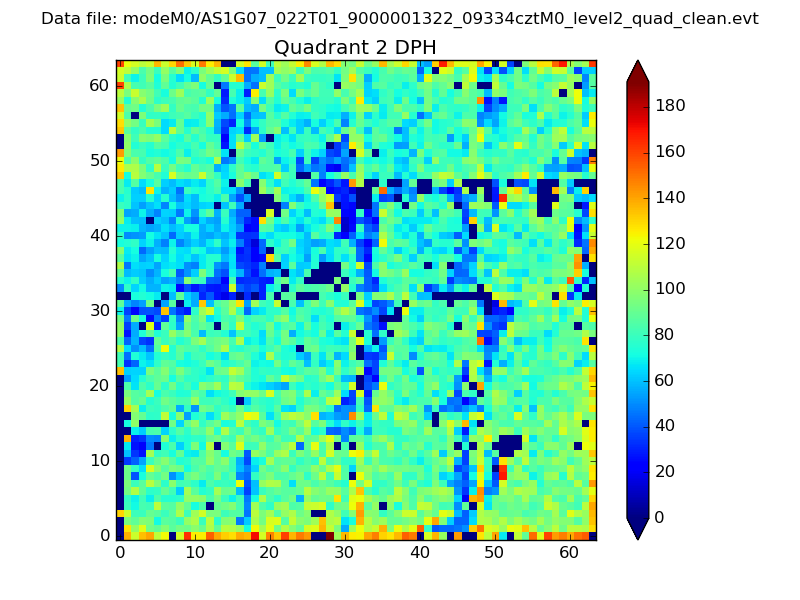
Histogram calculated using DETX and DETY for each event in the final _common_clean file
| Quadrant A | 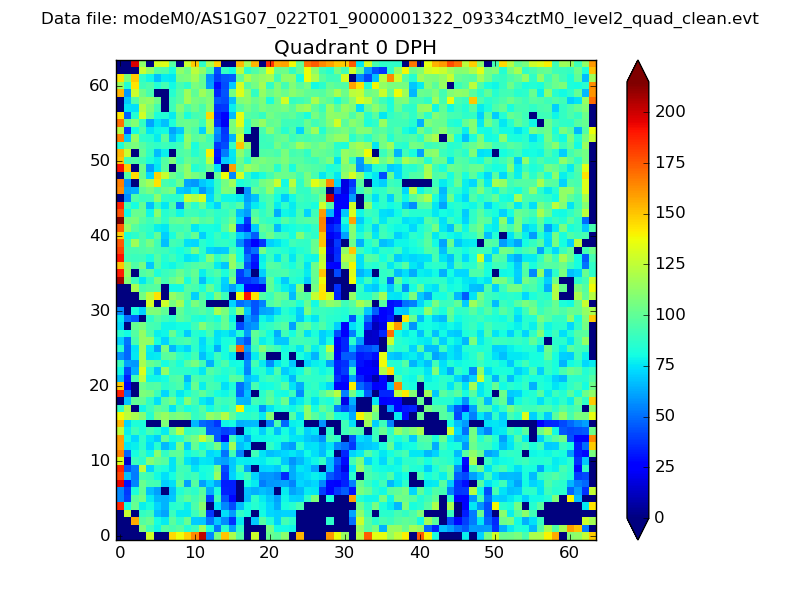 |
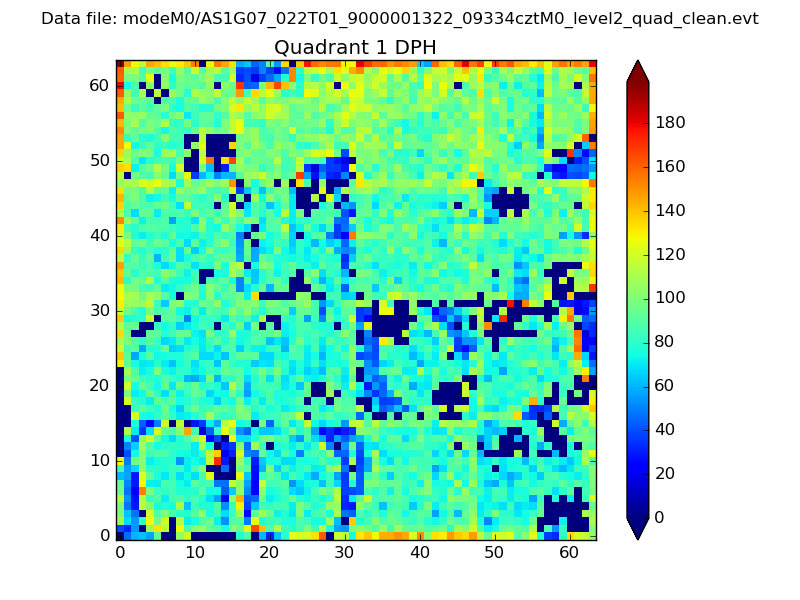 |
Quadrant B |
|---|---|---|---|
| Quadrant D | 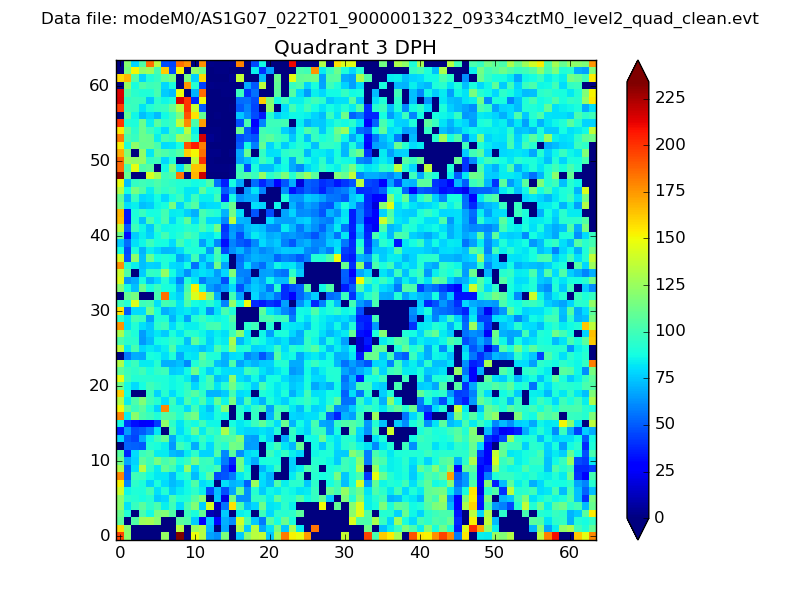 |
 |
Quadrant C |
| Plot type | Count rate plots | Images |
|---|---|---|
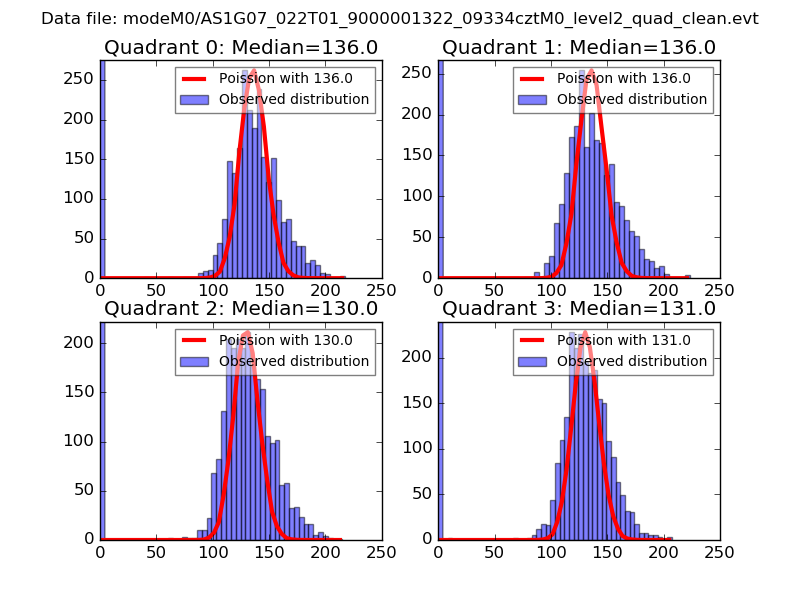
| Comparison with Poisson distribution Blue bars denote a histogram of data divided into 1 sec bins. Red curve is a Poisson curve with rate = median count rate of data. |
 |
 |
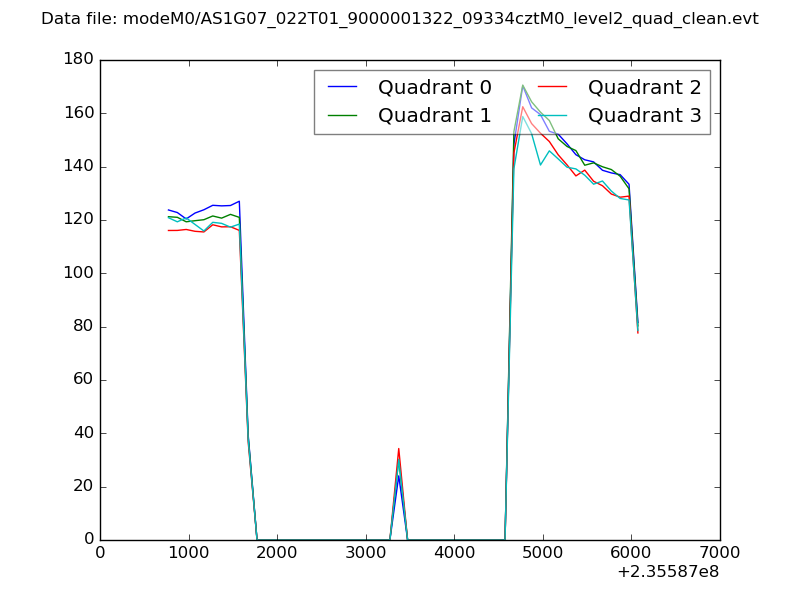
| Quadrant-wise count rates Data is divided into 100 sec bins |
 |
|
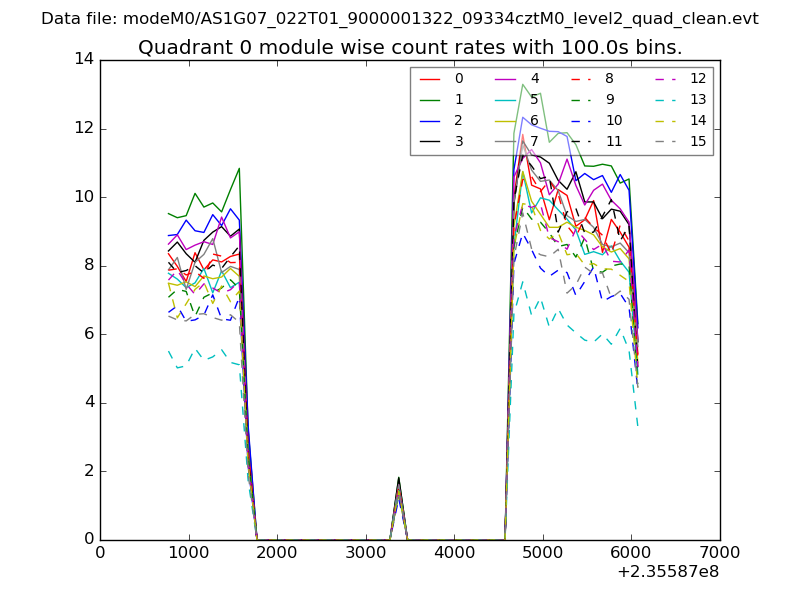
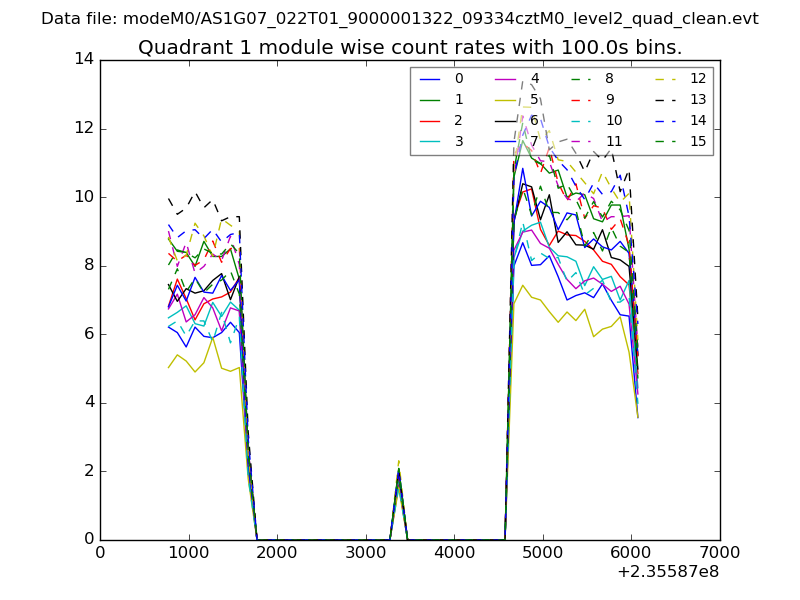
| Module-wise count rates for Quadrant A Data is divided into 100 sec bins |
 |
 |
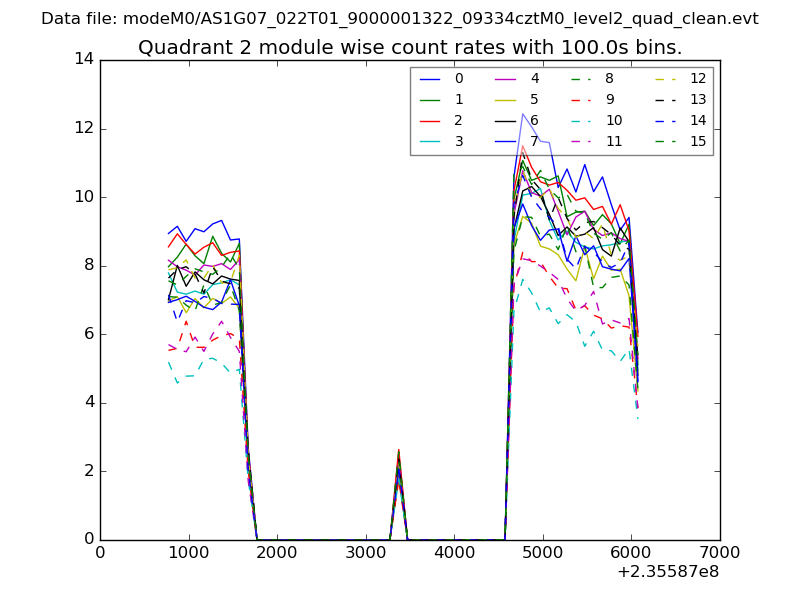
| Module-wise count rates for Quadrant B Data is divided into 100 sec bins |
 |
 |
| Module-wise count rates for Quadrant C Data is divided into 100 sec bins |
 |
 |
| Module-wise count rates for Quadrant D Data is divided into 100 sec bins |
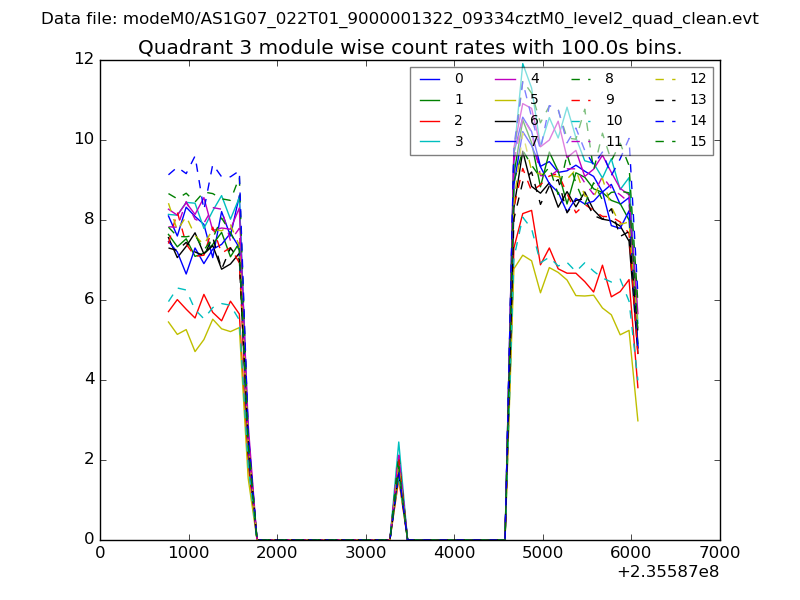 |
 |
| Parameter | Plot |
|---|---|
| CZT HV Monitor | 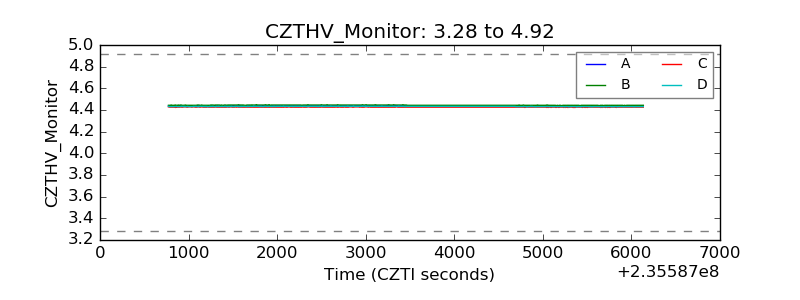 |
| D_VDD |  |
| Temperature 1 | 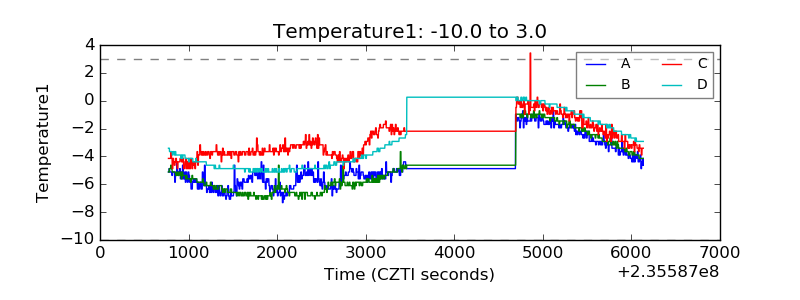 |
| Veto HV Monitor | 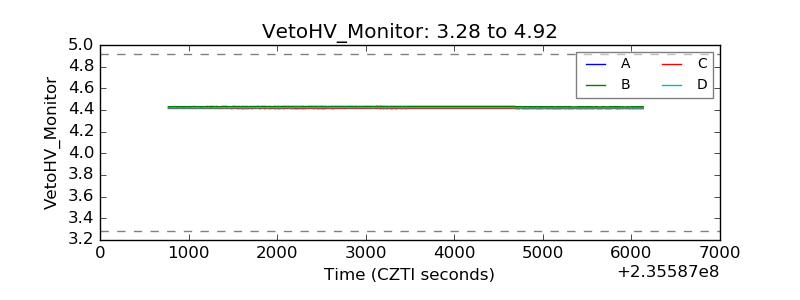 |
| Veto LLD | 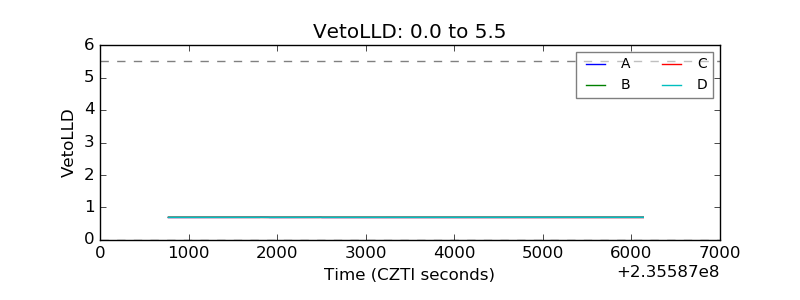 |
| Alpha Counter | 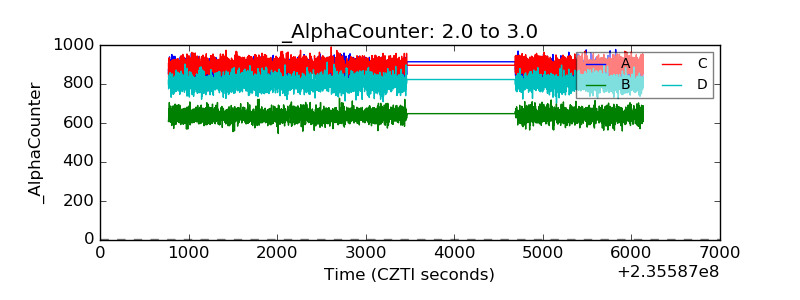 |
| _CPM_Rate | 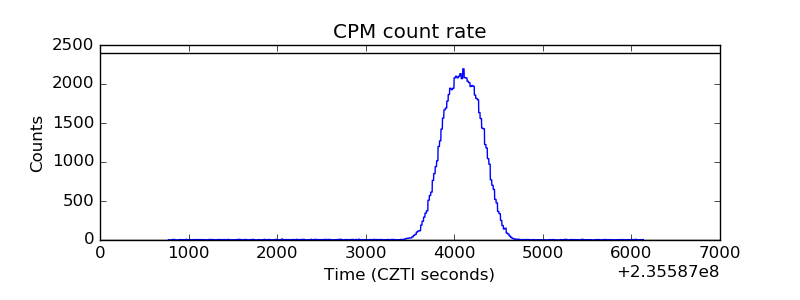 |
| CZT Counter | 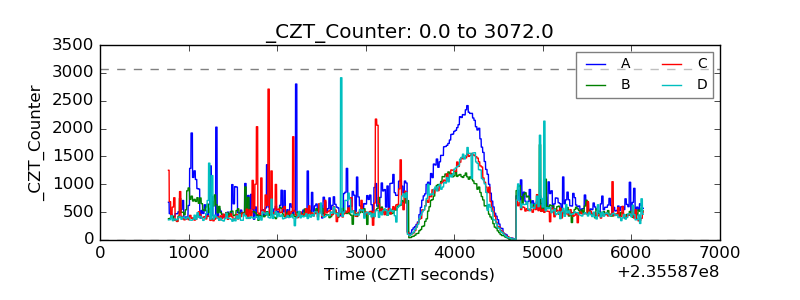 |
| +2.5 Volts monitor |  |
| +5 Volts monitor |  |
| _ROLL_ROT | 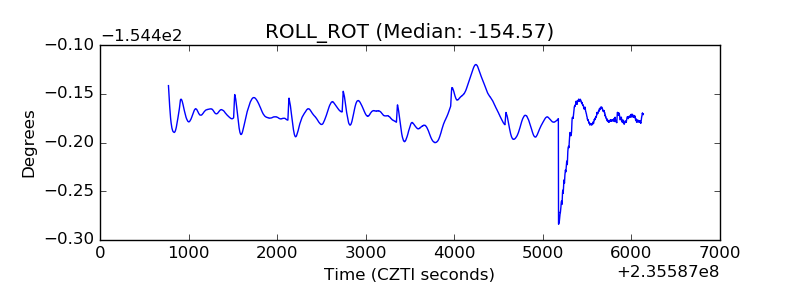 |
| _Roll_DEC | 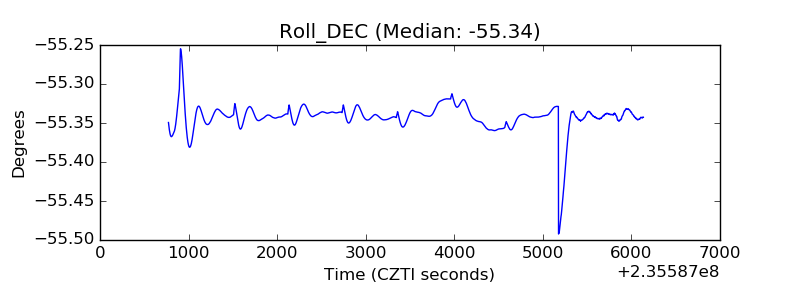 |
| _Roll_RA | 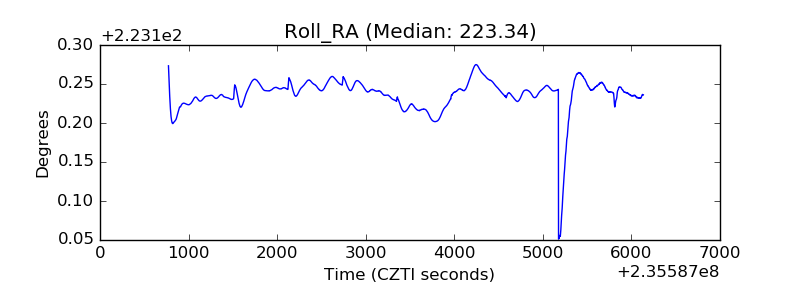 |
| Veto Counter | 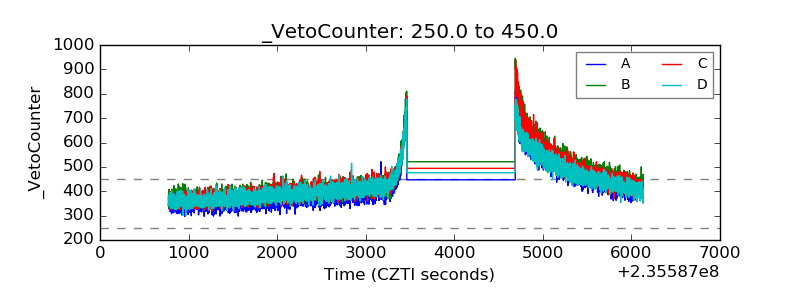 |