| Param | Original file | Final file |
|---|---|---|
| Filename | modeM0/AS1G07_022T01_9000001322_09335cztM0_level2.evt | modeM0/AS1G07_022T01_9000001322_09335cztM0_level2_quad_clean.evt |
| Size (bytes) | 451,258,560 | 91,270,080 |
| Size | 430.4 MB | 87.0 MB |
| Events in quadrant A | 3,849,310 | 595,635 |
| Events in quadrant B | 3,097,515 | 600,148 |
| Events in quadrant C | 3,149,775 | 579,157 |
| Events in quadrant D | 3,162,907 | 570,700 |
| Mode M0 | |||
|---|---|---|---|
| Quadrant | BADHDUFLAG | Total packets | Discarded packets |
| A | 0 | 15979 | 569 |
| B | 0 | 13446 | 416 |
| C | 0 | 13782 | 314 |
| D | 0 | 13816 | 338 |
| Mode SS | |||
|---|---|---|---|
| Quadrant | BADHDUFLAG | Total packets | Discarded packets |
| A | 0 | 126 | 4 |
| B | 0 | 126 | 0 |
| C | 0 | 126 | 4 |
| D | 0 | 126 | 4 |
| Mode M9 | |||
|---|---|---|---|
| Quadrant | BADHDUFLAG | Total packets | Discarded packets |
| A | 0 | 18 | 0 |
| B | 0 | 18 | 0 |
| C | 0 | 18 | 0 |
| D | 0 | 19 | 0 |
| Quadrant | Total seconds | Saturated seconds | Saturation percentage |
|---|---|---|---|
| A | 5943 | 111 | 1.867744% |
| B | 5971 | 72 | 1.205828% |
| C | 6005 | 107 | 1.781848% |
| D | 6005 | 84 | 1.398834% |
Noise dominated data is calculated using 1-second bins in cleaned event files. If a bin has >2000 counts, and if more than 50% of those come from <1% of pixels, then it is considered to be noise-dominated and hence unusable.
| Quadrant | # 1 sec bins | Bins with >0 counts | Bins with >2000 counts | High rate bins dominated by noise | Noise dominated (total time) | Noise dominated (detector-on time) | Marked lightcurve |
|---|---|---|---|---|---|---|---|
| A | 7448 | 6114 | 52 | 52 | 0.70% | 0.85% | 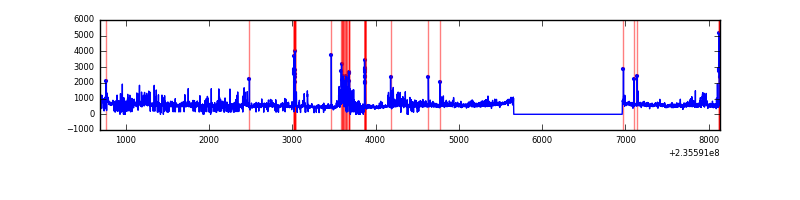 |
| B | 7449 | 6129 | 7 | 7 | 0.09% | 0.11% | 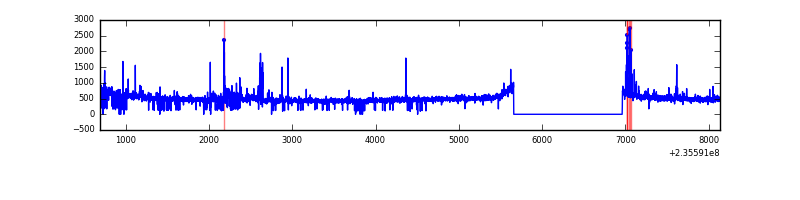 |
| C | 7449 | 6129 | 47 | 47 | 0.63% | 0.77% | 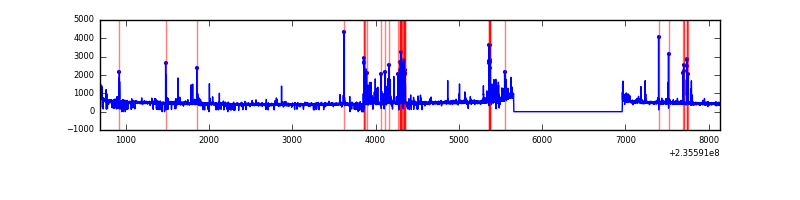 |
| D | 7449 | 6132 | 40 | 40 | 0.54% | 0.65% | 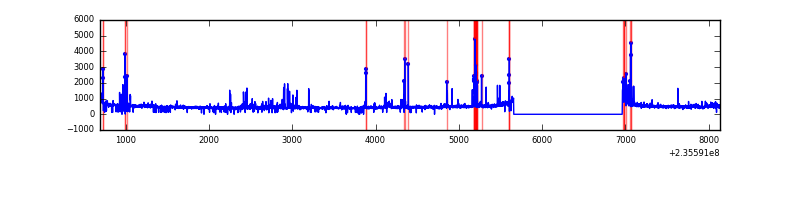 |
Top three noisy pixels from each quadrant. If the there are fewer than three noisy pixels in the level2.evt file, extra rows are filled as -1
| Pixel properties | Quadrant properties | ||||||
|---|---|---|---|---|---|---|---|
| Quadrant | DetID | PixID | Counts | Sigma | Mean | Median | Sigma |
| A | 8 | 5 | 705795 | 4804.3 | 730 | 717 | 146.8 |
| A | 13 | 251 | 110130 | 745.52 | 730 | 717 | 146.8 |
| A | 5 | 16 | 68943 | 464.88 | 730 | 717 | 146.8 |
| B | 0 | 246 | 56191 | 394.04 | 737 | 718 | 140.8 |
| B | 0 | 219 | 50395 | 352.87 | 737 | 718 | 140.8 |
| B | 0 | 214 | 50357 | 352.6 | 737 | 718 | 140.8 |
| C | 4 | 254 | 408298 | 2536.24 | 698 | 703 | 160.7 |
| C | 13 | 61 | 5305 | 28.64 | 698 | 703 | 160.7 |
| C | 8 | 222 | 4186 | 21.67 | 698 | 703 | 160.7 |
| D | 12 | 233 | 148194 | 791.91 | 699 | 680 | 186.3 |
| D | 1 | 52 | 99027 | 527.96 | 699 | 680 | 186.3 |
| D | 7 | 71 | 75024 | 399.11 | 699 | 680 | 186.3 |
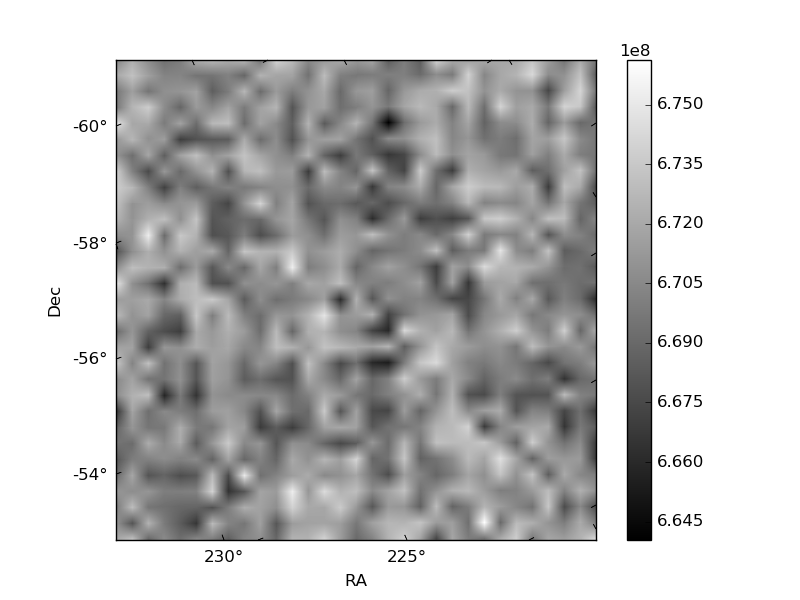
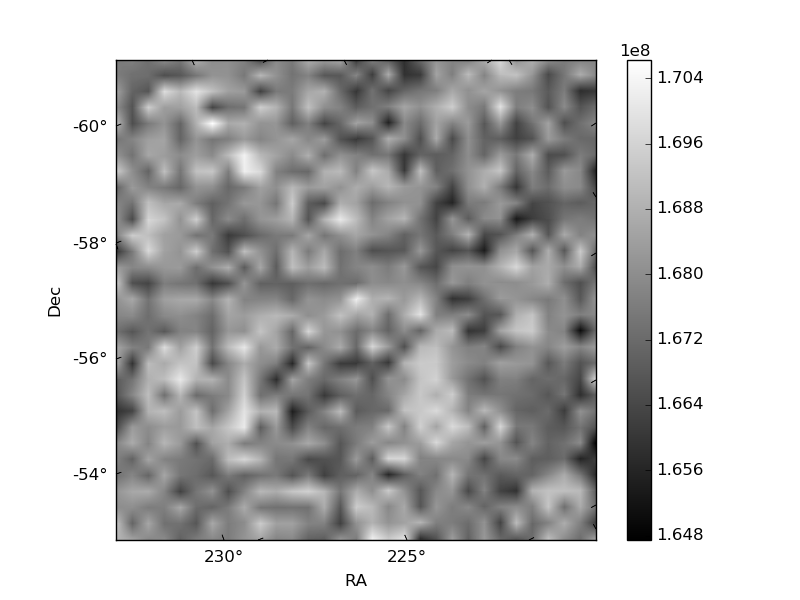
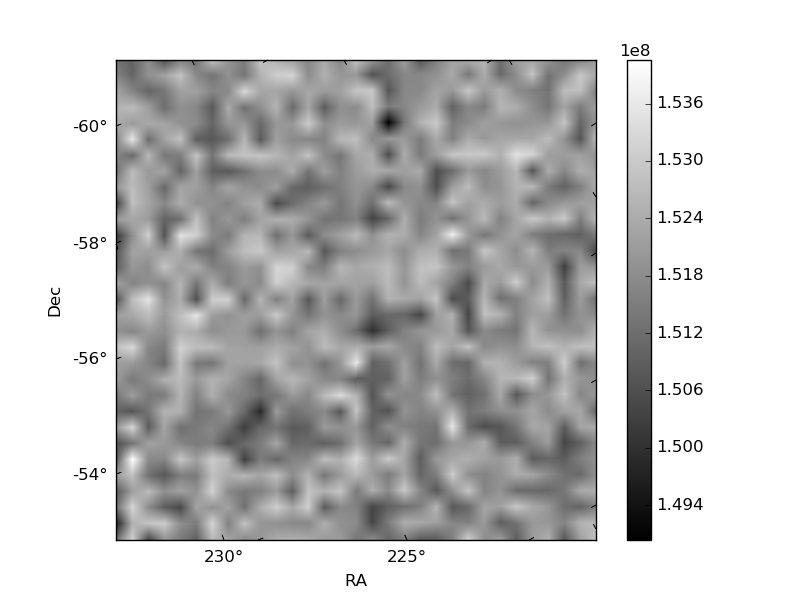
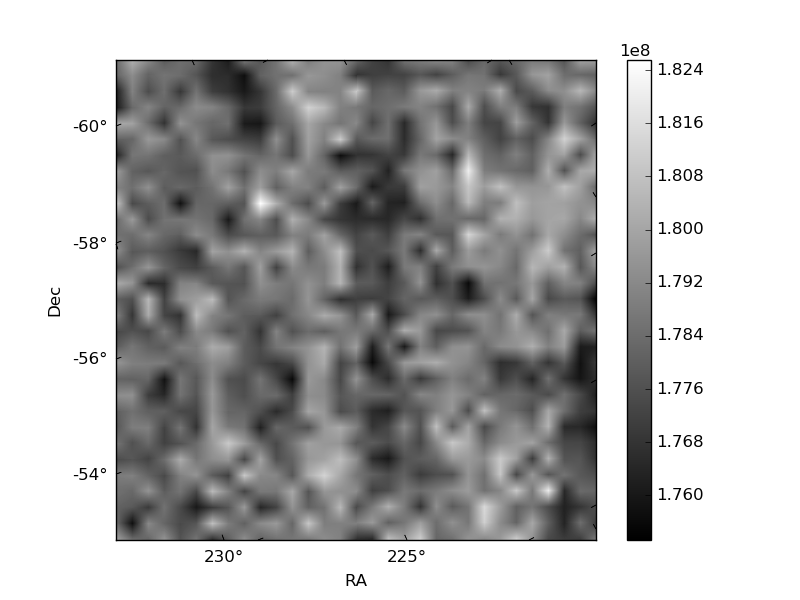
Histogram calculated using DETX and DETY for each event in the final _common_clean file
| Quadrant A | 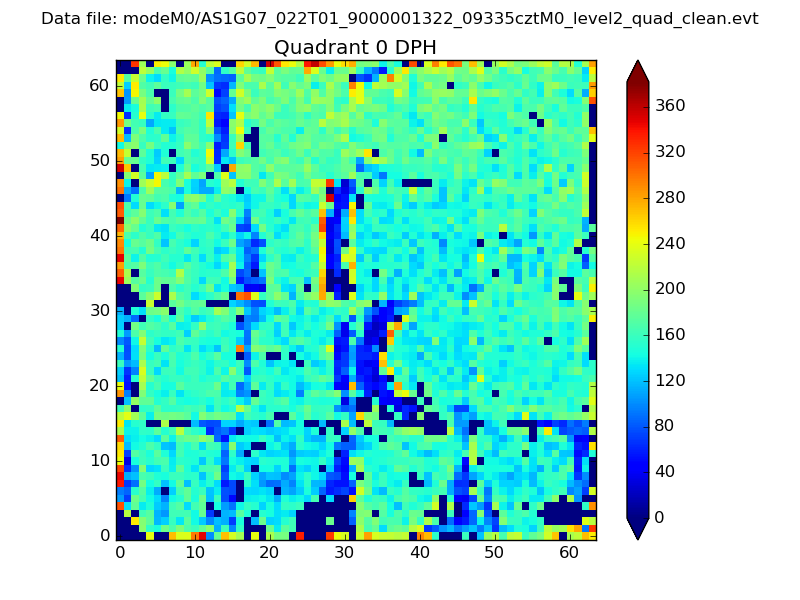 |
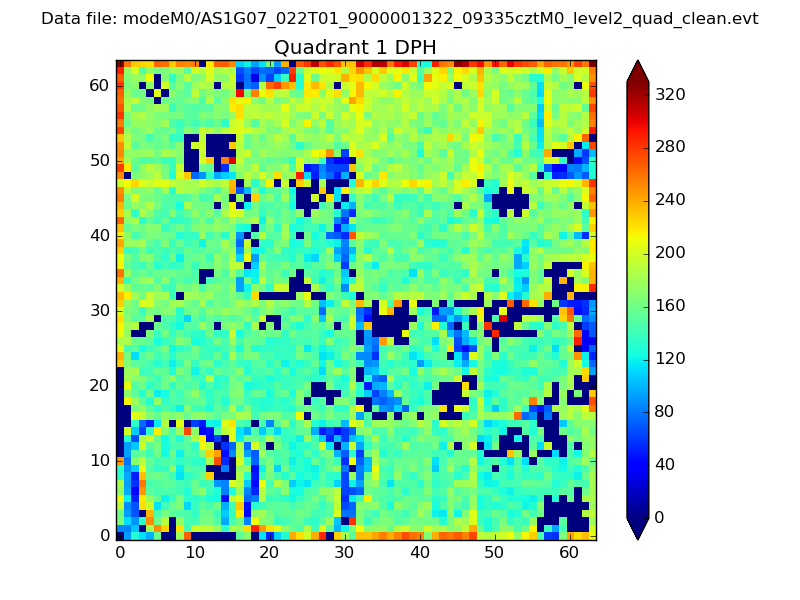 |
Quadrant B |
|---|---|---|---|
| Quadrant D | 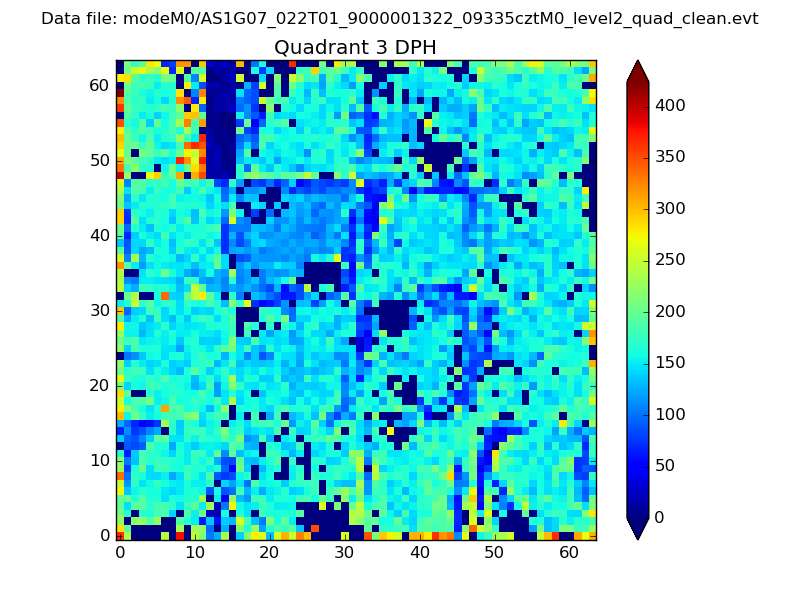 |
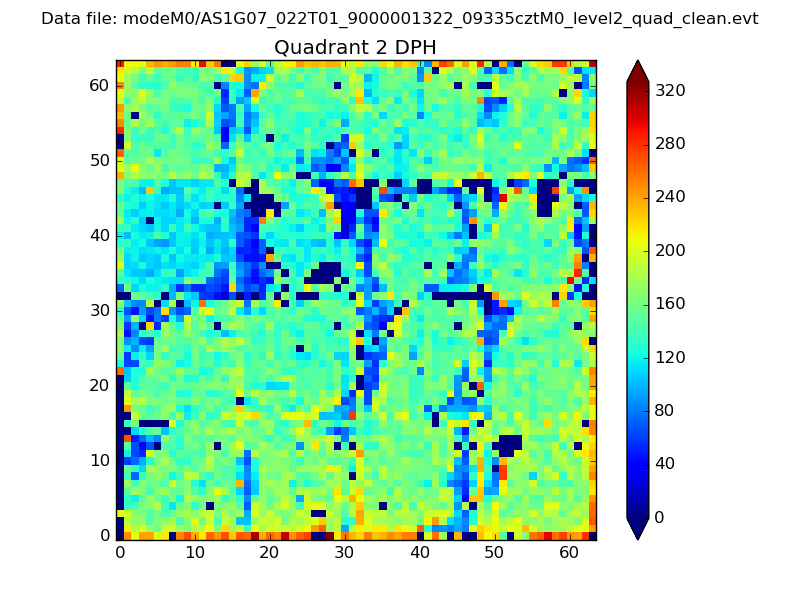 |
Quadrant C |
| Plot type | Count rate plots | Images |
|---|---|---|
| Comparison with Poisson distribution Blue bars denote a histogram of data divided into 1 sec bins. Red curve is a Poisson curve with rate = median count rate of data. |
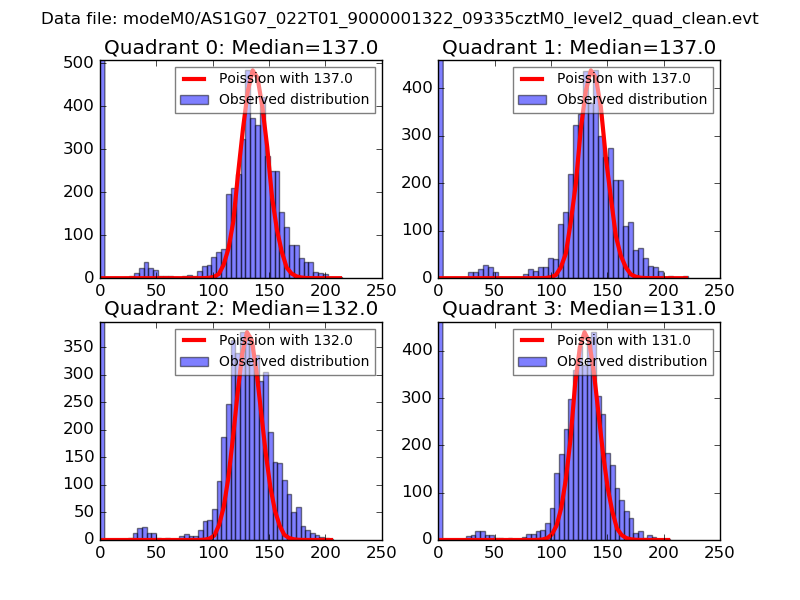 |
 |
| Quadrant-wise count rates Data is divided into 100 sec bins |
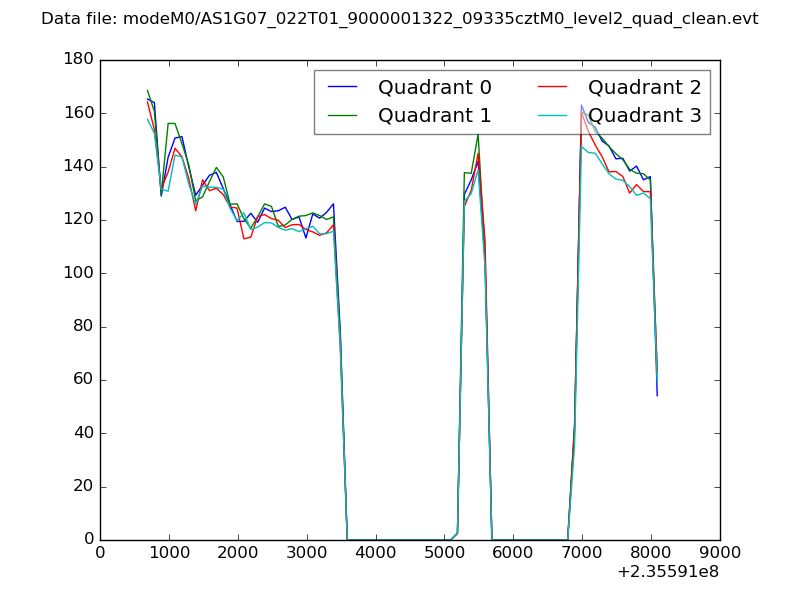 |
|
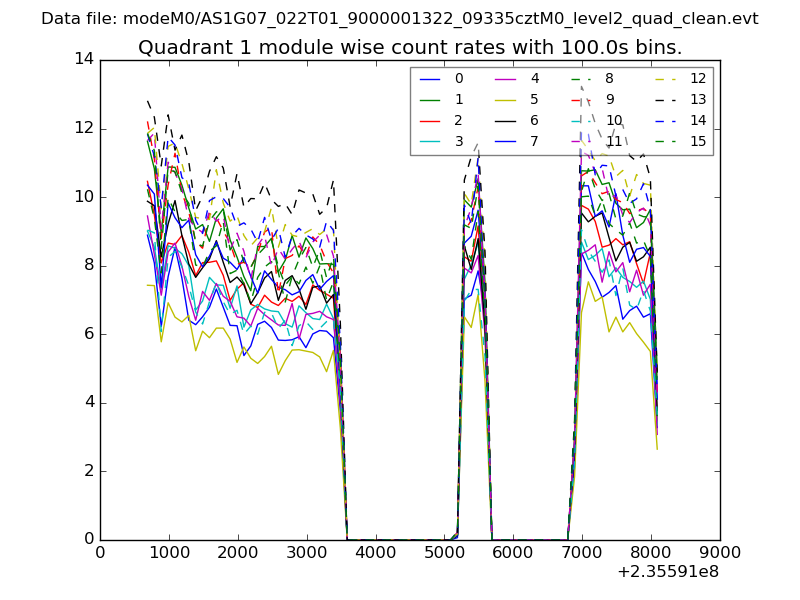
| Module-wise count rates for Quadrant A Data is divided into 100 sec bins |
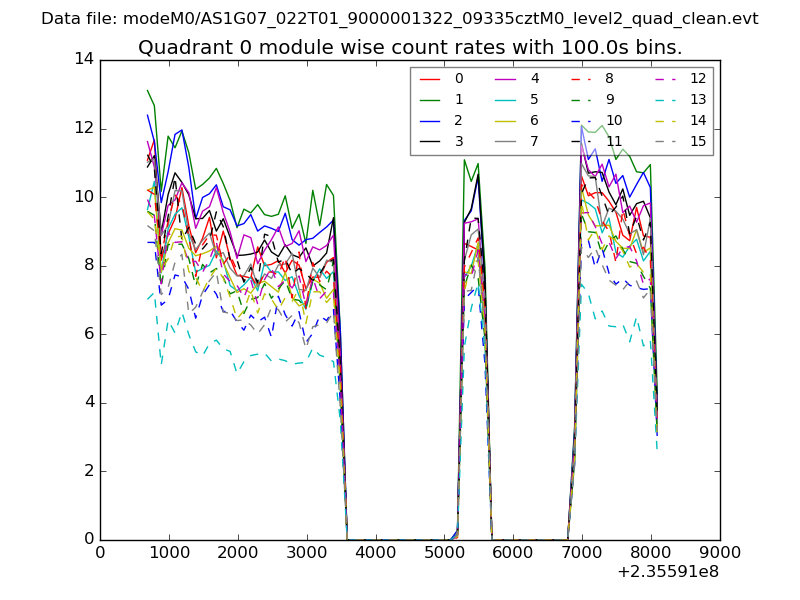 |
 |
| Module-wise count rates for Quadrant B Data is divided into 100 sec bins |
 |
 |
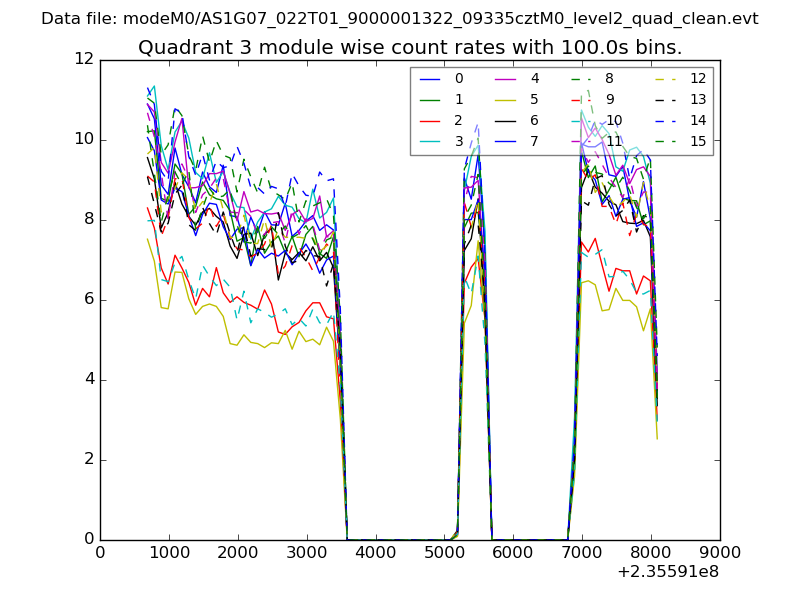
| Module-wise count rates for Quadrant C Data is divided into 100 sec bins |
 |
 |
| Module-wise count rates for Quadrant D Data is divided into 100 sec bins |
 |
 |
| Parameter | Plot |
|---|---|
| CZT HV Monitor | 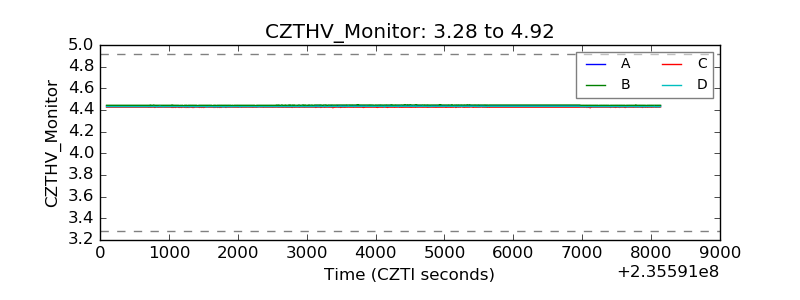 |
| D_VDD | 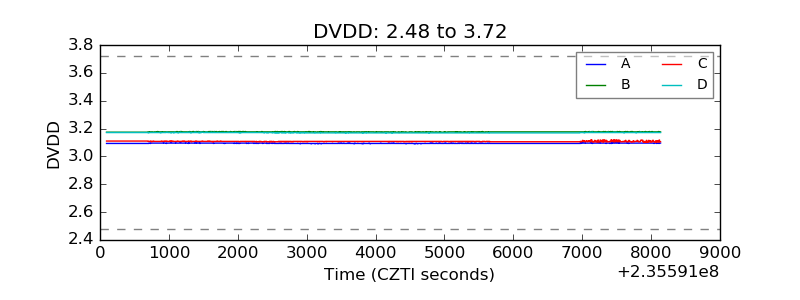 |
| Temperature 1 | 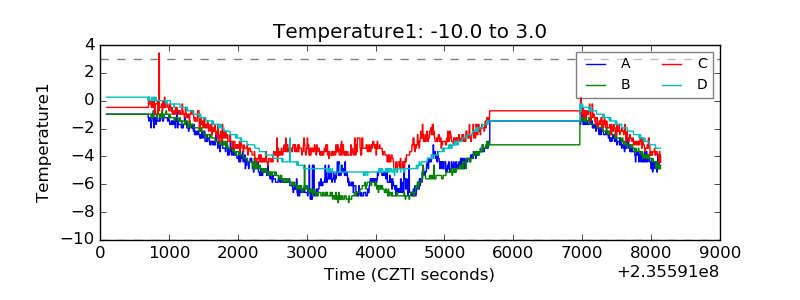 |
| Veto HV Monitor | 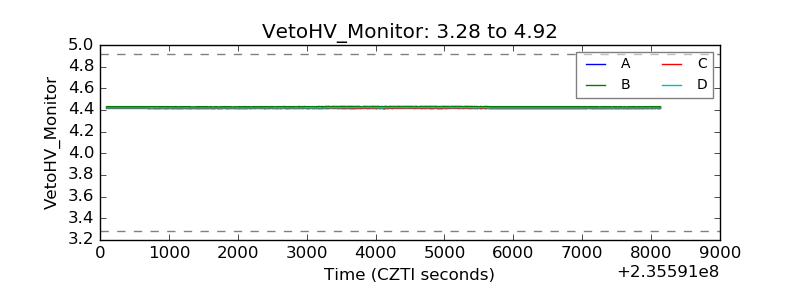 |
| Veto LLD | 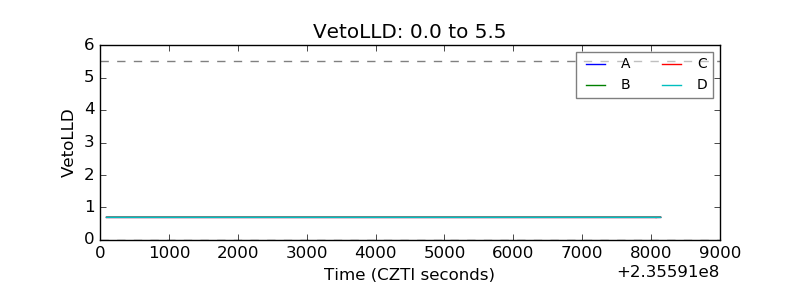 |
| Alpha Counter | 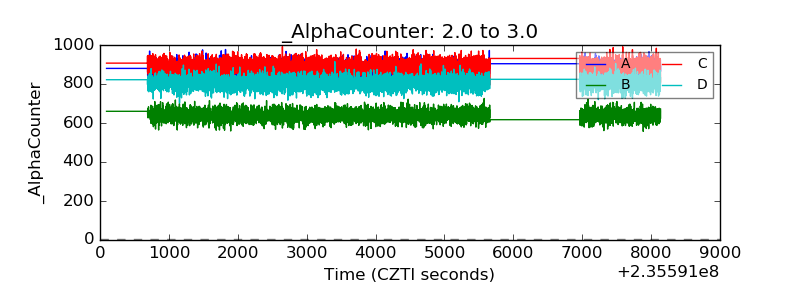 |
| _CPM_Rate | 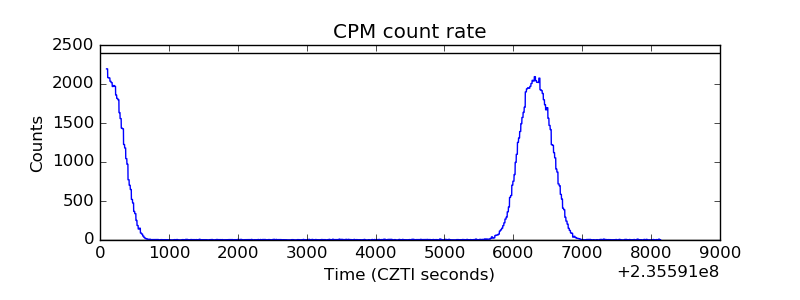 |
| CZT Counter | 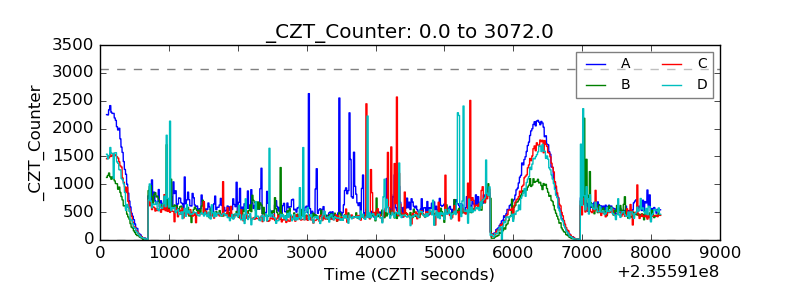 |
| +2.5 Volts monitor | 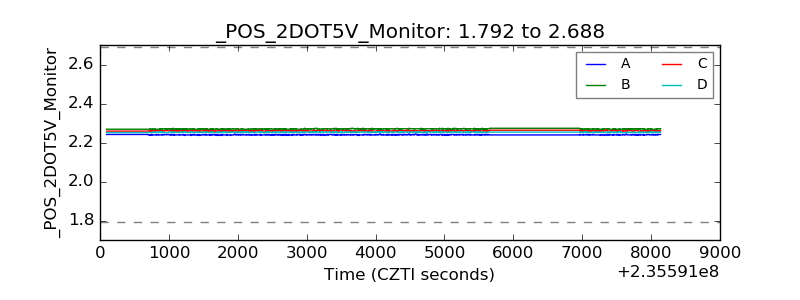 |
| +5 Volts monitor |  |
| _ROLL_ROT |  |
| _Roll_DEC | 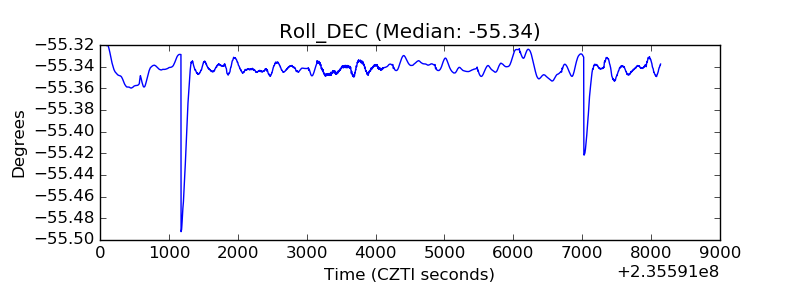 |
| _Roll_RA | 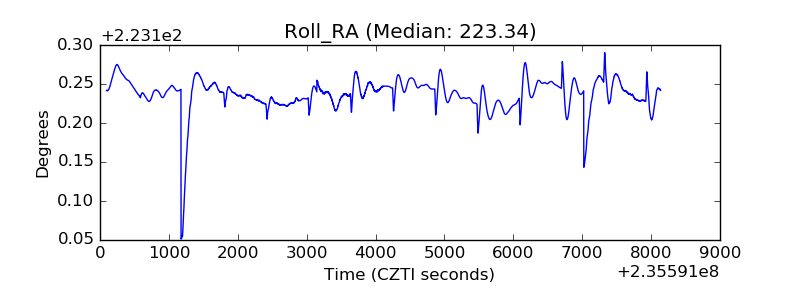 |
| Veto Counter | 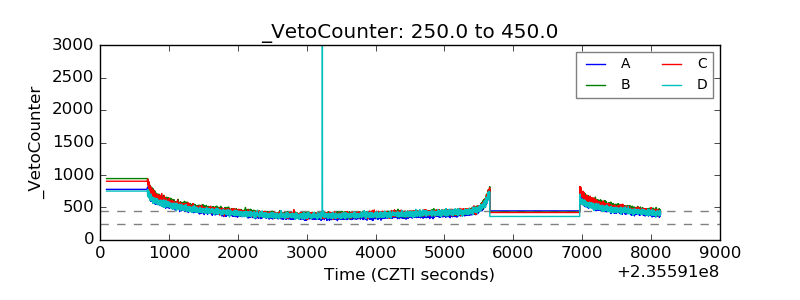 |