| Param | Original file | Final file |
|---|---|---|
| Filename | modeM0/AS1G07_022T01_9000001322_09336cztM0_level2.evt | modeM0/AS1G07_022T01_9000001322_09336cztM0_level2_quad_clean.evt |
| Size (bytes) | 452,761,920 | 90,636,480 |
| Size | 431.8 MB | 86.4 MB |
| Events in quadrant A | 3,998,395 | 587,531 |
| Events in quadrant B | 2,999,404 | 598,140 |
| Events in quadrant C | 3,068,786 | 575,463 |
| Events in quadrant D | 3,232,760 | 559,430 |
| Mode M0 | |||
|---|---|---|---|
| Quadrant | BADHDUFLAG | Total packets | Discarded packets |
| A | 0 | 16130 | 34 |
| B | 0 | 12900 | 25 |
| C | 0 | 13297 | 13 |
| D | 0 | 13803 | 28 |
| Mode SS | |||
|---|---|---|---|
| Quadrant | BADHDUFLAG | Total packets | Discarded packets |
| A | 0 | 122 | 0 |
| B | 0 | 122 | 0 |
| C | 0 | 122 | 0 |
| D | 0 | 122 | 2 |
| Mode M9 | |||
|---|---|---|---|
| Quadrant | BADHDUFLAG | Total packets | Discarded packets |
| A | 0 | 19 | 0 |
| B | 0 | 19 | 0 |
| C | 0 | 19 | 0 |
| D | 0 | 20 | 0 |
| Quadrant | Total seconds | Saturated seconds | Saturation percentage |
|---|---|---|---|
| A | 6081 | 52 | 0.855123% |
| B | 6083 | 29 | 0.476738% |
| C | 6088 | 49 | 0.804862% |
| D | 6082 | 77 | 1.266031% |
Noise dominated data is calculated using 1-second bins in cleaned event files. If a bin has >2000 counts, and if more than 50% of those come from <1% of pixels, then it is considered to be noise-dominated and hence unusable.
| Quadrant | # 1 sec bins | Bins with >0 counts | Bins with >2000 counts | High rate bins dominated by noise | Noise dominated (total time) | Noise dominated (detector-on time) | Marked lightcurve |
|---|---|---|---|---|---|---|---|
| A | 7424 | 6095 | 18 | 18 | 0.24% | 0.30% | 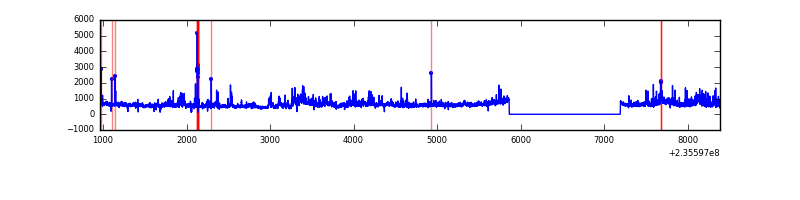 |
| B | 7424 | 6095 | 8 | 8 | 0.11% | 0.13% | 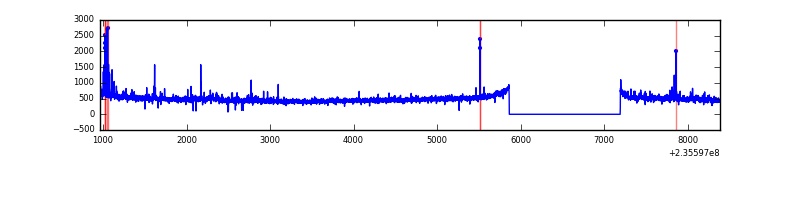 |
| C | 7424 | 6095 | 26 | 26 | 0.35% | 0.43% | 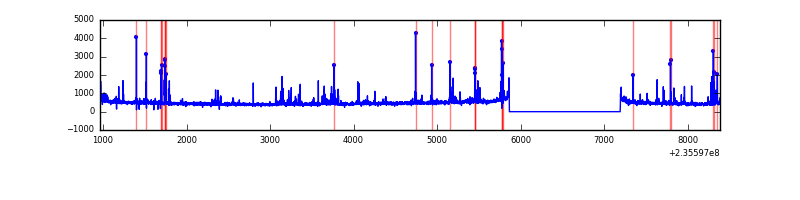 |
| D | 7424 | 6094 | 69 | 69 | 0.93% | 1.13% | 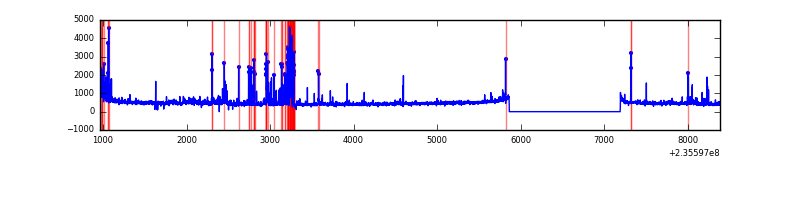 |
Top three noisy pixels from each quadrant. If the there are fewer than three noisy pixels in the level2.evt file, extra rows are filled as -1
| Pixel properties | Quadrant properties | ||||||
|---|---|---|---|---|---|---|---|
| Quadrant | DetID | PixID | Counts | Sigma | Mean | Median | Sigma |
| A | 8 | 5 | 991897 | 6793.67 | 726 | 714 | 145.9 |
| A | 5 | 16 | 81772 | 555.58 | 726 | 714 | 145.9 |
| A | 13 | 251 | 70214 | 476.36 | 726 | 714 | 145.9 |
| B | 0 | 219 | 40687 | 288.51 | 736 | 719 | 138.5 |
| B | 0 | 246 | 38444 | 272.32 | 736 | 719 | 138.5 |
| B | 0 | 214 | 25378 | 178.0 | 736 | 719 | 138.5 |
| C | 4 | 254 | 327402 | 2035.14 | 696 | 699 | 160.5 |
| C | 8 | 128 | 10711 | 62.37 | 696 | 699 | 160.5 |
| C | 8 | 112 | 5972 | 32.85 | 696 | 699 | 160.5 |
| D | 12 | 233 | 349280 | 1918.96 | 690 | 672 | 181.7 |
| D | 13 | 105 | 113149 | 619.14 | 690 | 672 | 181.7 |
| D | 7 | 71 | 48837 | 265.13 | 690 | 672 | 181.7 |
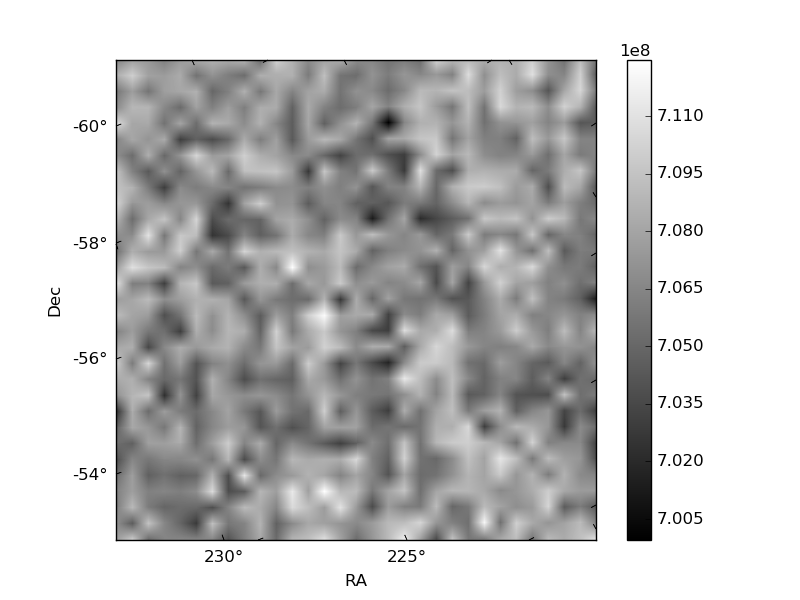
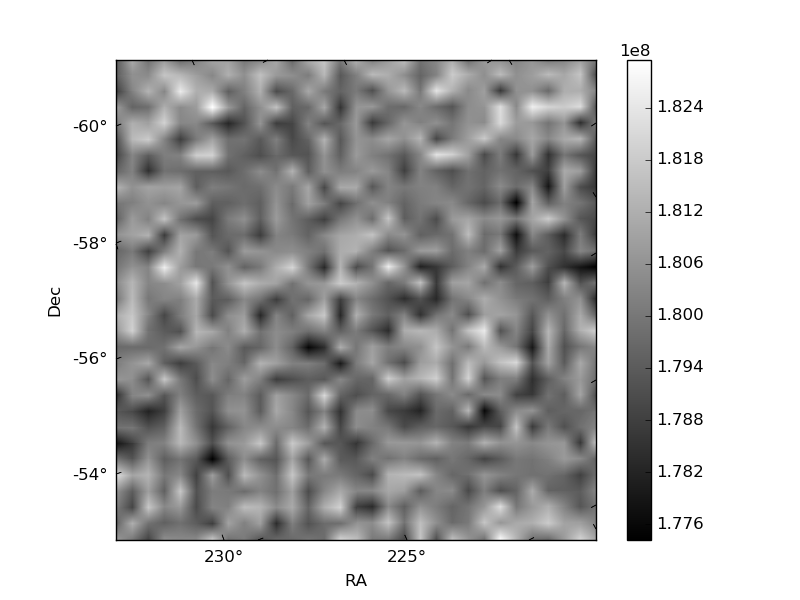
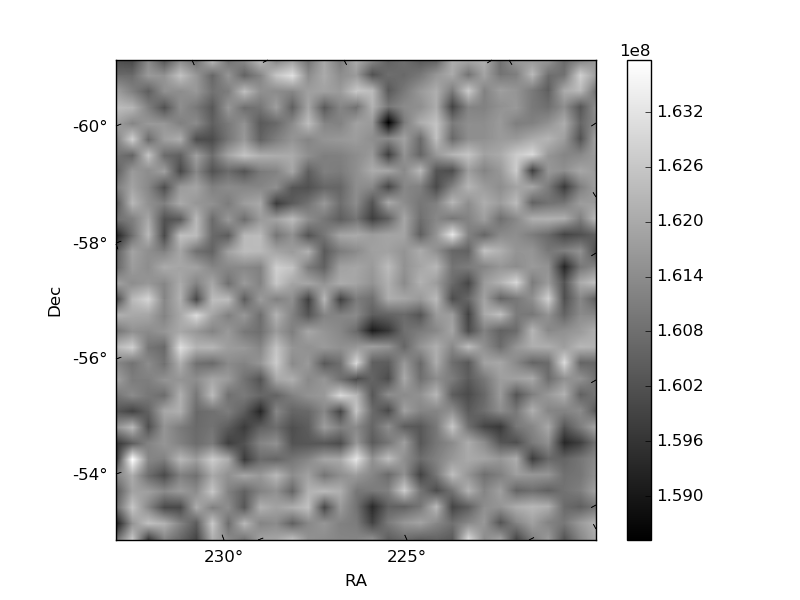
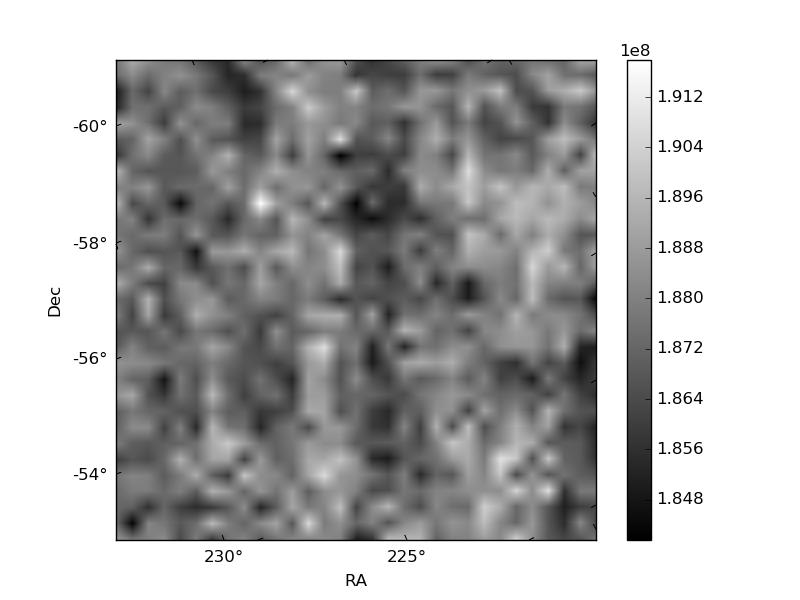
Histogram calculated using DETX and DETY for each event in the final _common_clean file
| Quadrant A | 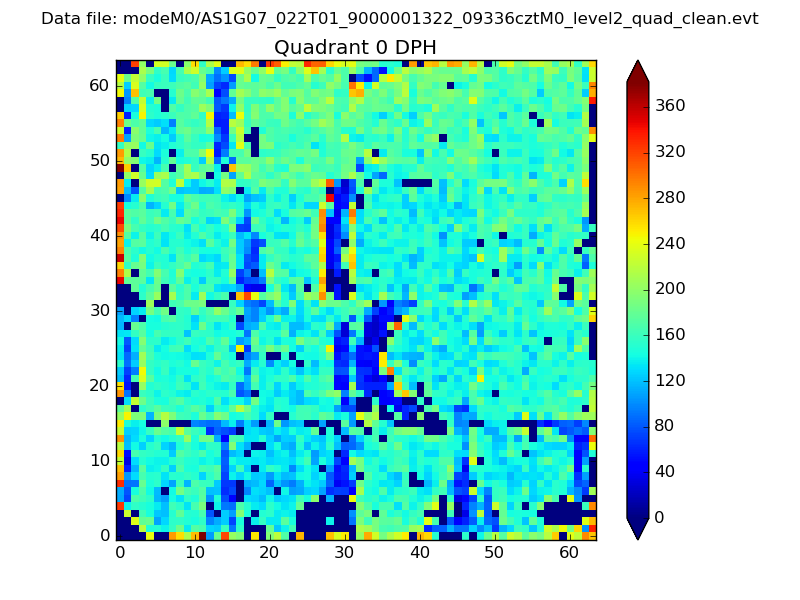 |
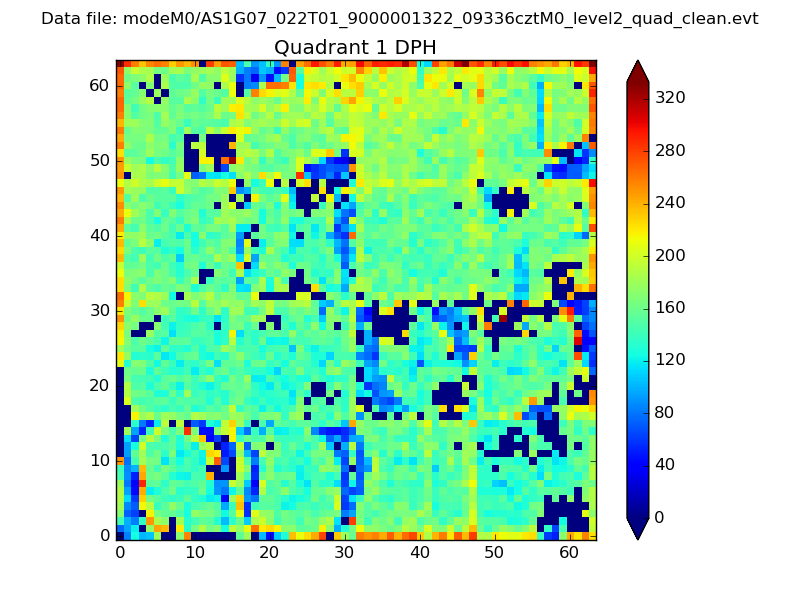 |
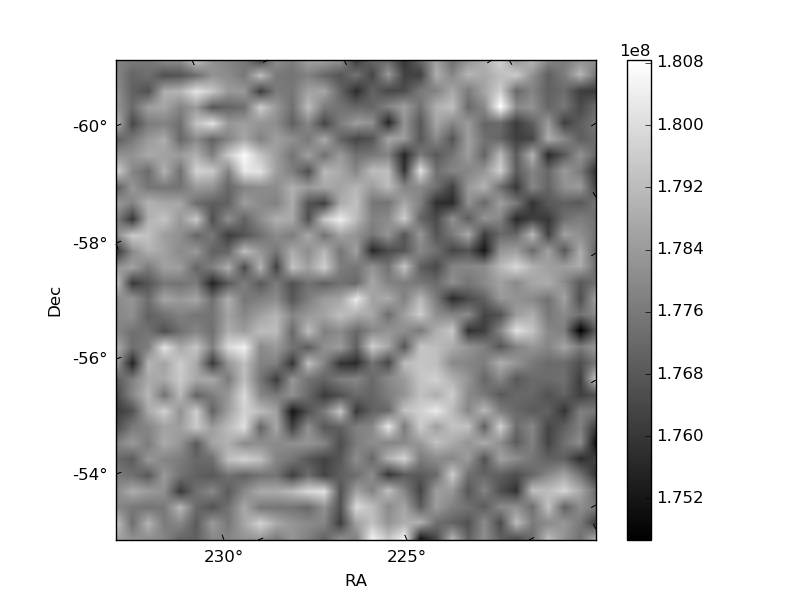
Quadrant B |
|---|---|---|---|
| Quadrant D | 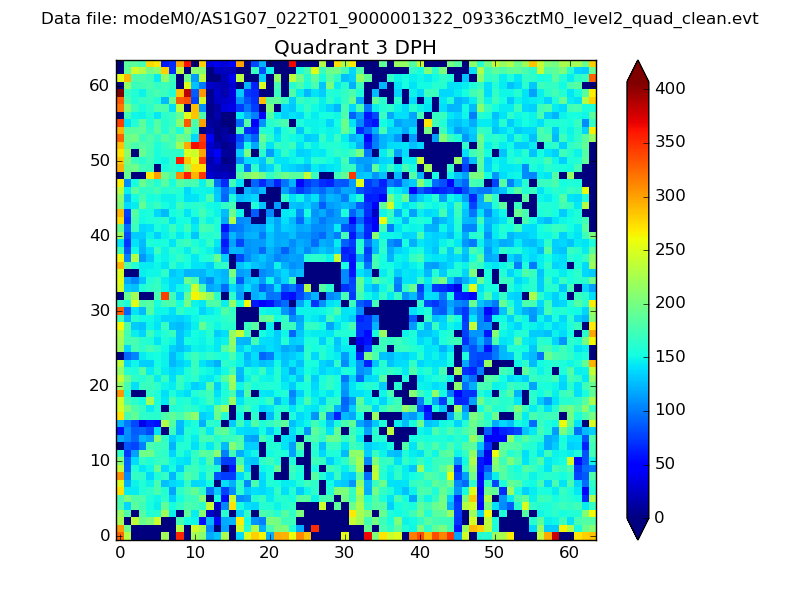 |
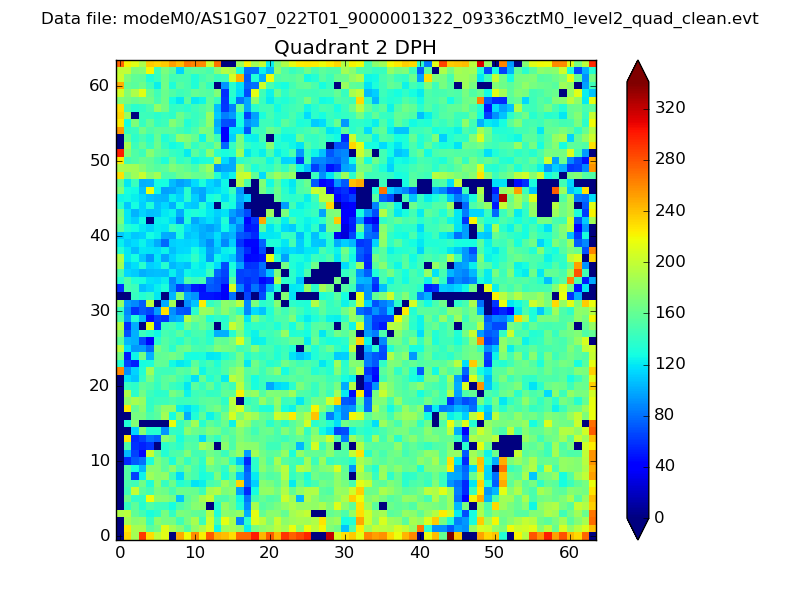 |
Quadrant C |
| Plot type | Count rate plots | Images |
|---|---|---|
| Comparison with Poisson distribution Blue bars denote a histogram of data divided into 1 sec bins. Red curve is a Poisson curve with rate = median count rate of data. |
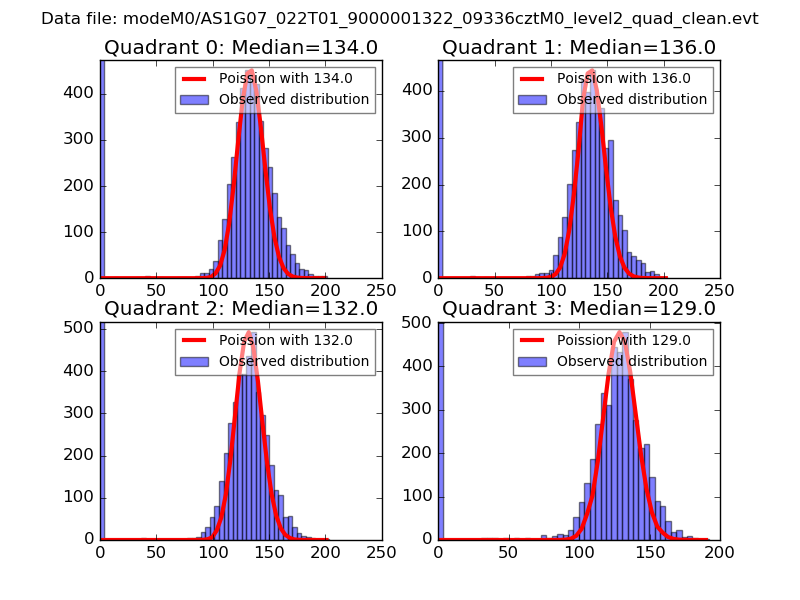 |
 |
| Quadrant-wise count rates Data is divided into 100 sec bins |
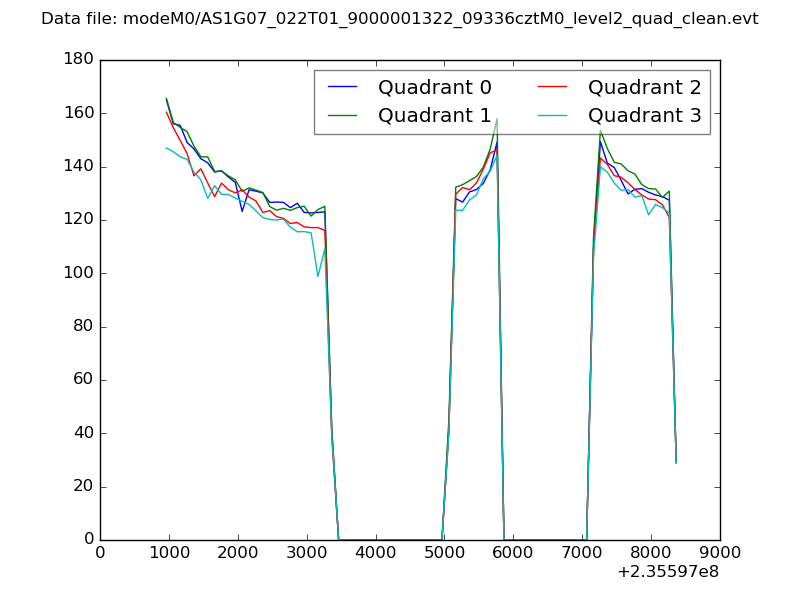 |
|
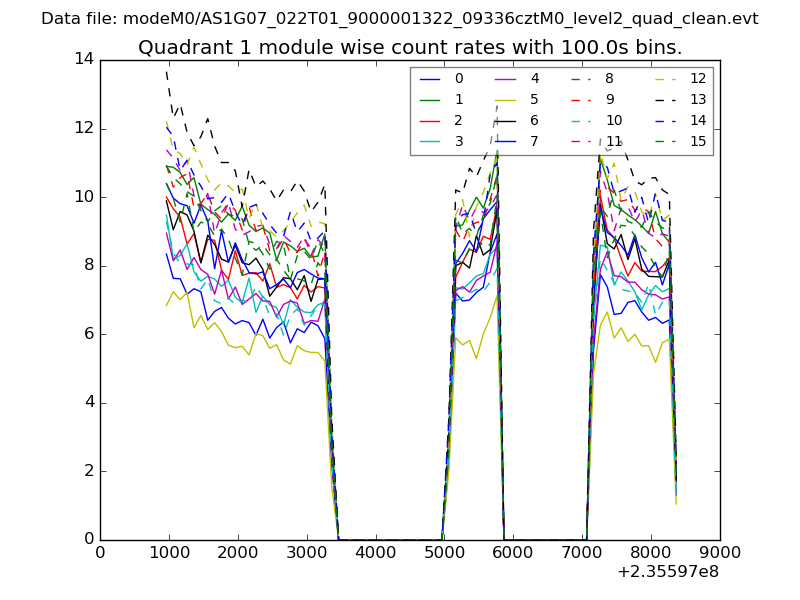
| Module-wise count rates for Quadrant A Data is divided into 100 sec bins |
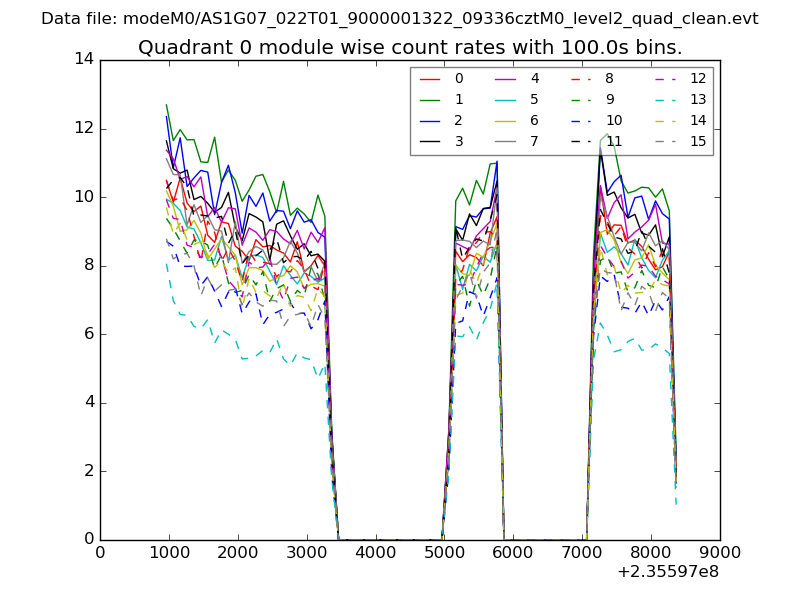 |
 |
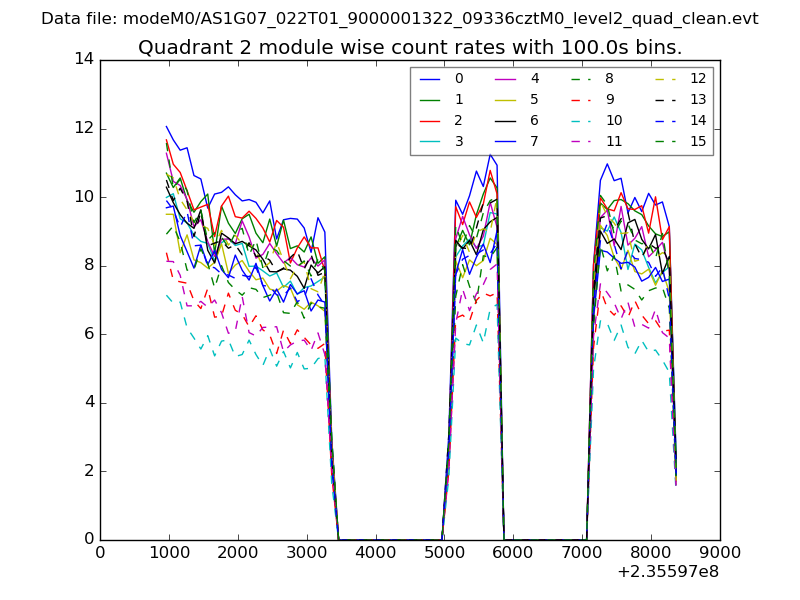
| Module-wise count rates for Quadrant B Data is divided into 100 sec bins |
 |
 |
| Module-wise count rates for Quadrant C Data is divided into 100 sec bins |
 |
 |
| Module-wise count rates for Quadrant D Data is divided into 100 sec bins |
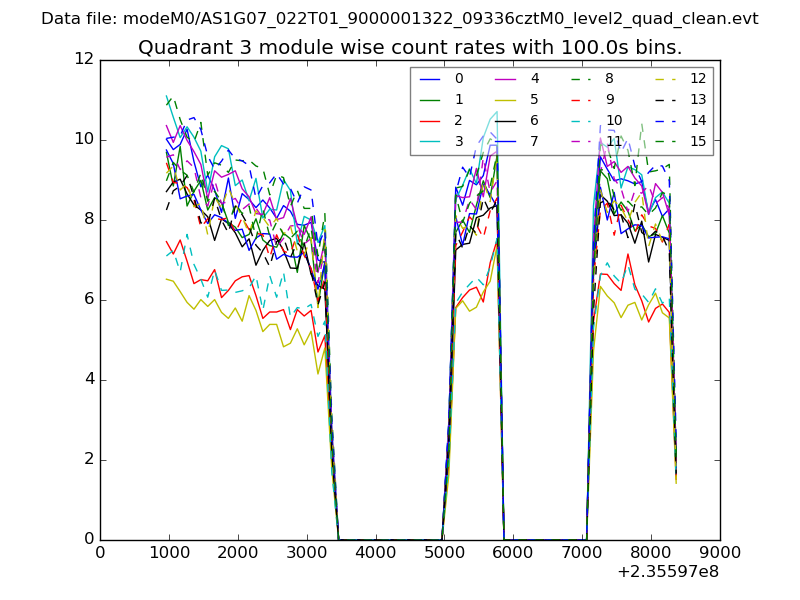 |
 |
| Parameter | Plot |
|---|---|
| CZT HV Monitor | 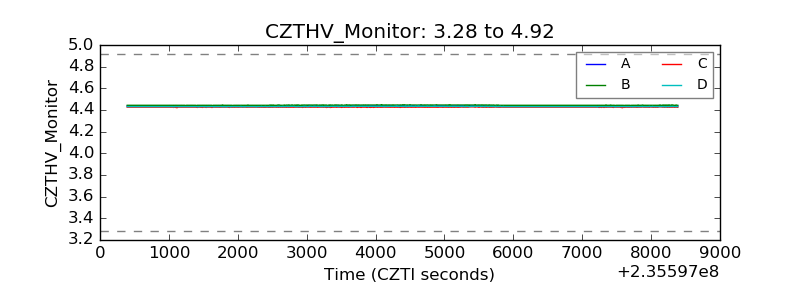 |
| D_VDD | 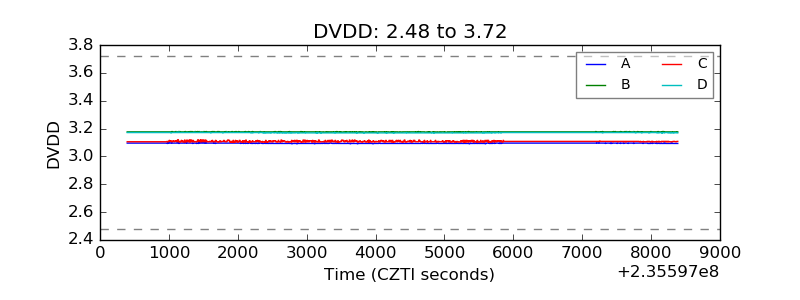 |
| Temperature 1 | 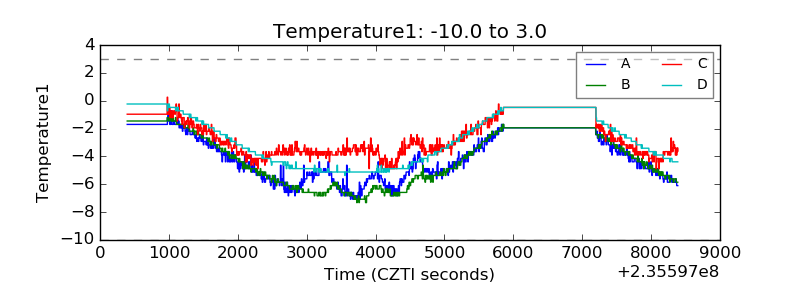 |
| Veto HV Monitor | 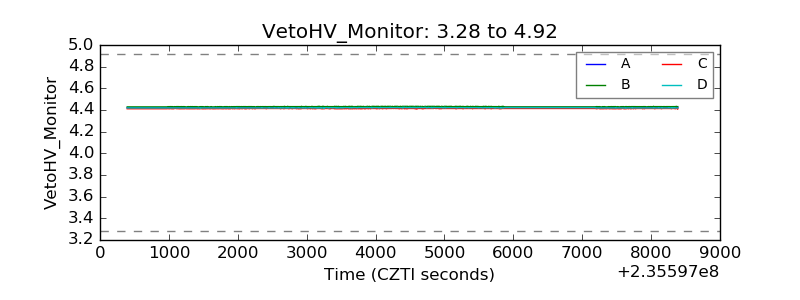 |
| Veto LLD | 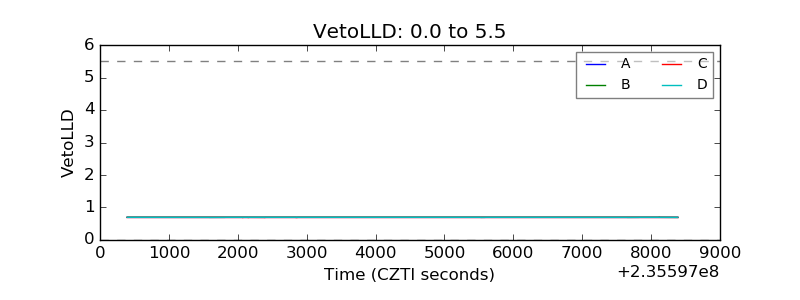 |
| Alpha Counter | 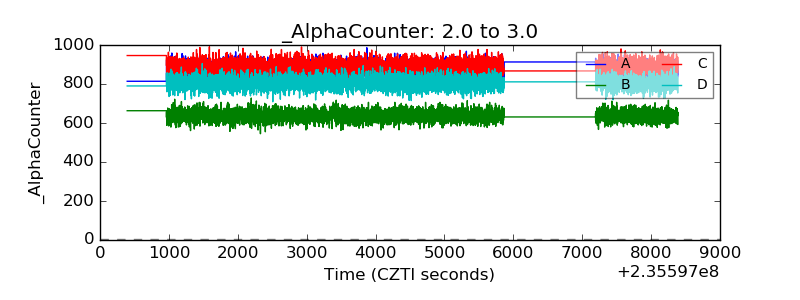 |
| _CPM_Rate | 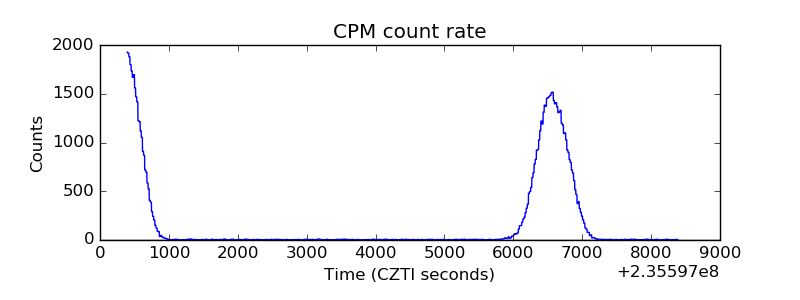 |
| CZT Counter | 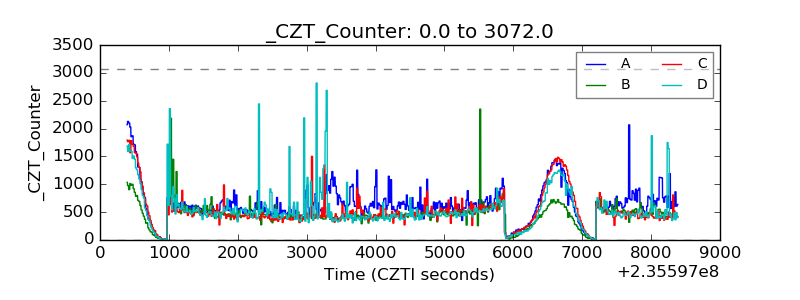 |
| +2.5 Volts monitor |  |
| +5 Volts monitor |  |
| _ROLL_ROT | 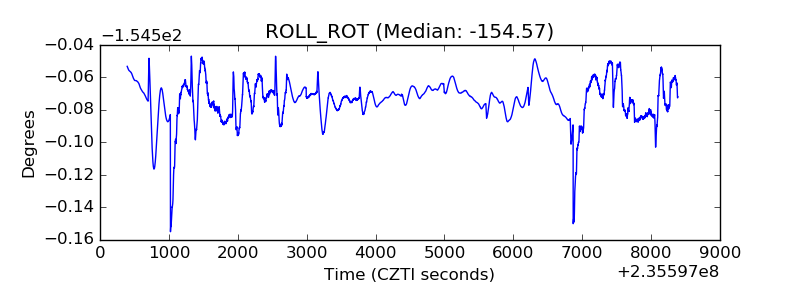 |
| _Roll_DEC | 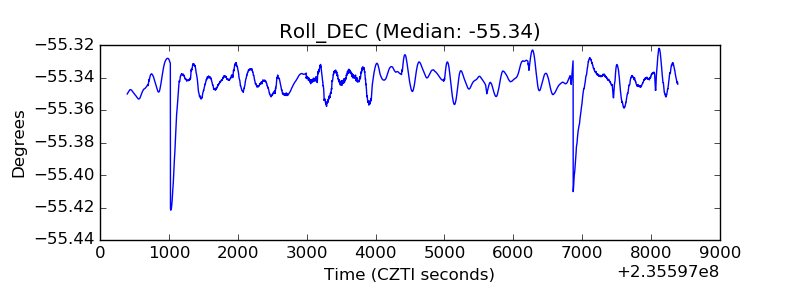 |
| _Roll_RA | 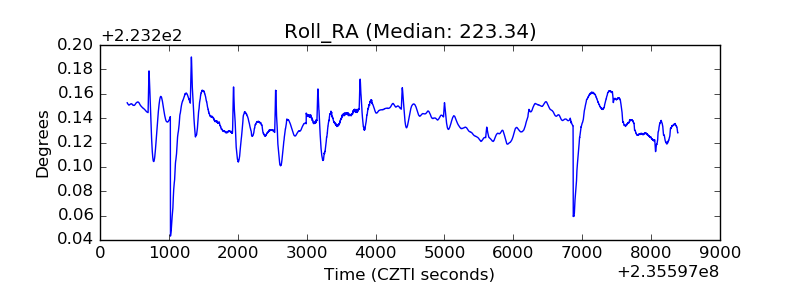 |
| Veto Counter | 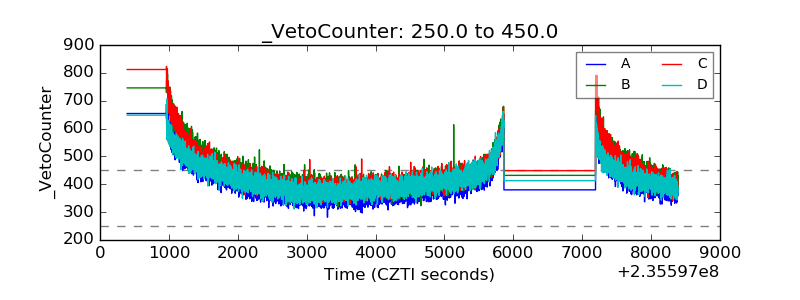 |